I/O Fund’s Semiconductor Q4 2021 Earnings Preview
January 21, 2022

I/O Fund
Team
TSMC broke off Q4 semiconductor earnings after it reported on 01/13/22. Sales at the massive foundry pure play grew 21% YoY in Q4, and net income increased 16%, setting the stage for a strong earnings season for the semiconductor industry. In the analysis that follows, I give a brief overview of the semiconductor industry and discuss key metrics that investors should be aware of heading in Q4 earnings.
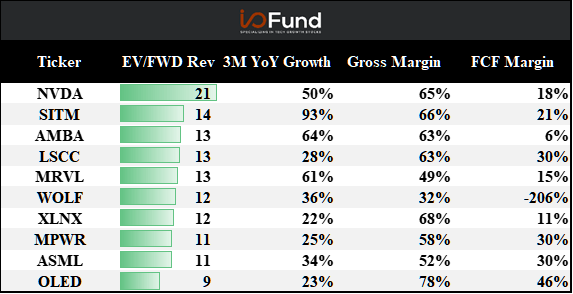
Semiconductors: Top 10 EV/FWD Revenue Multiples
Below is a table of semiconductor stocks ranked by their EV/1-year forward sales multiples, along with their most recent YoY growth rate, gross and free cashflow (FCF) margins. Semiconductors experienced strong demand in 2021 and the market has rewarded the outperformers with premium multiples. Nvidia (NVDA) sports the highest multiple of the group at 21x, likely due to Nvidia’s dominate position with GPUs and its strong topline growth rate.
There are a cluster of other top performing semiconductor firms valued around 11x to 14x EV/Fwd revenues, such as ASML, a leading semiconductor equipment provider that has seen strong demand as capacity in the sector ramps up to address supply issues. Another standout is WOLF, which has seen strong demand for silicon carbide solutions, a relatively new technology that is being adopted by the automotive market. WOLF claims that it is the sole vertically integrated supplier of silicon carbide for high power and RF application, which likely contributes to its premium multiple.

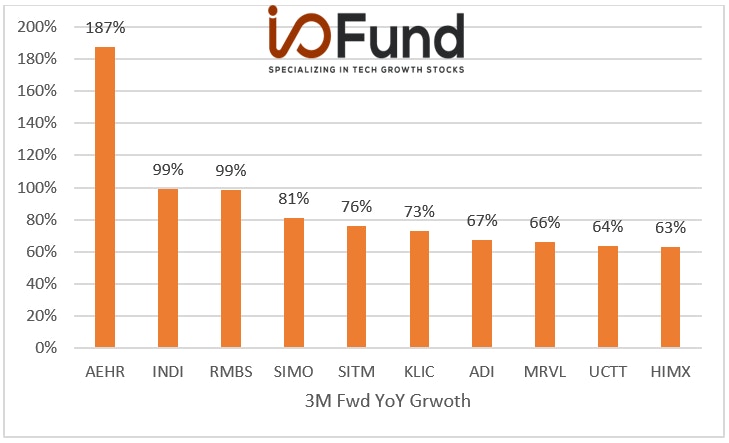
Semiconductors: Top 10 Three-month Forward YoY Growth Rates
Below is a chart of forward sales growth expectations for the semiconductor industry. Looking forward, AEHR is forecasted to grow the strongest from our universe of semiconductor stocks (n=74). The company is benefiting from tailwinds in EV and datacenter exposures, which are expected to ramp in the near term. INDI is also expected to grow strongly in the upcoming quarter as the company guided for more than 50% sequential growth heading into Q4, driven by demand for its solutions in the automotive sector and a recent acquisition. RMBS is also expected to grow nearly 100% next quarter, as demand for its memory interface chips remains strong in the current environment. Our research suggests that demand for automotive and memory solutions in the semiconductor industry are strong tailwinds heading into Q4 earnings.

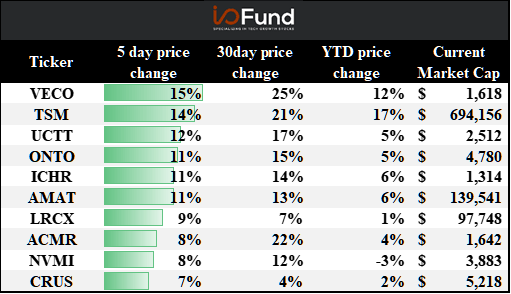
Top 10 Weekly Share Price Movements
Below is a table of the weekly change in share price for our universe of semiconductor stocks (week ended 01/14). TSM has already reported Q4 results, and the foundry pure play’s results came in strong as the company guided Q1 2022 sales to increase 8% sequentially, up from its most recent 6% QoQ growth rate. The strong guide likely led to the strong price action in TSM’s shares. Many other top performing semiconductor stocks are equipment providers, such as VECO, UCTT, ICHR, AMAT and LRCX. The market is likely pricing in increased demand for semiconductor equipment, as fab expansions lead to more equipment purchases going forward.

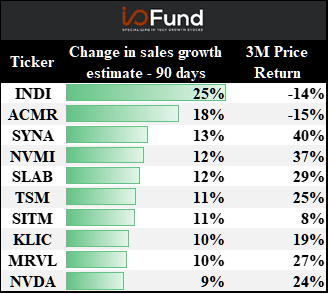
Top 10 Changes in sales growth estimates – last 90 days
The table below ranks the semiconductor companies by their topline revisions over the last 90 days. An increase in topline revisions signals that the Street believes that the company will grow faster than initially believed. INDI has had the largest topline revision in the semiconductor industry, as the company guided for 50% sequential growth, which includes benefits from its recent acquisition of TeraXion. SYNA has also had its topline estimates revised up by 13% over the last 90 days, driven in part by its recent acquisition of DSP Group, which the company explained would help it expand its ability to cross-sell AI solutions at the edge of the network. The market likely agrees with management and its share are up 40% over the last 90 days.

Update on EV/Fwd revenue multiples:
Overall stats:
- Overall Semiconductor forward median: 5x
- Top 5 Semiconductor forward median: 14x
- Overall Semiconductor forward average: 6x
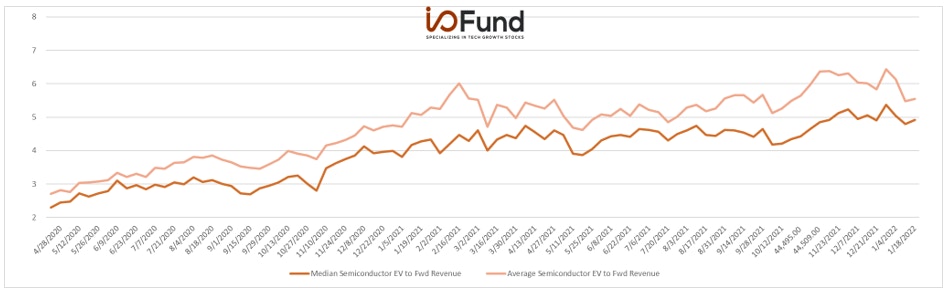
EV/FWD SALES:
As shown below, the median and average semiconductor EV/1-year forward sales multiple has trended up since April 2020. Semiconductor valuations have increased as demand for semis has remained robust, driven by a global chip shortage. The world may be entering a new normal where semiconductors are used in everything, such as datacenters, automotive, and IoT devices. This trend reduces their cyclical nature and has likely led the market to reward the industry with a premium multiple. This will likely be a multi-year trend and if the semiconductors cycles continue to shorten, then multiples may continue to rise.
Sign up for I/O Fund's free newsletter with gains of up to 1100% - Click here

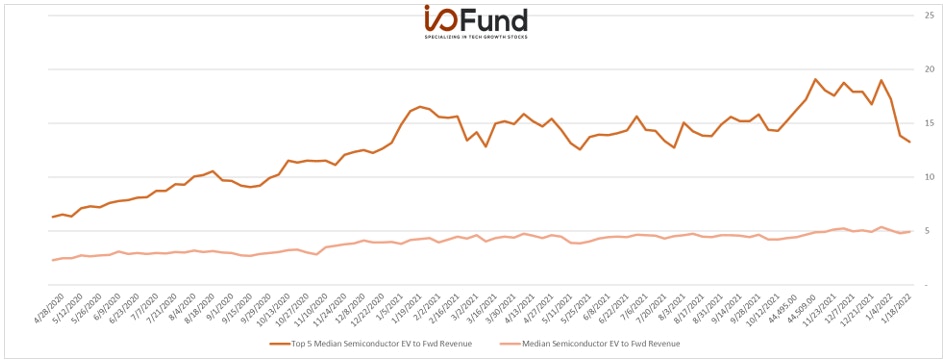
Top 5 EV/FWD SALES:
In the chart below, we can more clearly see the large dispersion in semiconductor valuations, as the top 5 premium valued semiconductor stocks have had their EV/Fwd sales multiples expand since 2020. The median multiple has also expanded, but at a slower pace. However, the delta between the top 5 and the median semiconductor stock has started to narrow in 2022, as the median valuation remained relatively static while the top 5 has had their valuations compress. If Q4 earnings come in strong, then the market may push valuations back up to their historic highs.

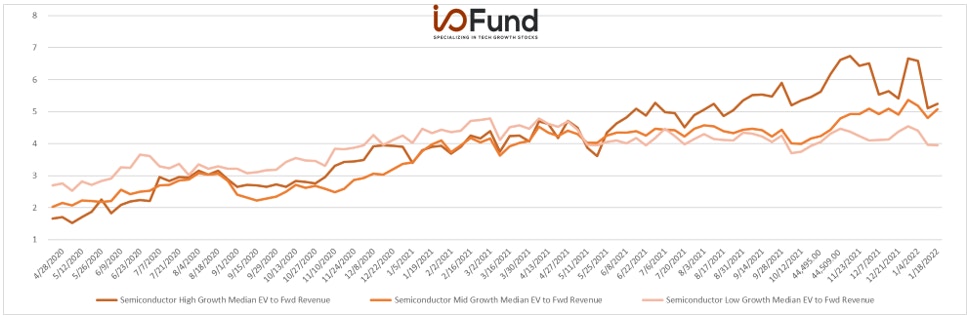
EV TO FWD Sales Growth Buckets:
We can further dissect the change in semiconductor valuations by breaking up the group into high growth (>30%), mid growth (>15% and <30%) and low growth (<15%). The below chart shows the historical valuations for stocks in various growth buckets. High growth semiconductor stocks have had their valuations compress recently relative to mid-growth semiconductors. Q4 earnings will be pivotal for the high growth semiconductors, and the market will likely reward the group with higher multiples if growth remains strong going forward.

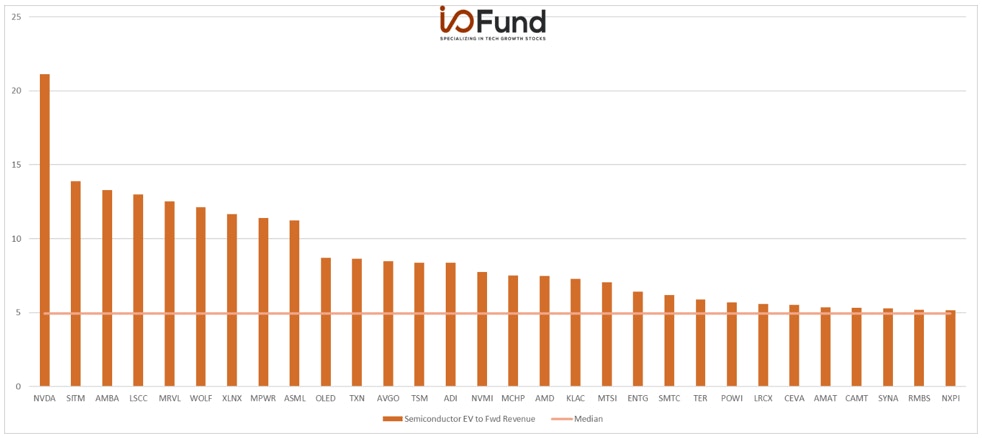
Top EV TO FWD SALES:
The below chart provides a more holistic view of the semiconductor industry ahead of Q4 earnings, sorted by their EV to Fwd revenue multiples. NVDA has the richest valuation and is valued well above the peer median of 5x. Nvidia is benefitting from multiple tailwinds, such as data center growth, gaming, cryptocurrency, and automotive. Lead tech analyst Beth Kindig outlined why she believes that Nvidia will be worth more than Apple in the future, stating that “I believe Nvidia is capable of out-performing all five FAAMG stocks and will surpass even Apple’s valuation in the next five years”.

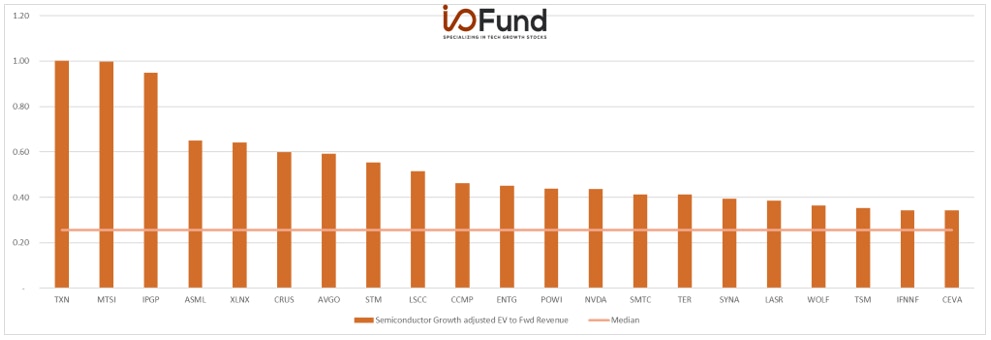
Growth adjusted EV/Fwd Revenue (EV/Fwd Rev/Fwd Growth)
The last chart is based on EV to FWD sales but also takes into account forward growth expectations. By scaling valuation relative to forward growth, we can more clearly see which companies are cheapest relative to forward growth. A low value in the below chart means that a company is cheap relative to growth. Note that some names may be skewed due to acquisitions. It is interesting to note that NVDA falls from being the richest valued semiconductor stock to closer to the median once you take into account its strong growth rate. TXN and MTSI are some of the most expensive semiconductor stocks based on this metric and others such as AEHR and KLIC are cheapest (not shown).

Finally, the last table we will be discussing includes aggregate semiconductor operating metrics. The below table illustrates the median topline growth, margins and FCF generation for the semiconductor industry. The median growth rate was 32%, and the market expects the median semiconductor stock to grow 20% in Q4. Gross margin remains robust at nearly 50% and cashflows are also healthy at 16% of three-month sales for the median semiconductor. Strong growth, margins and cashflows highlight the strong health of the semiconductor industry, which makes sense considering the outsized demand for chips in the current market.

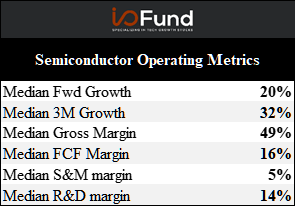
Strong growth and positive cashflows signal that the semiconductor industry is healthy and performing well. The I/O Fund expects this strength to continue going forward. Find out which semiconductor stocks the I/O Fund will be watching heading into Q4 earnings in our I/O Fund’s Preview of 7 Semiconductor Stocks Ahead of Q4 Earnings.
The I/O Fund is a team of analysts that share their research publicly as they build a portfolio of 30 stocks. Our team has record results for a retail Fund and we also have four-digit gains on some of our free newsletter coverage. You can learn more about our premium service by clicking here or sign up for our free newsletter here.
Disclaimer: This is not financial advice. Please consult with your financial advisor in regards to any stocks you buy.
Gains of up to 2,390% from our Free Newsletter.
Here are sample stock gains from the I/O Fund’s newsletter --- produced weekly and all for free!
+2,390% on Nvidia
+450% on Bitcoin
*as of Jun 25, 2024
Our newsletter provides an edge in the world’s most valuable industry – technology. Due to the enormous gains from this particular industry, we think it’s essential that every stock investor have a credible source who specializes in tech. Subscribe for Free Weekly Analysis on the Best Tech Stocks.
If you are a more serious investor, we have a premium service that offers lower entries and real-time trade alerts. Sample returns on the premium site include 3,900% on Nvidia, 850% on Chainlink, and 695% on Bitcoin. The I/O Fund is audited annually to prove it’s one of the best-performing Funds on the market, with returns that beat Wall Street funds.


More To Explore
Newsletter
Mag 7 Stocks Should See One More High
Optimism around the Fed could spark a continuation of the relief rally in the Russell 2000 and further rotation out of the Mag 7. Below, we look at the pros and cons of a Mag 7 rotation and how we pla
Palantir’s Stock Is Priced For Perfection
Heading into 2024, Palantir was exhibiting “multiple signs of acceleration” stemming from strong growth in its US commercial segment, driven by AIP, Palantir’s Artificial Intelligence Platform that le
Tesla’s Q2 Deliveries Strong, But What’s To Come?
After months of being the lowest performing Mag 7 stocks, Tesla saw rapid gains — up 42% in a one month rally, with 37% of those gains in eight sessions — after it reported Q2 deliveries ahead of expe

How to Participate in Tech: The Million Dollar Question (Video Highlights)
With audited returns of 131% since inception, compared to the NASDAQ-100’s 82%, portfolio manager, Knox Ridley, lays out how we have successfully maintained an overexposure to the right tech stocks, w

This AI Stock Could Outpace Nvidia’s Returns by 2030
Lead Tech Analyst and CEO Beth Kindig recently joined Real Vision’s Nico Brugge to discuss her AI outlook on leading AI stock Nvidia, while sharing which AI stock she believes may outpace Nvidia’s ret

AI PC Stocks: Emerging 2024 And 2025 Story
Currently, there is a major bottleneck right now for AI applications to where client devices are not powerful enough or energy efficient enough to leverage AI capabilities at the edge.

AI Power Consumption: Rapidly Becoming Mission-Critical
Big Tech is spending tens of billions quarterly on AI accelerators, which has led to an exponential increase in power consumption. Over the past few months, multiple forecasts and data points reveal s

With Bitcoin at All-Time Highs, Here’s What’s Next for COIN, HOOD
Bitcoin and the spot BTC ETFs have clearly seen strong investor appetite since the approval in the beginning of the year. Alongside strong initial adoption of the new ETF class, we’re also seeing majo

Here's Why Nvidia Stock Will Reach $10 Trillion Market Cap By 2030
I believe Nvidia can achieve an astonishing $10 trillion market cap by 2030. As you’ll see from the key points to my thesis, there is a bull case where a $10T market cap estimate in a little over six

Taiwan Semiconductor Stock: April Sales Soar From Advanced Nodes
Despite warning of a slowdown in the broader semiconductor industry this year, TSMC’s April sales surged 60% YoY and 21% MoM. This marks a positive start to the 20-percentage point acceleration to 33%
