Nebius Vs CoreWeave: Which AI Stock Has the Upper Hand?
Written by
I/O Fund Team
Research Team
Published: October 2, 2026
Last Updated: October 2, 2026
On this page
Nebius and CoreWeave are two of the fastest-growing AI infrastructure companies on the market. Yet when it comes to their stocks, the market has rewarded them very differently. Nebius shares have risen around 160% so far in 2026, while CoreWeave is up just over 10% in the same period as of late September.
What makes the divergence particularly interesting is that CoreWeave is undisputedly the larger AI infrastructure provider. CoreWeave generated $2.58 billion in Q2 revenue, up 112% YoY, and exited June with a massive $104 billion backlog. This does not include more than $25 billion in net new customer commitments signed in early Q3.
Meanwhile, Nebius grew revenue 454% YoY in Q2, but off a much smaller base of $582 million, including $575 million from its core AI infrastructure business.
In other words, CoreWeave has considerably more revenue and a massive backlog compared to Nebius. Yet, Nebius has run circles around CoreWeave when it comes to stock performance.
So, what gives? Clearly something is happening beyond the income statement.
Understanding why could help determine whether Nebius can continue its winning streak and, more importantly, what investors should be looking for in the next big AI infrastructure winner.
Nebius Has More Room Than CoreWeave to Fund Its AI Growth
Both Nebius and CoreWeave are dependent on debt as they build out capacity.
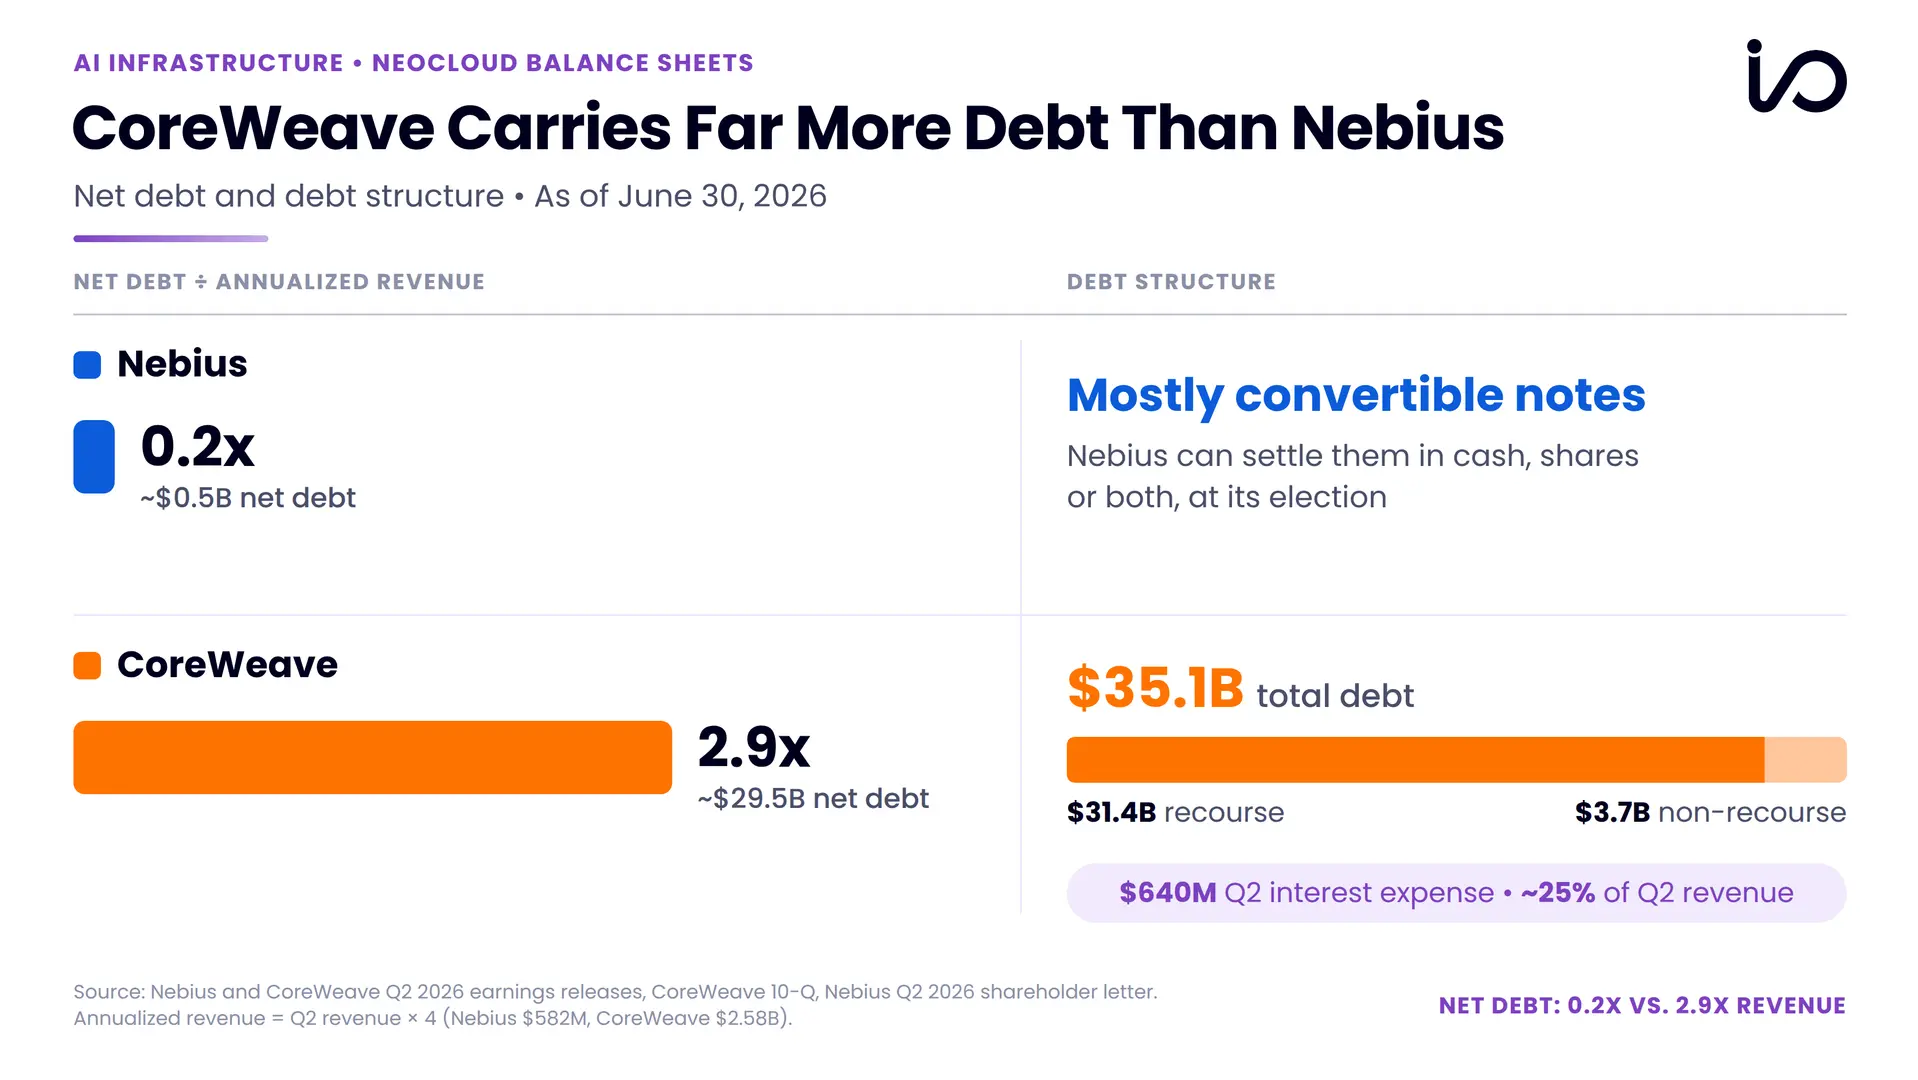
In this race to ramp up, Nebius and CoreWeave have similar gross debt to annualized Q2 revenue, at 3.7x and 3.4x, respectively. Where the difference lies is in how much liquidity each company has to offset this debt, and how each has structured it. With a cash balance of around $8 billion, Nebius has brought its net debt down to 0.2x of annualized revenue, compared to CoreWeave’s 2.9x. Doing so has helped Nebius realize higher flexibility in the race to build out capacity.
Illustrative comparison of Nebius and CoreWeave balance sheet metrics as of June 30, 2026. Nebius is shown with net debt of approximately $0.5 billion and a net debt-to-annualized revenue ratio of 0.2x, alongside mostly convertible notes. CoreWeave is shown with approximately $29.5 billion in net debt, $35.1 billion in total debt, and a net debt-to-annualized revenue ratio of 2.9x.Sources: CoreWeave and Nebius Q2 2026 earnings releases, 10-Q and Nebius Q2 shareholder letter.
Nebius Uses Customer Prepayments to Fund its Buildout
Nebius’ debt at the end of Q2 was almost entirely convertible notes. Its earlier notes convert at roughly $51 to $183 per share, well below the NBIS stock price of about $231 in late September, so Nebius has the option to settle them in shares, at the cost of dilution. Nebius added a further $5.75 billion of convertibles in August, this time converting at $313 to $325, along with a $775 million asset-backed facility in July.
The other driver of Nebius’ cushion is its funding model. Around 70% of the deals Nebius closed in Q2 included customer prepayments, which helped finance 50% to 60% of the associated capex on its largest contracts. They also helped Nebius generate about $2.25 billion of operating cash flow in Q2, nearly four times its quarterly revenue. This dynamic will persist through the rest of the year, with management expecting over $9 billion in prepayments against capex of $20 billion-$25 billion. This operating model makes Nebius less dependent on debt, which matters more than the size of its cash balance.
CoreWeave, on the other hand, invested around $14.9 billion in its expansion in H1 2026 while generating $3.7 billion of operating cash flow, and raised about $14 billion through financing to fund the gap. The cost of that debt is showing up in its results: Q2 interest expense of $640 million was five times its $128 million adjusted operating income.
CoreWeave Has Less Cushion for GPU Pricing to Slip
That leaves CoreWeave with less room if GPU pricing slips, although any pricing hit would have a gradual impact as much of CoreWeave’s revenue is locked into multi-year contracts that reprice only when they renew.
That is why the 2027–2029 renewal pricing cycle matters for CoreWeave. This also impacts Nebius as prepayments fund its capex, but don’t protect its rental rates, and its on-demand pricing can move quickly in either direction. Nebius has more room to absorb a price decline without taking on more debt for financing capex spend.
This is where the useful life of GPUs comes into play. If CoreWeave’s GPUs stay highly utilized and command attractive rental prices for five or six years, mature fleets can help fund newer generations instead of every deployment cycle relying on infusion of fresh capital. If older GPUs lose economic value faster, Nebius’ liquidity gives it more cushion to absorb faster replacement cycles and to invest in newer hardware without leaning on debt.
GET FREE WEEKLY AI STOCK ANALYSIS
Join 40,000+ investors who receive Beth’s analysis of AI stocks, earnings, and the infrastructure trends shaping the next phase of the AI market.
GPU Rental Prices Are Rising, Even for Older H100s
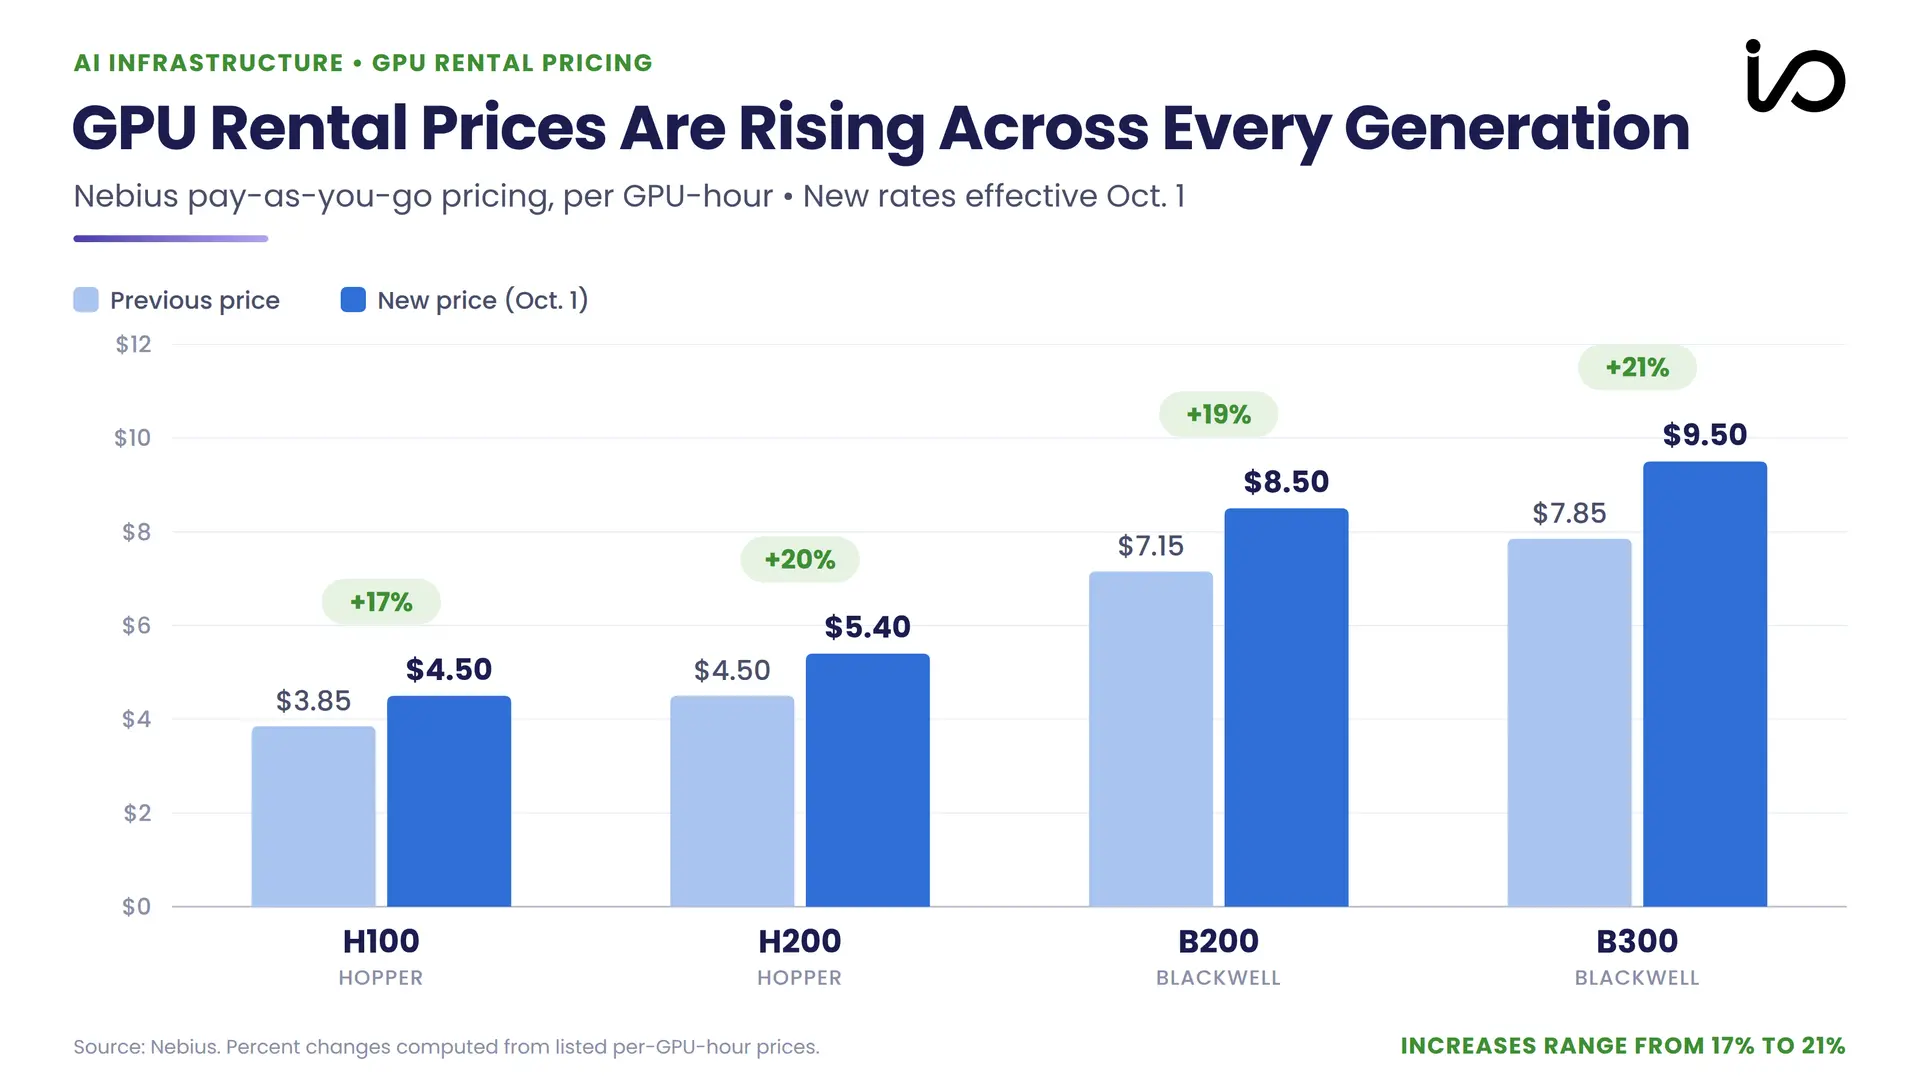
GPU rental prices are rising across the board, and not just for the newer chips. Nebius is raising its H100 on-demand rental price by 17%, from $3.85 to $4.50 per GPU-hour, starting October 1, 2026.
This marks Nebius’ second price increase this year for the H100s, following an average 29% on-demand increase in May. It is also raising on-demand rentals of the H200, B200 and B300 by 20%, 19% and 21%, respectively. Rental prices for Nvidia’s B300 have seen a larger increase, up around 56% from its pre-May level of roughly $6.10 per hour.
Nebius increased pricing across Nvidia H100, H200, B200 and B300 GPU instances by 17% to 21% effective Oct. 1. Rising rental rates across multiple GPU generations suggest AI infrastructure demand remains strong and support the thesis that older GPUs may retain economic value longer than many investors expect.
Get Our Free Weekly Stock Newsletter
Get weekly stock insights, market analysis, and technology updates straight to your inbox.
Weekly stock insights
Market analysis
Technology updates
Nebius is not alone in increasing rental pricing for older GPUs. In September, CoreWeave stated that it is contracting new compute capacity at higher prices, while its Q2 earnings call mentioned a six-year old A100 GPU contract running into 2029. As confirmed by CEO Mike Intrator, pricing for prior-generation products is “at or above where it was years ago.”
This trend is encouraging for neocloud economics. At both companies, GPUs that are four or more years old are commanding higher rentals well beyond the period when they could be considered cutting-edge.
But it doesn’t settle the depreciation debate. Some of the increase may reflect scarcity rather than durable value: the current HBM and DRAM memory bottlenecks and constrained B300 supply can push up the demand on older chips. Despite the reasons behind the current demand for older GPUs, the real test for neocloud economics lies in their renewal pricing during the final years of this decade.
Big Tech Is Extending the Useful Life of AI Servers
The useful life of servers has also been rising in recent years, even as demand for AI infrastructure rises steadily. Alphabet and Microsoft both extended the useful life of their servers to six years, from three to four years. Alphabet’s 2023 extension alone brought down its depreciation expense by $3.9 billion that year. Nebius itself moved to a five-year useful life for its servers and network equipment in 2026, up from four. If an aging GPU can continue to generate attractive revenue without requiring equivalent replacement capex, the original investment can generate more revenue than previously accounted for.
Amazon, however, offers a contrarian take on the issue. In 2025, the company shortened the useful life of a subset of its servers and networking equipment from six to five years, citing faster technological development, especially in AI and machine learning.
2027–2029 Will Test How Long AI GPUs Stay Profitable
Unlike much equipment, the introduction of newer technology does not immediately make older GPUs obsolete. While newer GPUs go on to handle frontier training and the most demanding inference tasks, older GPUs move down the workload stack to handle inference, batch analytics, development and testing, and other tasks that are not as performance dependent.
The economic life of a GPU thus gets extended even if it no longer performs optimally at frontier tasks. Software helps too: Nvidia’s Multi-Instance GPU technology lets a physical accelerator be partitioned into smaller, isolated GPU instances, allowing neoclouds to utilize a higher portion of an older GPU’s capacity. However, software has a limited role in optimizing the performance of an aging fleet. At some point, weaker performance per watt, limited memory and higher operating costs will catch up and make it cheaper to replace a GPU than continuing to run it.
When Will AI GPUs Be Retired?
By 2028, the first H100 fleets will near the six-year mark of their useful life, with the larger fleets deployed during the 2023–24 buildout following close behind. If five to six years is the economic life of older GPUs, we will soon know if these GPUs can remain economically viable, or whether they will need to be sold off and replaced.
The balance sheet risk to watch isn’t as simple as a GPU retiring. If a GPU has already been depreciated over five or six years, much of its carrying value has already passed through the income statement.
Take the case of Amazon. Retiring certain servers and networking equipment early resulted in approximately $920 million of accelerated depreciation and related charges in Q4 2024, separate from its decision to shorten useful life in 2025.
Inference is the major counterforce. If rapidly expanding inference demand can utilize older H100/H200 capacity after newer GPUs take over the highest-performance workloads, years four, five and six can become increasingly valuable monetization years for neoclouds running older GPUs.
Conversely, if newer accelerators or purpose-built inference ASICs make older GPUs uneconomical, their deteriorating value would start showing up in rental pricing, utilization and contract renewals before it becomes evident in the form of depreciation accounting.
Nebius vs. CoreWeave: Which Stock Wins and Why?
The real test for both companies begins when GPU fleets age and reach years 6-7 (approximately in 2028). Rental pricing and utilization will help indicate if these GPUs can remain economically productive 2-3X longer than previous non-AI servers of 2-3 years. This period is also when CoreWeave could see a second wind as its massive infrastructure and buildout could see the mature fleets help offset funding the newer generation of AI GPUs.
For now, Nebius and CoreWeave are defying the typical useful life for servers with Nebius raising prices by 17% on H100 rentals, and CoreWeave has signed an A100 contract into 2029. As it stands, Nebius also has more financial room to replace aging GPUs without leaning heavily on debt.
Therefore, the defining factor for long-term returns may not be which company builds the most AI infrastructure, or who reports the highest revenue growth. It will be determined by which company can generate the highest lifetime return on its GPU investments while requiring the least incremental capital to sustain growth. Today, Nebius has an upper hand, but by years six and seven of the H100 cycle, CoreWeave could see a second wind.
Our portfolio is up over 70% YTD—3X the Nasdaq-100—and we are crushing popular tech ETFs both on a YTD basis and cumulative basis.
The I/O Fund is the premier research site when it comes to finding AI winners early and often.Subscribe now to access our high-performing portfolio, including lesser-known AI names, plus real-time trade alerts on every entry and exit.
Please note: The I/O Fund conducts research and draws conclusions for the company’s portfolio. We then share that information with our readers and offer real-time trade notifications. This is not a guarantee of a stock’s performance and it is not financial advice. Please consult your personal financial advisor before buying any stock in the companies mentioned in this analysis. Beth Kindig and the I/O Fund own shares in NVDA at the time of writing and may own stocks pictured in the charts.
Aiswarya Gopan, AI and Semiconductor Investment Writer at I/O Fund, contributed to this analysis.