

Despite how it may seem, modern-day narratives rarely drive market swings. Tariffs, political headlines, niche trends like rare earth materials, or speculation about which company OpenAI partners with next — these stories dominate the news cycle, but they do not reliably move markets, as the consensus believes. If they did, investing would be much easier.
Numerous well-known studies have come to this conclusion. One of the most famous is “What Moves Stock Prices?” by Harvard and MIT economists Cutler, Poterba, and Summers. Their goal was to model how news and macroeconomic events might predict stock market movements. To their surprise, they found that only about one-third of major price swings could be linked to identifiable news events.
This finding was later reinforced by Yale economist Ray Fair in his groundbreaking paper, “Events That Shook the Market.” Fair examined major one-day movements in the S&P 500 from 1950 to 1999 in search of their causes. He concluded that neither news, earnings, nor data releases could explain most of these large jumps. As Fair put it, “It is difficult to find any news that corresponds to many of the largest daily changes in stock prices.”
We’ve seen this phenomenon play out in real time. The COVID crash was perhaps the most striking example. Economic data went off the charts: 26 million Americans filed for unemployment within five weeks, as GDP fell 31.4% annualized — the steepest drop since World War II. Yet the stock market bottomed at the height of this deterioration and uncertainty, staging a V-shaped recovery that was impossible to justify by the data alone.
There are many forces that shape markets — liquidity, growth, and monetary and fiscal policy among them. But there are also powerful, less tangible forces that economics struggle to explain. One of these is herd sentiment, which we explored in last week’s report, Decoding the S&P 500: When Human Sentiment Meets Artificial Intelligence.
This week, we’ll turn to another underappreciated but potent influence on markets – cycles. Much like natural phenomena, financial markets move in rhythmic, repetitive patterns that can be observed, analyzed, and applied to better understand broader trends.
Understanding market cycles is essential for anyone seeking to interpret market behavior beyond the noise of daily headlines. While news and data provide short-term context, the deeper rhythm of expansion, contraction, and renewal has repeated throughout centuries of market history. These cycles reflect the underlying forces of liquidity, sentiment, credit, and innovation that collectively drive long-term trends. By studying them, investors can gain perspective — identifying where we may be in the broader sequence of optimism and fear — and making decisions grounded in historical precedent rather than emotion.
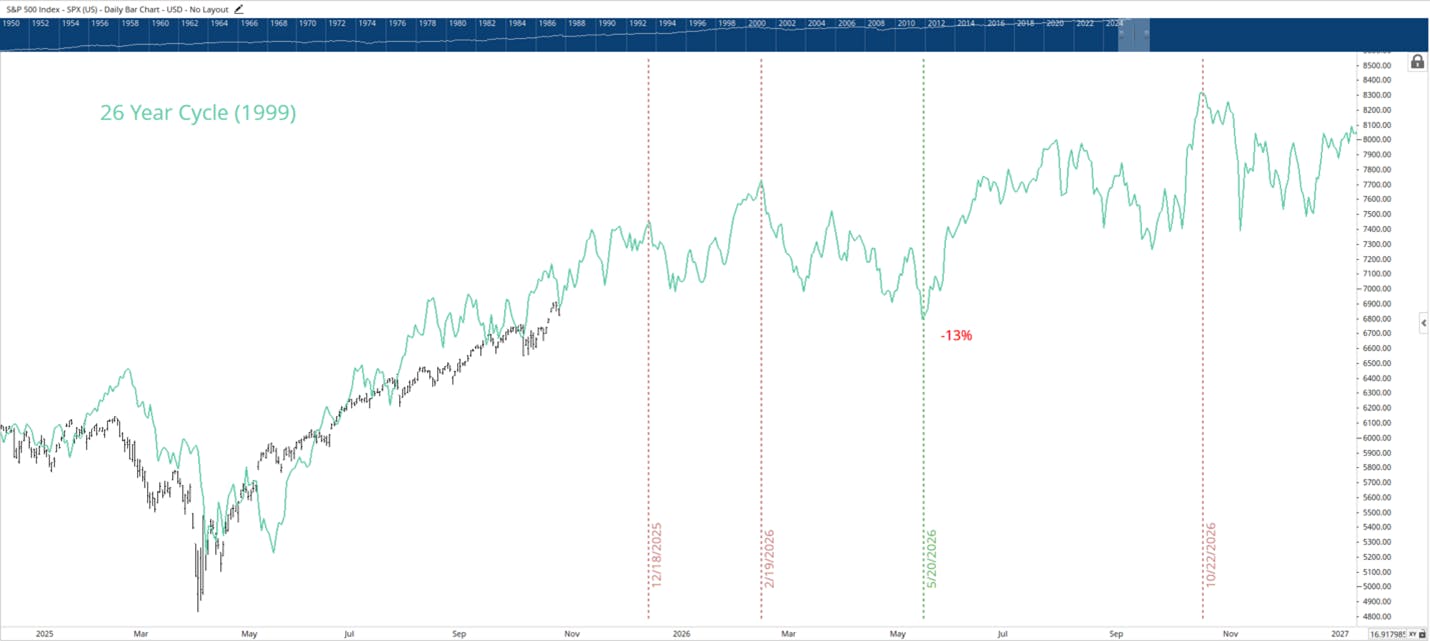
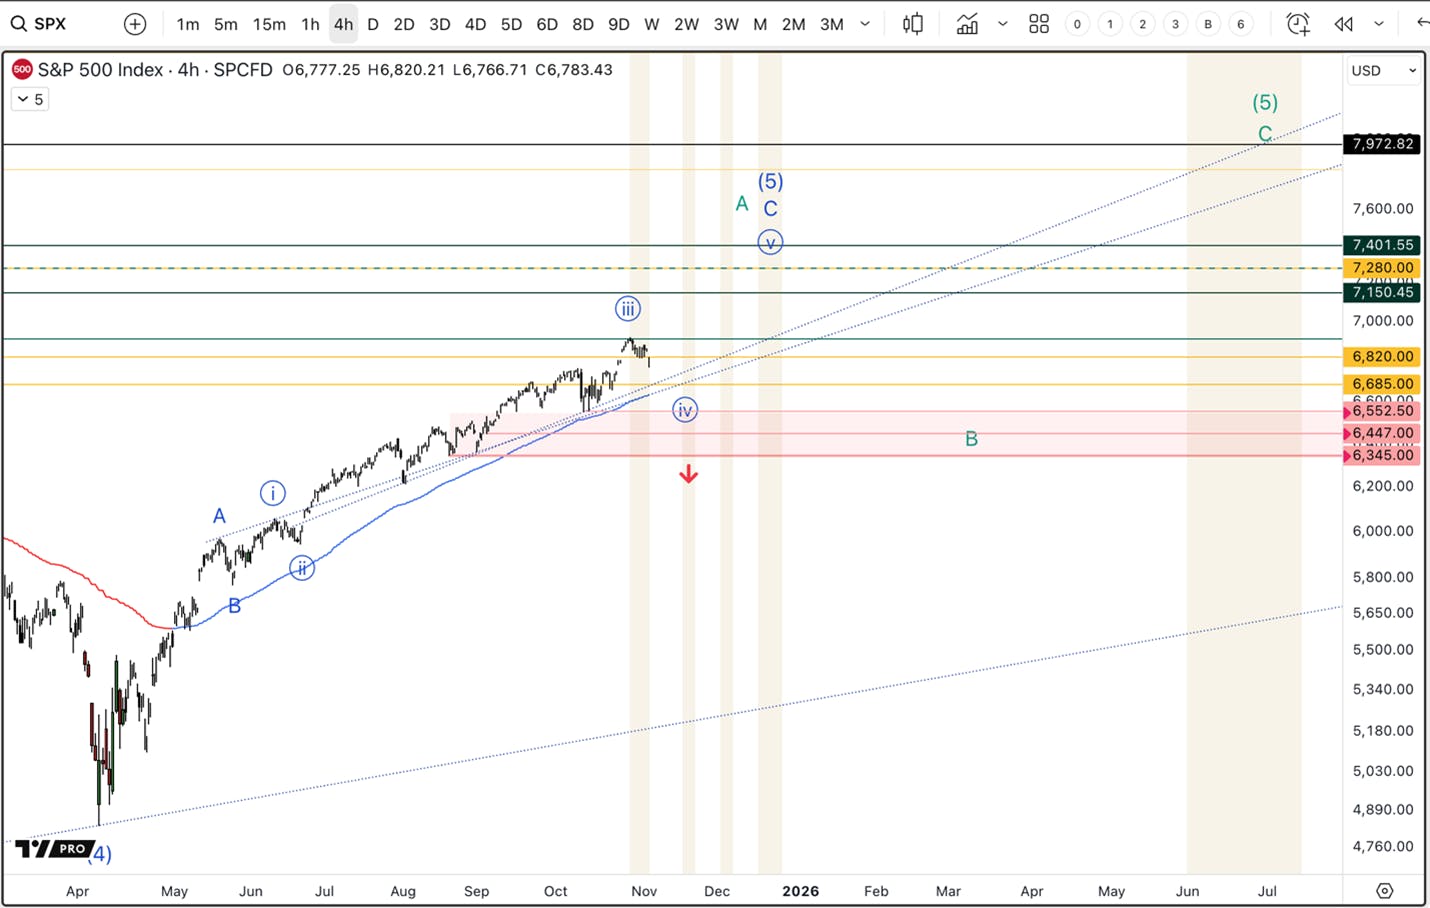
In this report, we will look at two dominant cycles that closely align with the price action in 2025. Both suggest a potential year-end rally, followed by the potential for volatility into Q1 of 2026. We’ll then line these cycles up with the broad market to outline what levels must hold, and what targets this uptrend is hitting, as we push higher.
The Gann Cycle Framework: Predictable Rhythms Behind Market Movements
The concept of market cycles gained mainstream attention through Neil Howe and William Strauss’s theory The Fourth Turning, which proposes that history unfolds in recurring 80–100-year cycles based on generational shifts. Each “turning” reflects a distinct societal mood—ranging from confidence and expansion to crisis and renewal—that repeatedly shapes political, economic, and market behavior.
However, the study of cycles long predates Howe and Strauss. In 1862, economist Karl Juglar identified what became known as the Juglar Cycle—an 8 to 11-year rhythm of expansion and contraction that still appears in modern market data. Juglar’s work established the foundation for viewing markets not as random systems, but as recurring patterns driven by predictable phases of human and economic behavior.
Decades later, W.D. Gann advanced this concept into one of the most comprehensive frameworks for understanding market structure. Gann demonstrated through decades of analysis that market movements often unfold in rhythmic, repeating patterns tied to both human psychology and natural law. His research suggested that the same behavioral and structural forces that shaped past bull and bear markets continue to influence markets today.
Gann identified several “master cycles”—notably the 100-year, 90-year, 60-year, 52-year, 45-year, and 30-year cycles. At any given time, one or more of these cycles, as well as divisions of these cycles, tend to influence the prevailing market trend. He used these relationships to issue remarkably accurate forecasts, many of which have held up over time.
While this may sound abstract, it holds historical merit. For example, 90 years back from the 1929 market top takes us to the end of the 1839 speculative boom, which ended in the Panic of 1839. Counting 90 years forward from 1929 brings us within months of the COVID top in 2020—an equally significant inflection point.
Another example is Gann’s 60-year “Great Cycle.” When we overlay the S&P 500 from 1962 onto today’s market starting in January 2022, the patterns align with remarkable similarity. While cycles can invert or distort temporarily, they consistently identify key inflection points and general directional bias.
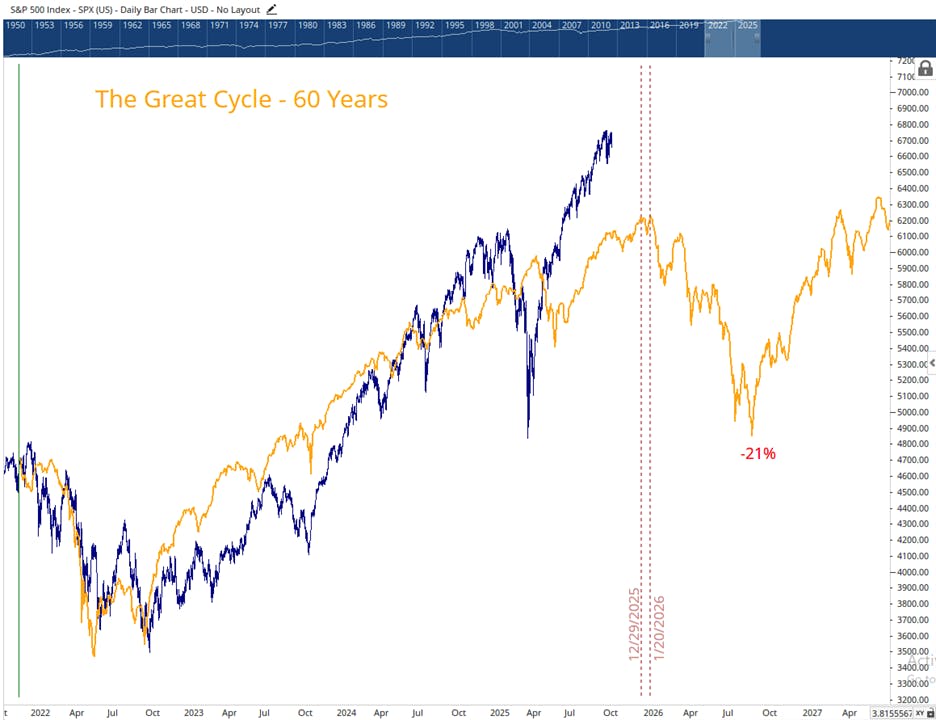
Because sentiment moves in waves, the emotional extremes of fear and greed remain timeless. While technology, policy, and liquidity conditions evolve, the human response to opportunity and risk does not. Even if equities rise in 2025 on optimism surrounding AI, investor psychology mirrors that of prior generations—driven by the same patterns of exuberance and denial.
To see how these long-term cycles manifest in real markets, let’s look at two historical periods that mirror 2025 with uncanny precision.
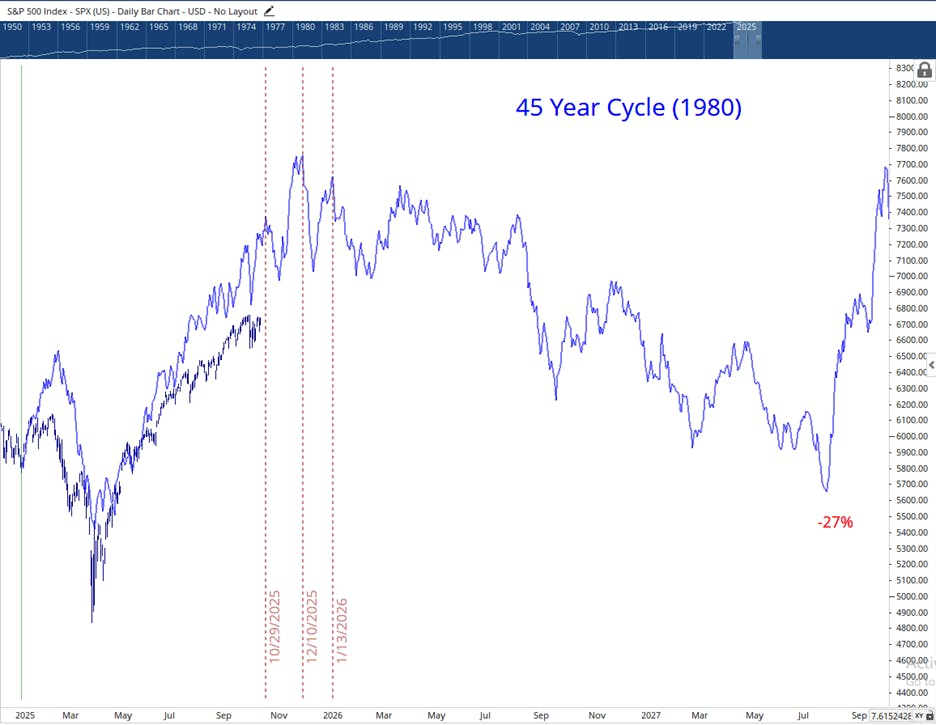
With this in mind, we examined historical precedents for 2025—a year defined by a rapid 20% decline in Q1 that erased nearly all of 2024’s gains, followed by a strong seven-month rally with limited pullbacks. These conditions—a liquidity shock followed by a sharp rebound—are rare. Over two centuries of data, only two market periods fit this mold: 1980 and 1998. Interestingly, both align with significant Gann cycles—the 45-year (half of the 90-year) and the 26-year (half of the 52-year) cycles.
To summarize: History may not repeat — but it often rhymes.
The 45-Year Market Cycle: How 1980’s Policy Shock Is Repeating in 2025
The market in 1980 has a striking resemblance to what we’ve seen unfold in 2025. In both periods, a swift and unexpected policy shock triggered a sudden liquidity event that sent markets sharply lower, followed by a rapid V-shaped recovery that defied expectations.
In early 1980, the Federal Reserve—newly under the leadership of Paul Volcker—launched an aggressive campaign to control inflation. The Fed pushed interest rates to nearly 17% in February, an unprecedented move that instantly drained liquidity from the system and sent equity markets into a sharp correction.
Similarly, in early 2025, the executive branch imposed an unexpected increase in tariffs, creating a sudden liquidity squeeze that rippled across U.S. markets. The February decline that followed erased much of the prior year’s gains in a matter of weeks.