The Greatest Bull Market in Decades is About to Begin – But a Correction Comes First
Knox Ridley·OCT 11, 2026·12 min read
On this page
For investors who think they’ve missed out on AI, the best is yet to come. But first, there will be a notable correction.
Since March 2009, the S&P 500 has experienced five declines of roughly 20% or more. Most were followed by relatively quick recoveries, reinforcing the belief that “buying the dip” is a reliable long-term strategy. However, these declines occurred within a broader secular bull market, which is an important distinction.
Understanding the secular trend often matters more than stock picking, as even the very best stocks can see extended periods of volatility if the secular trend reverses. In this report, we compare the current bull market to secular trends going back over 150 years to show why it is an extreme outlier.
Precisely because this market is an extreme outlier, how investors position themselves over the next few years will be crucial, particularly in AI stocks. My firm, the I/O Fund, specializes in AI, and while past performance is not a guarantee of future results, our track record in AI stocks has been exceptional.
Below, we do what very few investors dare to do, which is share our game plan and explain why we believe this bull market has considerably more room to run. However, before the next leg higher begins, we expect a correction that will shake many investors out of the trade.
The Current Bull Market Is 17 Years Old. History Says That’s Rare
The current bull market has lasted 17 years, and history proves this is very rare. Typically, long secular bull markets are broken up by periods of consolidation; but for more than a decade, that has not been the case.
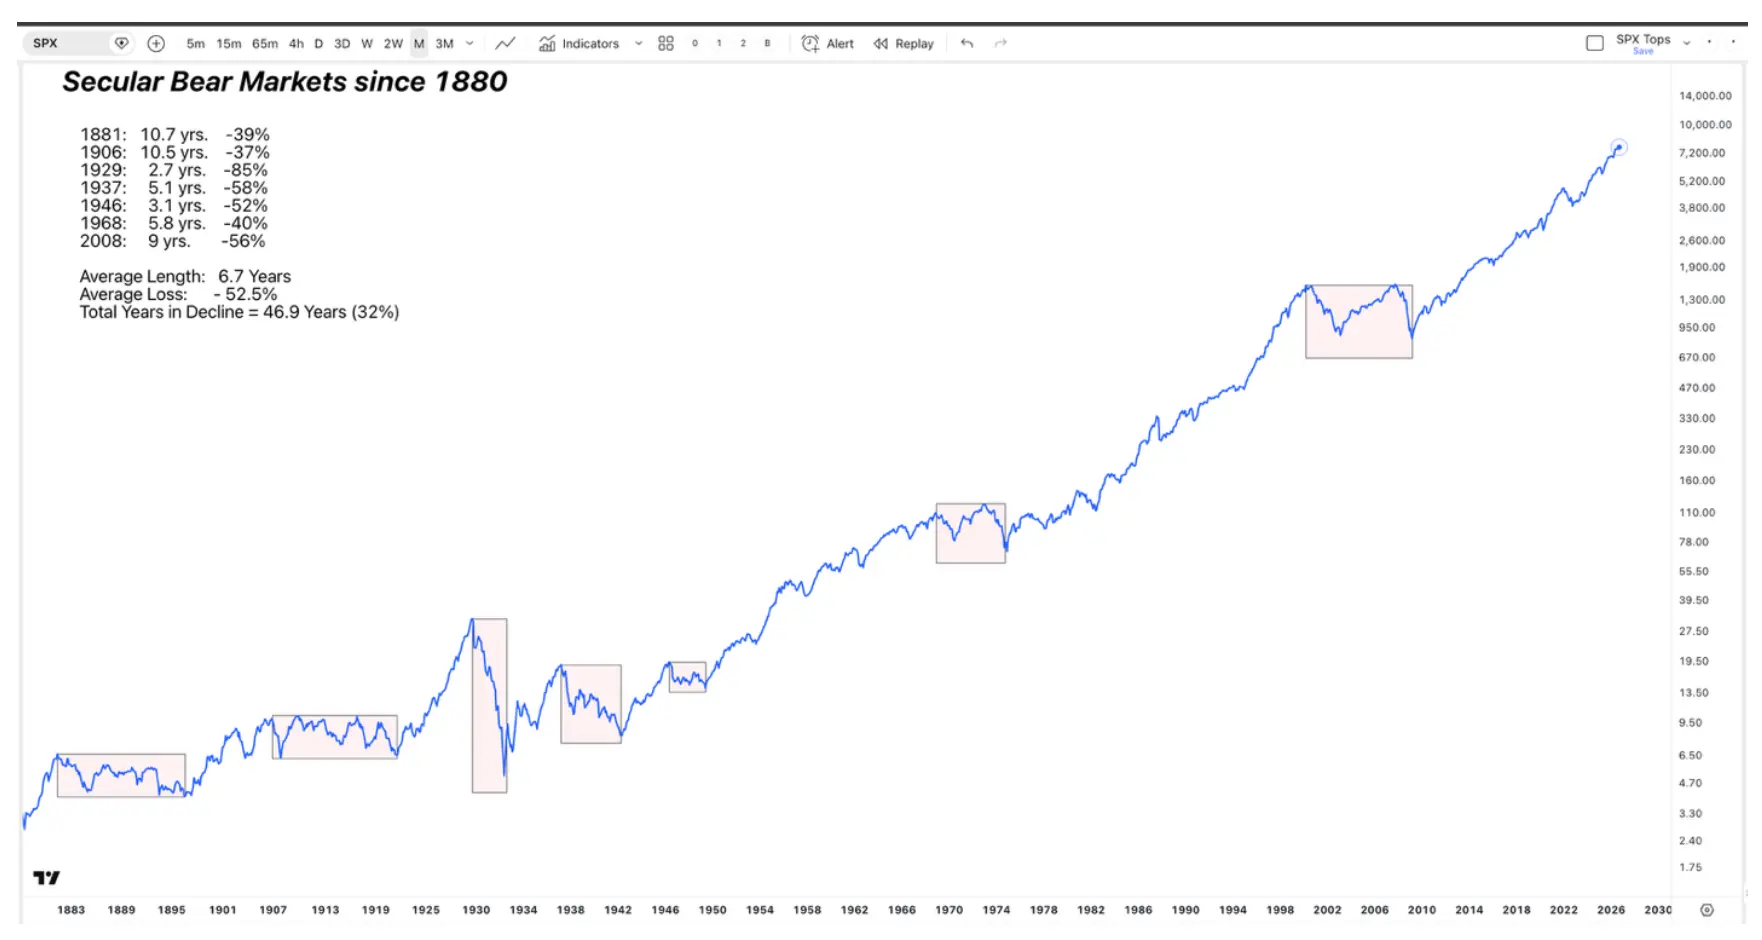
The data shows that going back as far as 1880, there have been seven secular bear markets. They lasted, on average, 6.7 years with an average drawdown of 52.7%.
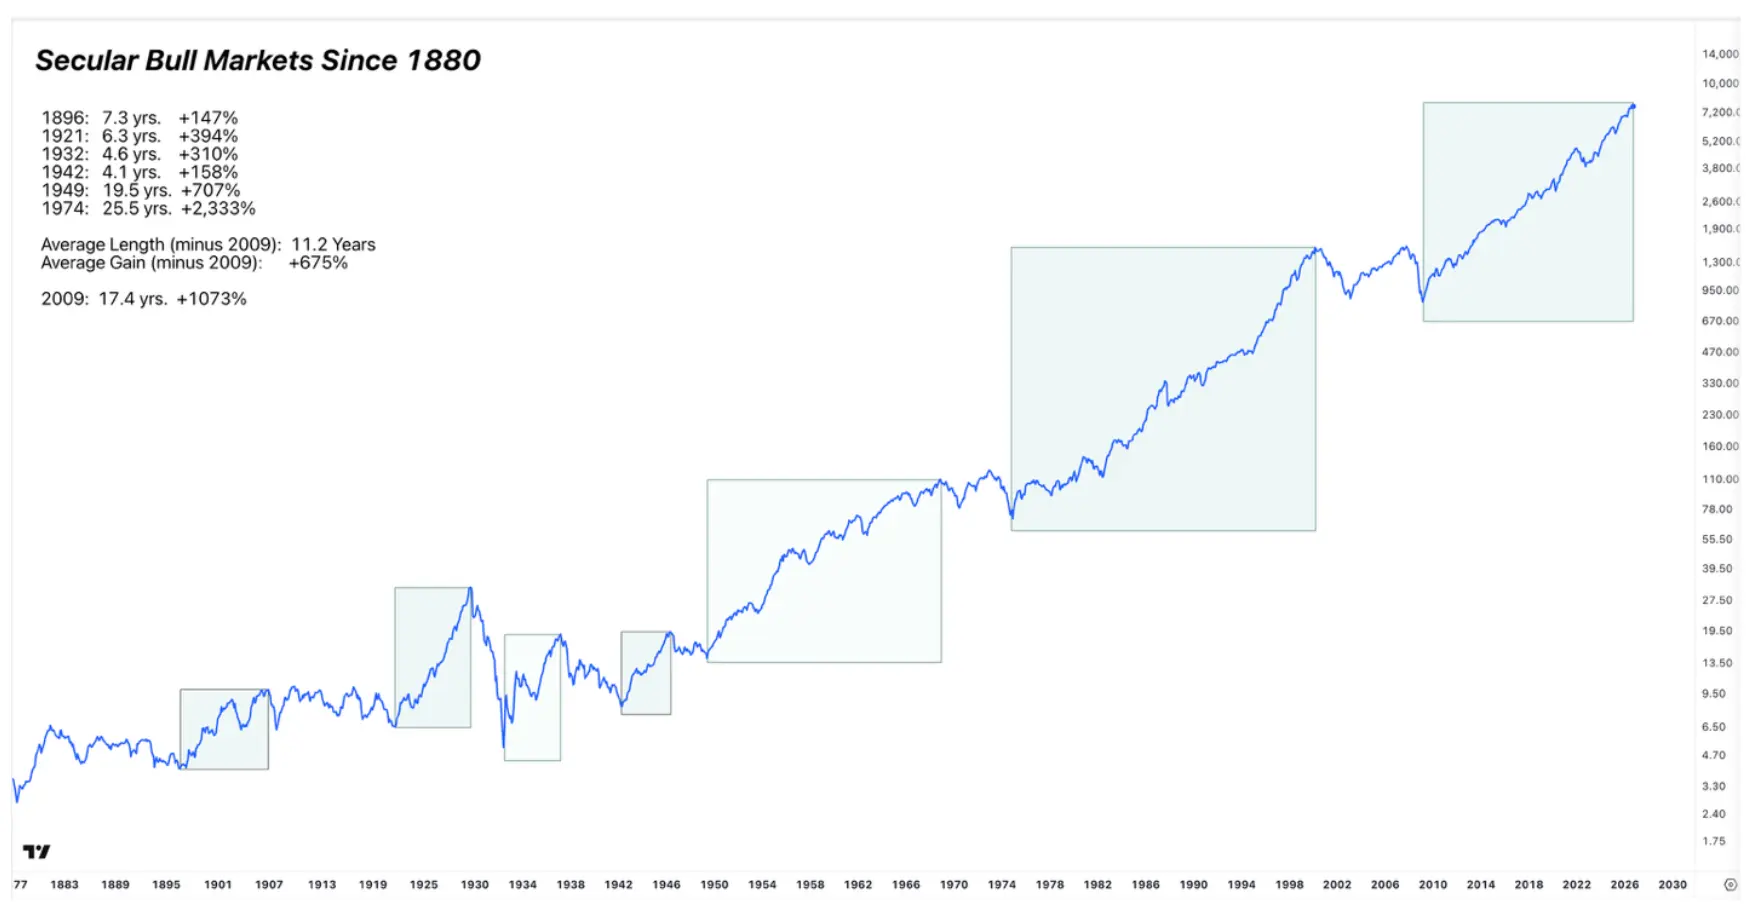
Since 1880, secular bull markets have lasted an average of 11.2 years and delivered average gains of 675%, while secular bear markets have averaged 6.7 years with declines of 52.5%. The current bull market is significantly longer and stronger than historical norms.
By comparison, since 1880, the average secular bull market lasts 11.2 years, with an average gain of 675%.
Since 1880, secular bull markets have delivered average gains of 675% over 11.2 years. The current bull market, which began in 2009, has lasted 17.4 years and gained 1,073%, making it an outlier in both duration and performance.
The Current Bull Market is an Extreme Outlier
Compare this to the current bull market, going for 17.4 years old and up 1,073%, as of September 2026. On both measures it is becoming an extreme outlier compared to the average. That alone calls for caution, because it suggests we are closer to the end of this secular trend than the beginning. However, late in the cycle doesn’t mean over, and the wave structure outlined below shows why.
S&P 500 Ending Diagonal: Two Paths to 9,000–10,000
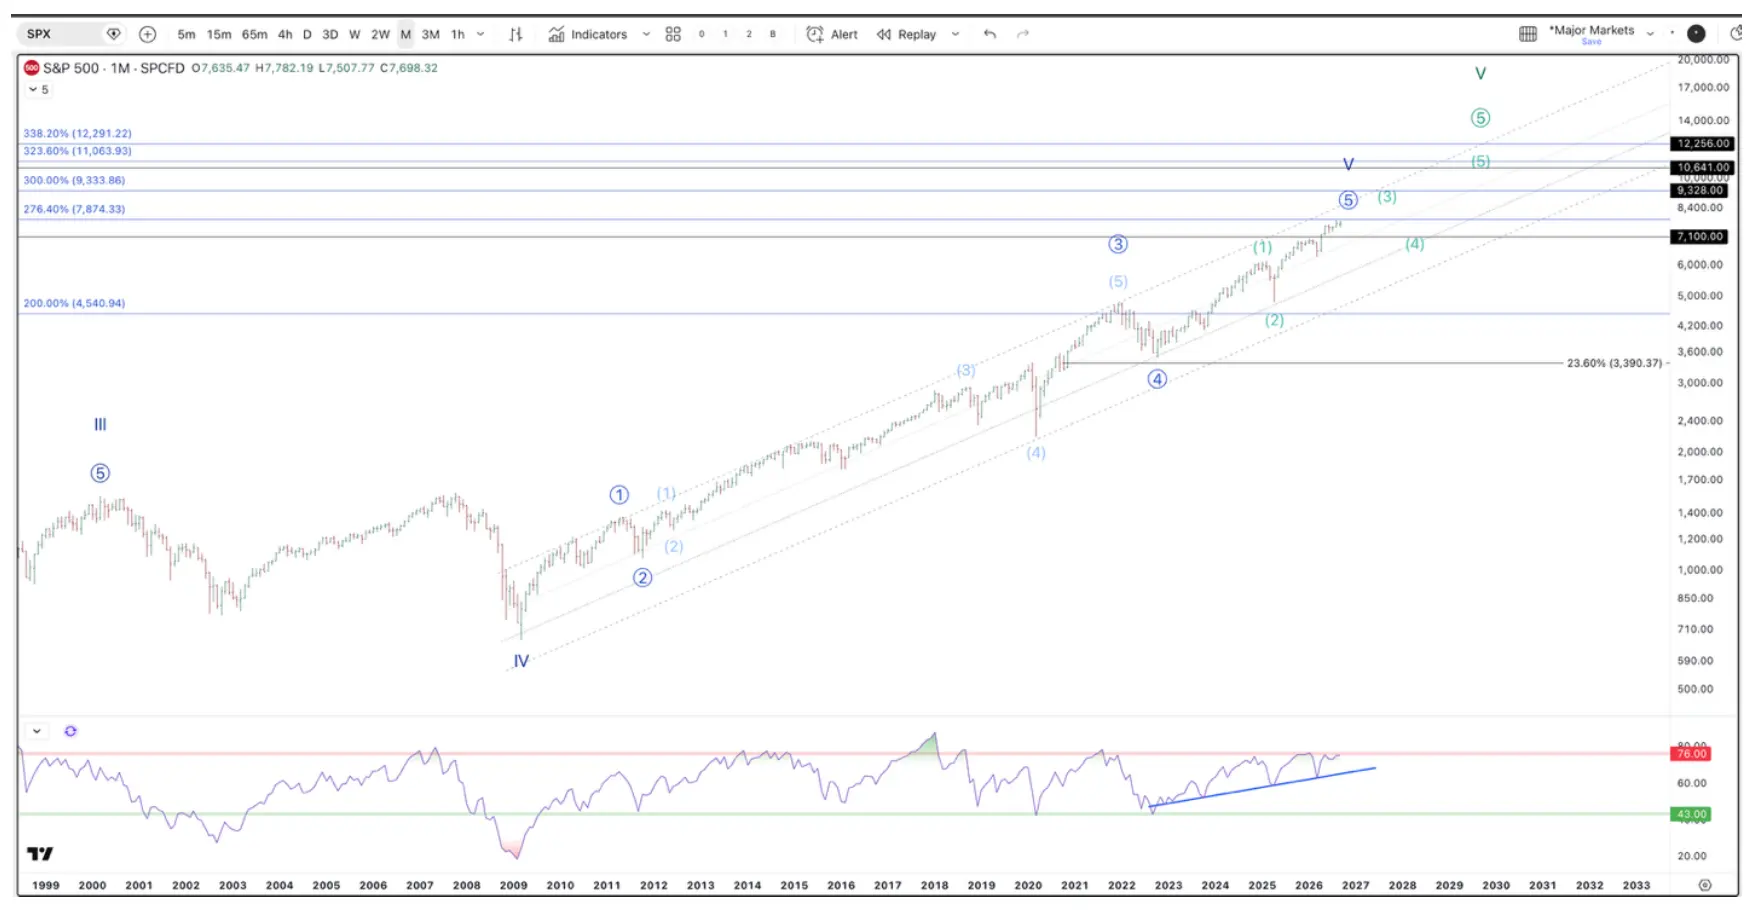
The Elliott Wave pattern of the current secular advance supports this view. Since the 2009 low, the market has been tracing a standard five-wave pattern, which follows the same guidelines on all time frames.
The S&P 500 appears to be tracing an ending diagonal pattern within its secular bull market. Under the primary bullish scenario, the index could continue higher toward 9,000-10,000 before the larger cycle is complete, though significant volatility and corrections may occur along the way.
Below are some data points to support this claim:
Wave 3 of 3: The 3rd wave is the most exciting phase of a bull market, and everyone realizes what is happening all at once – you will see shorts hurry to cover while long-term investors pile in. This makes for a near vertical price jump that is met with maximum momentum. Momentum peaked into the 2018 top, marking this wave 3 of 3, while every new high in price since has come with lower momentum.
Wave 4: The 2022 bear market was a fourth wave. It reached the upper end of the typical fourth-wave target range confirming this.
Wave 5: Since the 2022 low, price action has been overlapping and messy. It best resembles an ending diagonal, which follows from the extended 3rd wave, and is a very common pattern for fifth waves.
Regarding the last point just made, an ending diagonal is a common pattern in Elliott Wave analysis, and the most likely interpretation of where we are in the larger secular pattern that started in 2009. These patterns only show up at the beginning and end of a trend, and they have distinct characteristics: they are 5 wave patterns, have exceptional overlap, and tend to trace a trend channel.
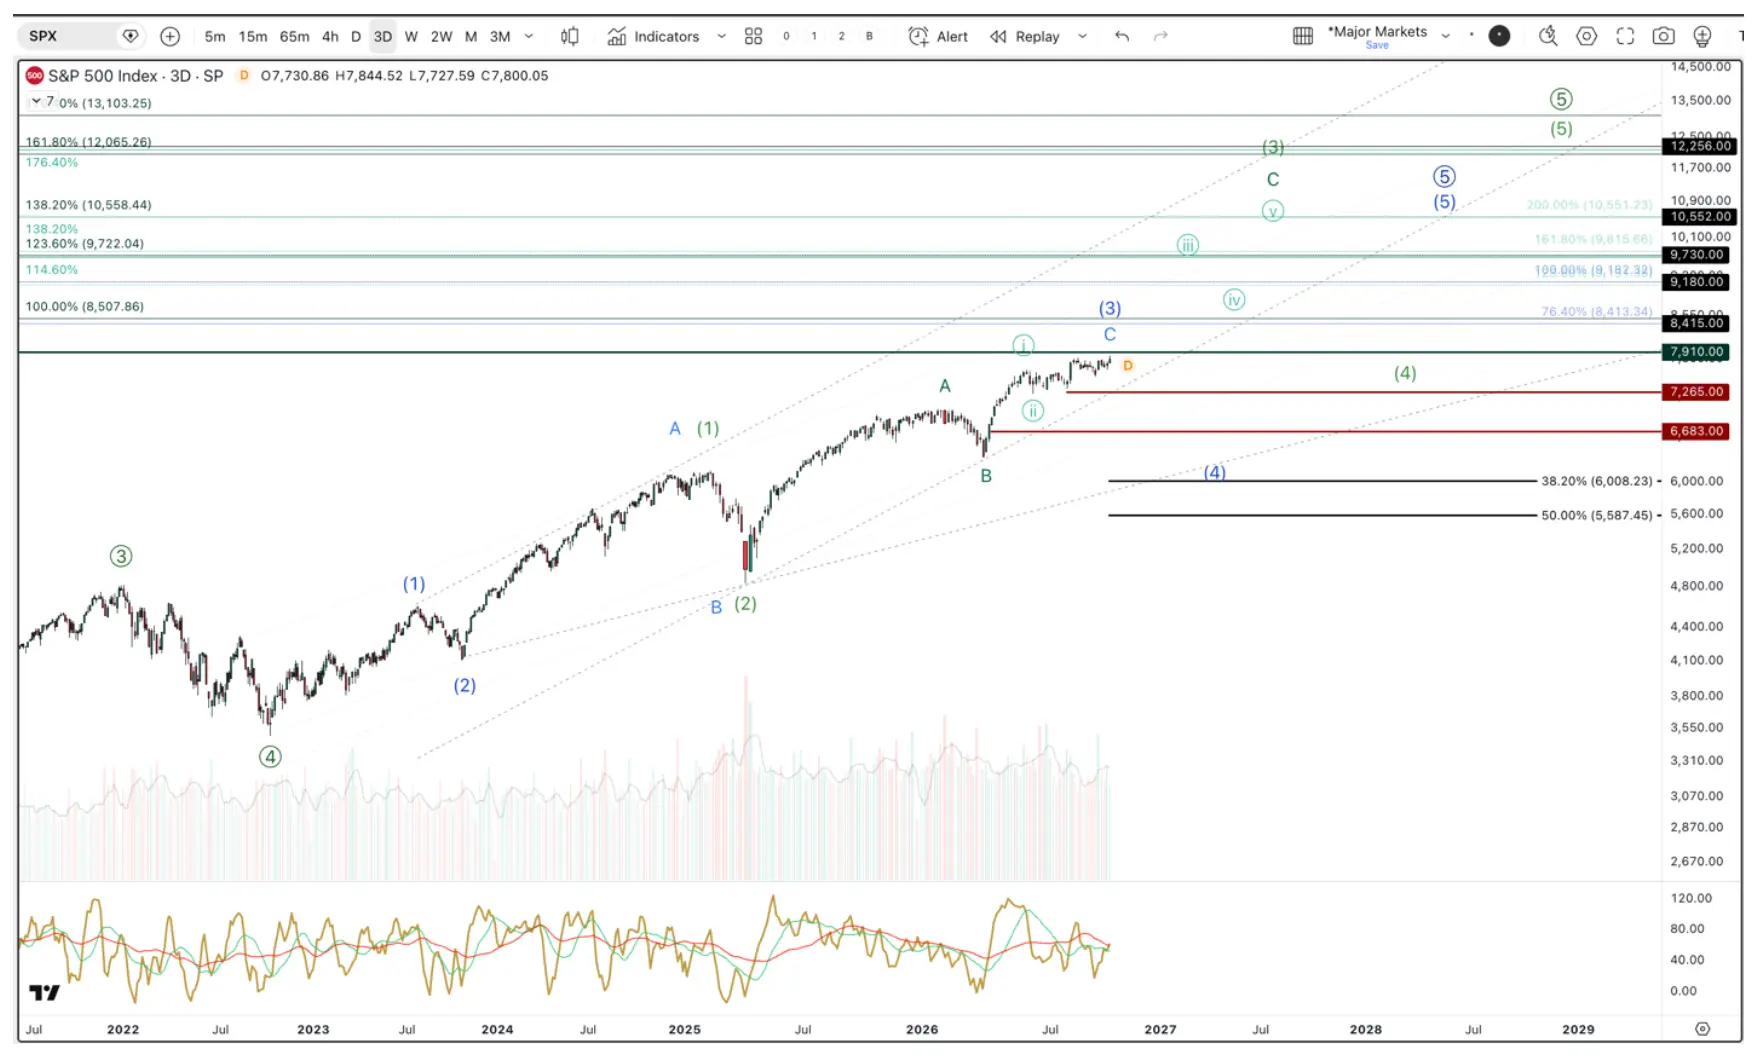
With those features in mind, I am tracking two scenarios that best fit the current price action.
The S&P 500 appears to be tracing an ending diagonal pattern within a larger secular uptrend. Both the primary and alternative scenarios ultimately target the 9,000-10,000 range, though each path includes the potential for significant corrections before the next leg higher.
Primary: This count is tracking an extended ending diagonal. We don’t need to see weaknesses here. However, if volatility does show up, support should ideally hold at 7,265, though it could extend as low as 6,683. From there, a strong breakout toward 9,000–10,000 SPX would complete wave 3 of the diagonal.
Blue: This count tracks an early wave 3 within the diagonal. Wave 3 of the diagonal finishes early, and a cyclical bear market begins soon. A final fifth wave then pushes toward 9,000–10,000 into late 2027 or early 2028.
The bigger takeaways from this analysis are twofold:
The pattern we are tracing appears to be incomplete, which suggests the bull market should continue for several months to years.
The nature of the pattern lends itself to sharp moves in both directions. So, while the larger pattern should trend higher, it will continue to be punctuated by deep corrections along the way.
AI Stock Charts Signal Years of Upside Across the AI Stack
The above count aligns with what we’ve been seeing across AI stocks over the past year. Many of our positions are showing technical setups that point to longer, secular uptrends, with the potential for years of upside despite periods of volatility. Below, we examine Memory stocks – one of the hottest trends in AI to see whether the charts support a continued uptrend.
Memory Stocks
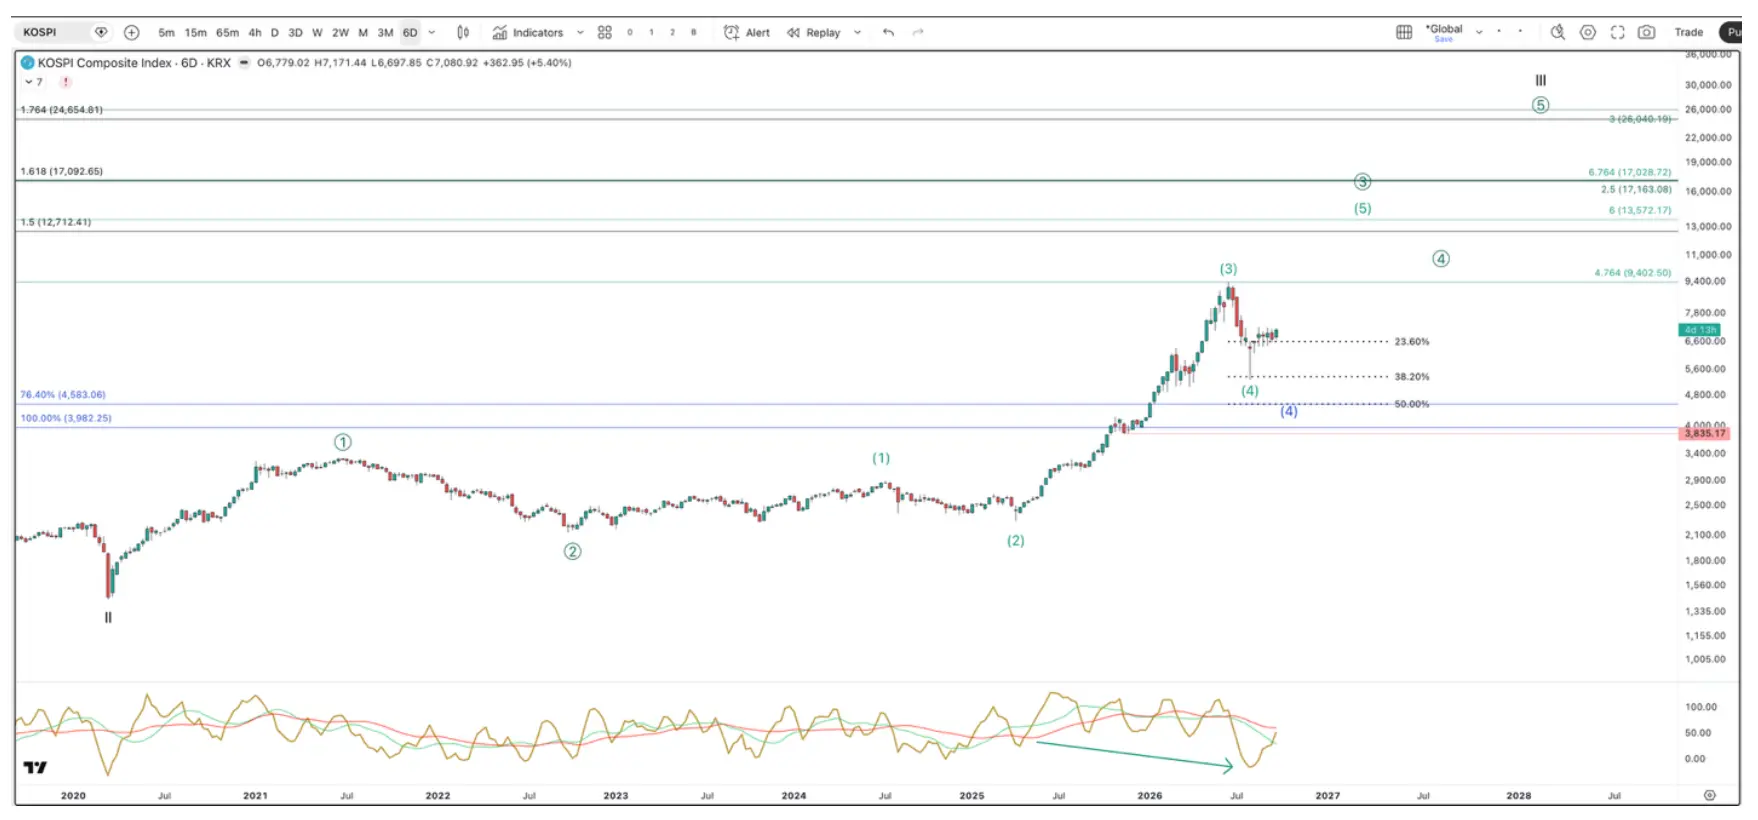
The South Korean KOSPI, an index consisting of 942 stocks, just dropped 44% in less than one month. This is a remarkable move for a developed country’s broad market, and there were several dynamics that created an environment for this unprecedented drop, one of which is that 54% of the total allocation of the index was Samsung and SK Hynix.
Even with the extraordinary volatility that we saw in the South Korean markets, the uptrend in this economy appears to be incomplete. As one of the primary beneficiaries to the memory boom needed to scale AI, this makes sense from a narrative perspective, as there is no evidence the need for memory is over, especially as we move into the inference phase of AI.
Despite a recent 44% correction, the KOSPI appears to remain within a larger secular uptrend. The current decline is consistent with a fourth-wave pullback, with support between 4,583 and 3,982 and the potential for another leg higher if those levels hold.
Get Our Free Weekly Stock Newsletter
Get weekly stock insights, market analysis, and technology updates straight to your inbox.
Weekly stock insights
Market analysis
Technology updates
The KOSPI hit the lower target where we typically see 4th waves end. If this level breaks, we can still be in an extended 4th wave decline which has ample room to drop and still maintain the integrity of the larger secular uptrend.
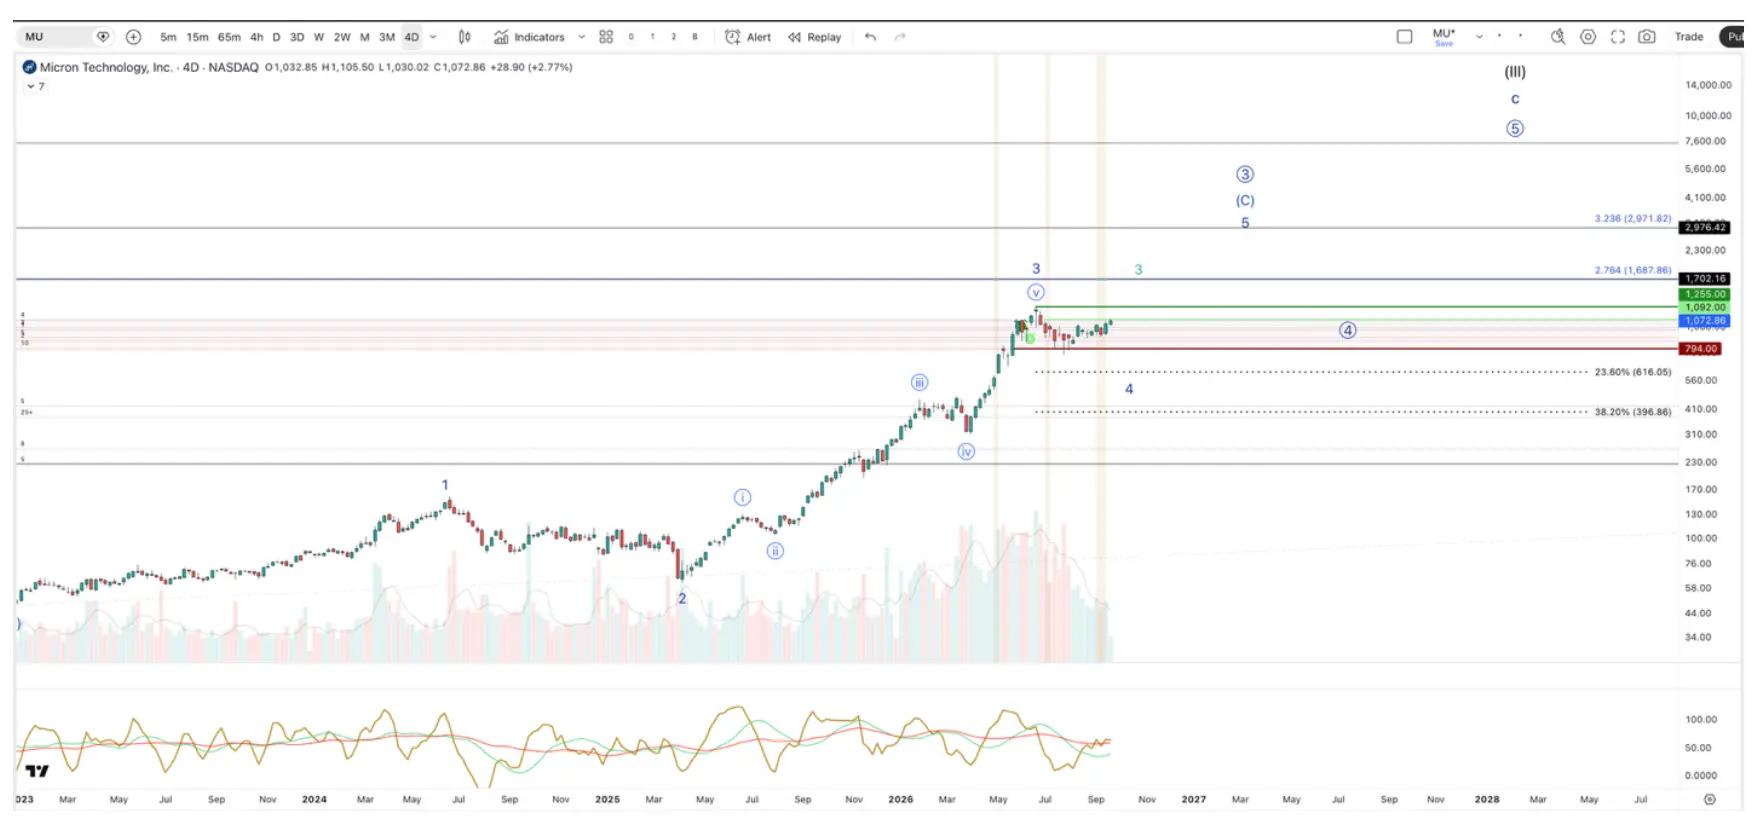
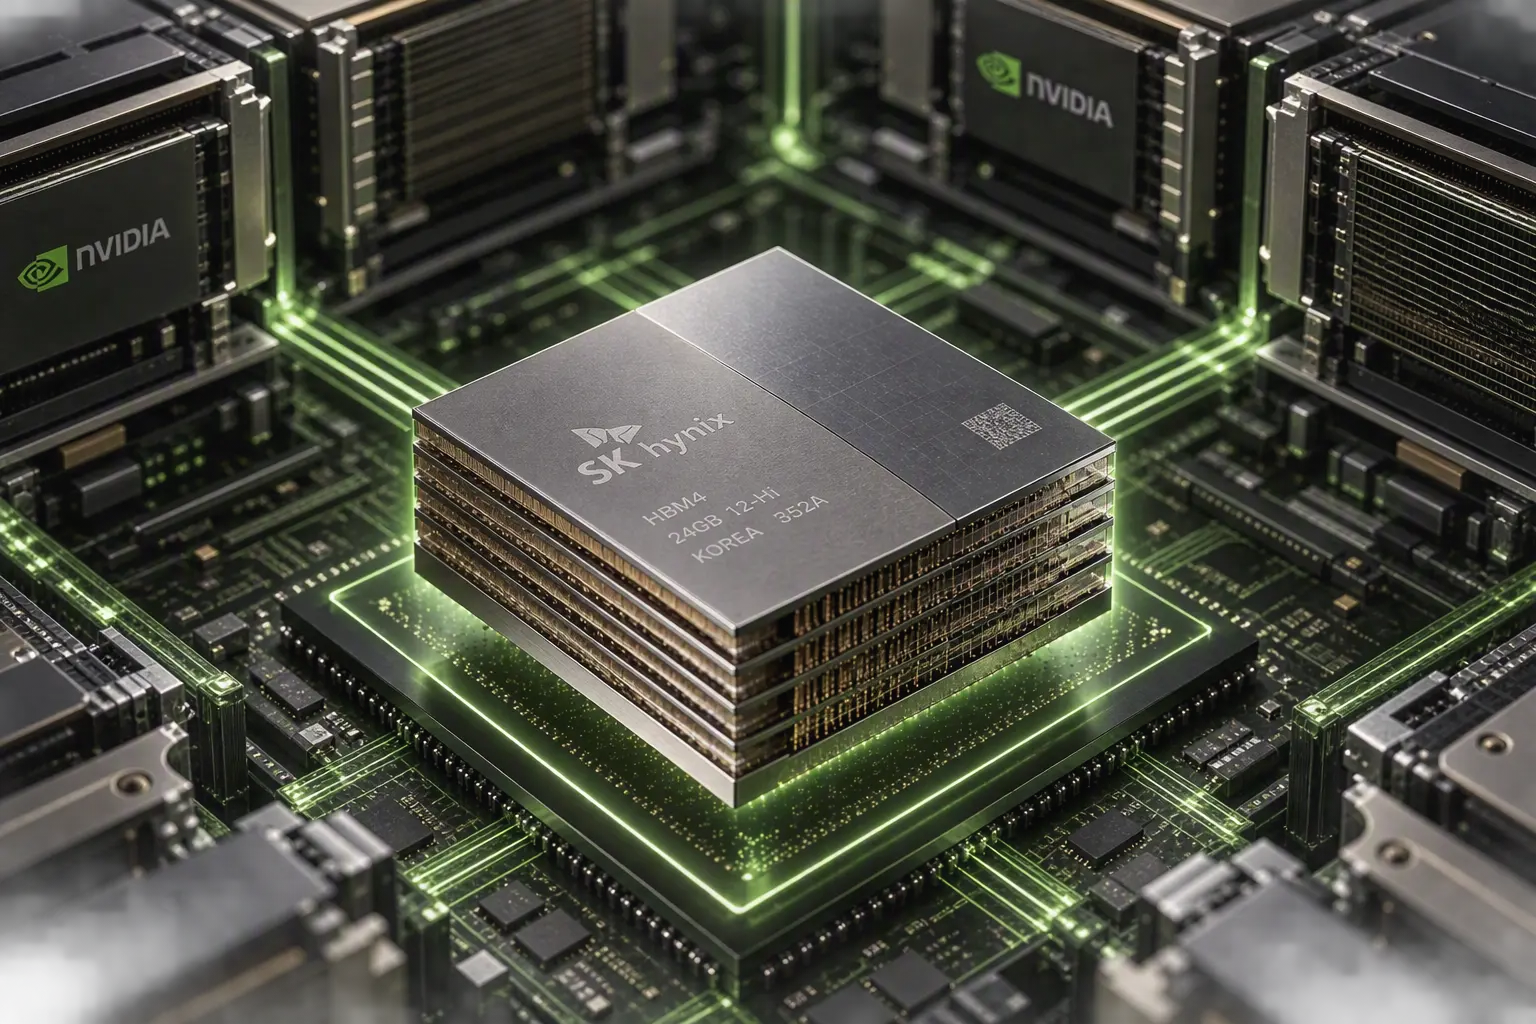
Micron is in direct, aggressive competition with Samsung and SK Hynix for HBM orders. Interestingly, it’s long-term chart resembles the South Korean Kospi, almost identically.
Micron appears to be consolidating above key support near $794 after a strong advance. The bullish wave count points to upside targets around $1,092, $1,255, and potentially $1,703, supporting the view that the AI memory cycle remains intact despite near-term volatility.
We cover AI setups in detail during our weekly webinars, including the key levels we’re watching and how we’re positioning the portfolio. Join the I/O Fund’s next webinar at 4:30 p.m. Eastern on Thursday to see what the charts are signaling for AI stocks.Join I/O Fund
AI Networking Stocks
This is an area of the AI stack that we are heavily overweight – just over 50% of our portfolio is tilted toward lesser-known names that are directly involved in solving the networking bottleneck in AI.
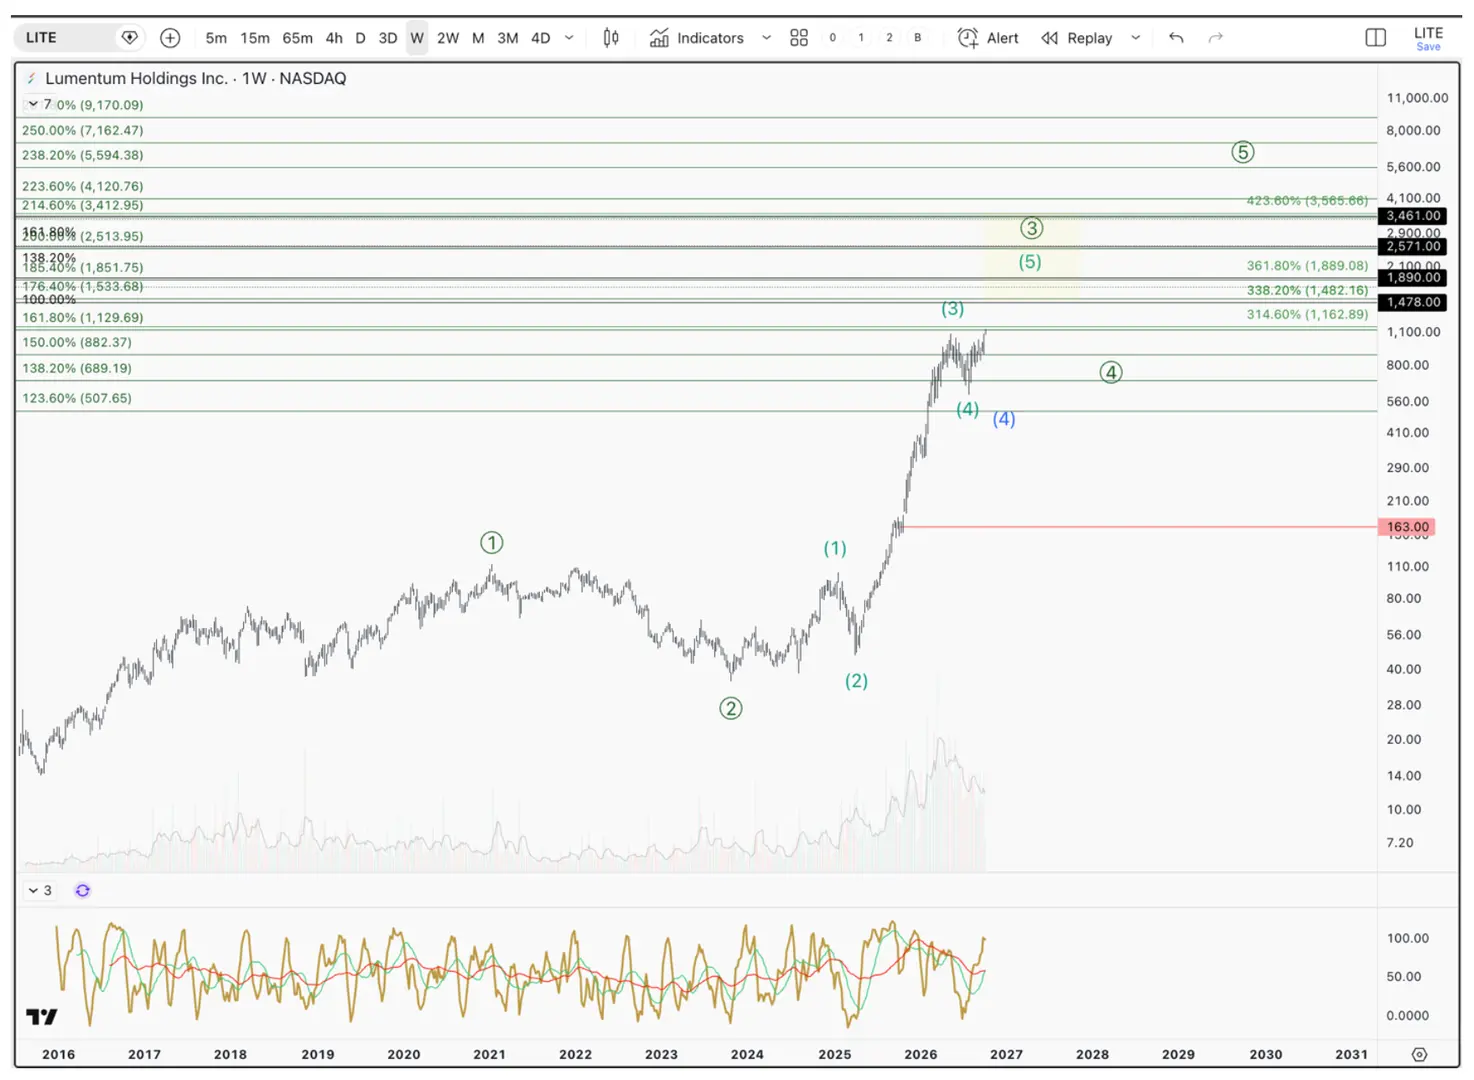
One name that we have been vocal about, which is up over 188% YTD as one of our top 3 positions, is Lumentum (LITE). Like memory, LITE, which sits in the middle of the networking stack, appears to have several large swings in its future.
Lumentum appears to be consolidating after a sharp advance, with the bullish wave count remaining intact above support near $163. The analysis highlights potential upside targets around $1,129, $1,478, $1,890, $2,571, and $3,461 if the longer-term AI networking trend continues.
AI Energy
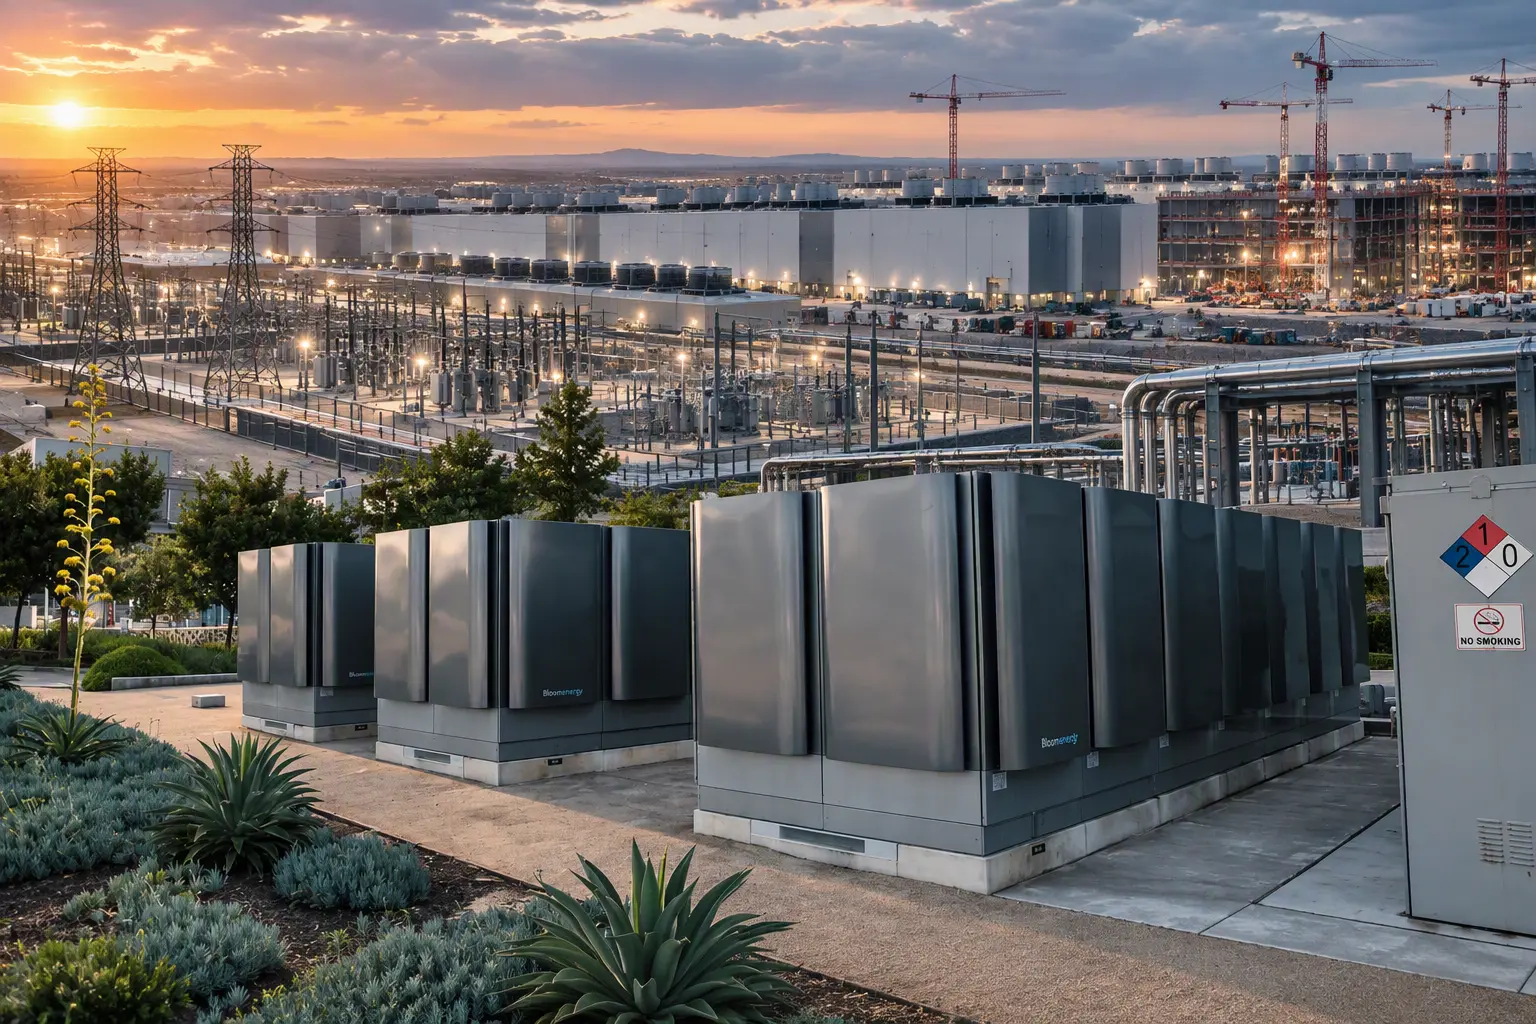
Our firm was one of the first to address the AI energy bottleneck in 2024. As a result, the I/O Fund used a portion of the cash we raised in early 2025 to buy Bloom Energy (BE) on the April 2025 lows. This caused our firm to establish a 5% allocation at $16.88 that is currently up over 1600%.
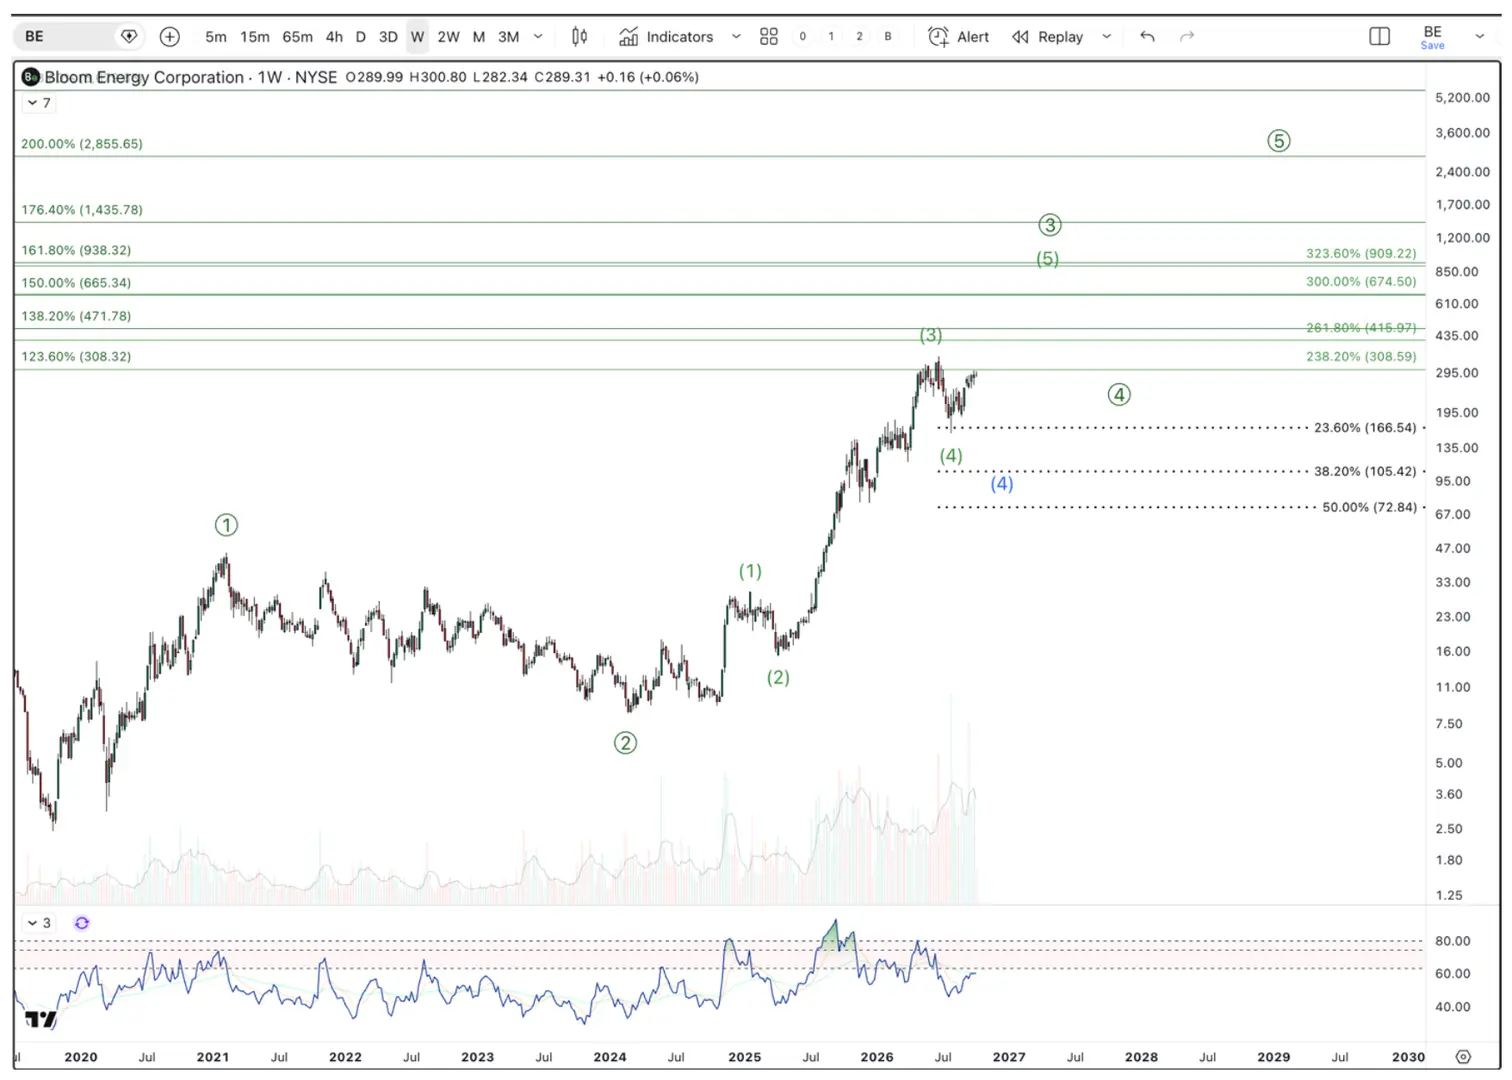
Bloom Energy addresses a very different challenge in the AI infrastructure buildout than networking or memory, yet its technical chart is signaling a similar long-term opportunity. Our analysis suggests Bloom is in the middle of a large five-wave pattern, with the potential for several more years of upside before the cycle is complete.
Bloom Energy appears to be advancing within a larger five-wave pattern following its 2024-2025 breakout. The bullish wave count identifies potential upside targets near $309, $416, $675, and $909, while support is seen around $167, $105, and $73 during any corrective pullbacks.
Year-End Risk Management Plan
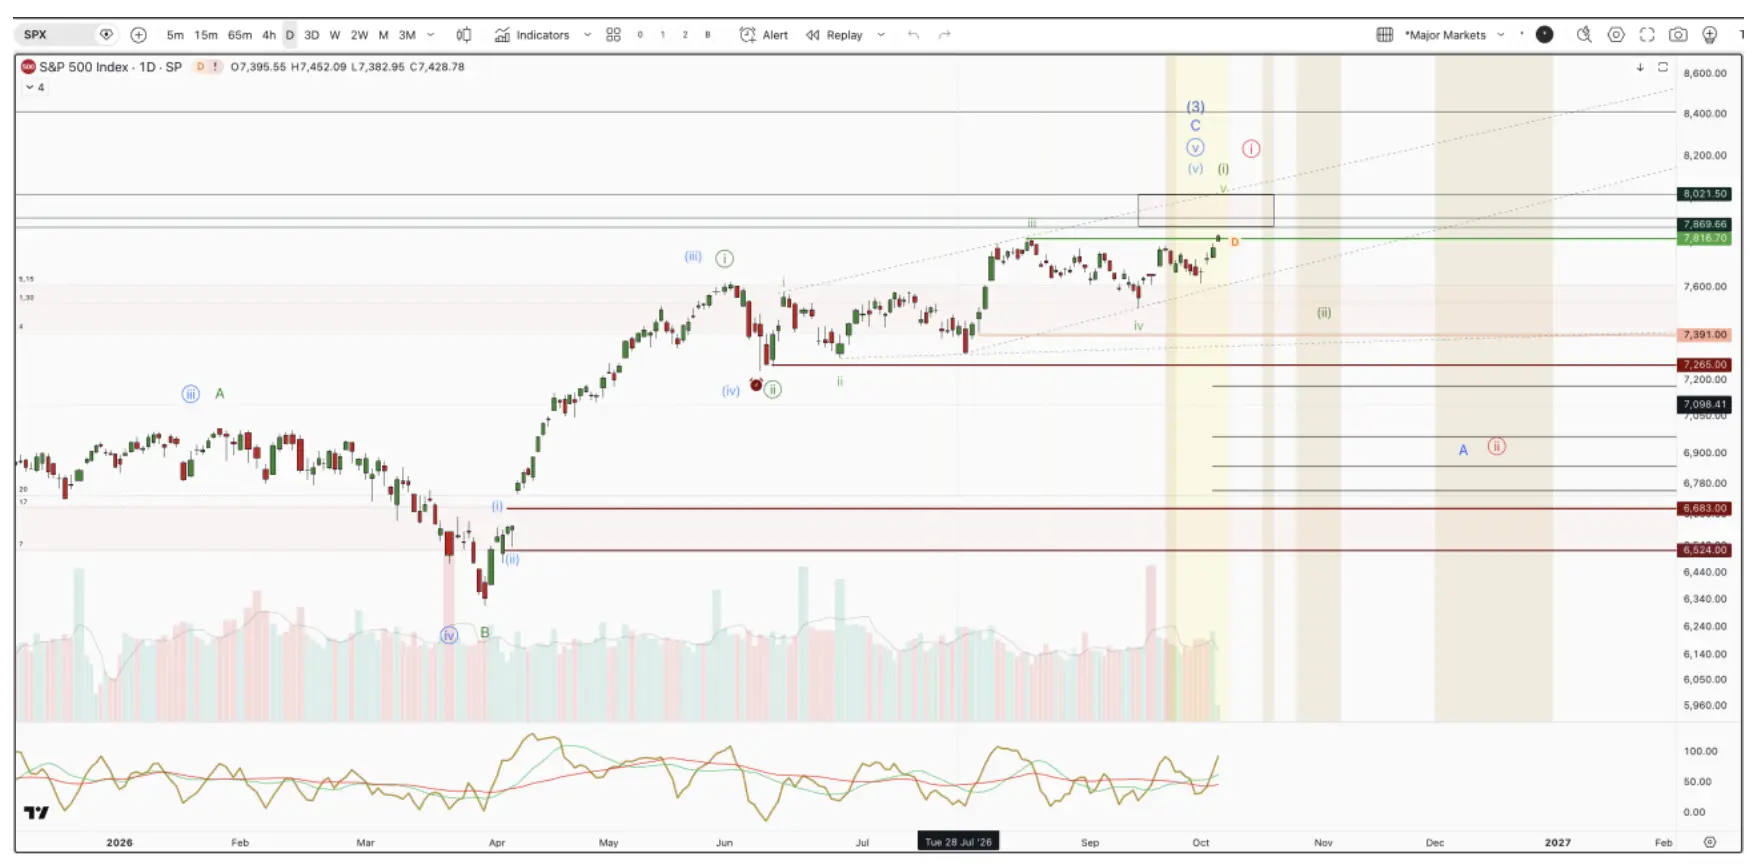
On a shorter timeframe, the S&P 500 appears to be setting up for a high of some kind into this cycle window. We appear to be tracing a smaller diagonal into this window, as shown below.
The S&P 500 has broken out to new highs, completing a smaller diagonal pattern. The analysis points to an initial pullback target near 7,300-7,265, with a deeper correction toward 7,000-6,683 possible if support breaks. Holding above 6,683 would keep the broader bullish outlook intact, while a sustained break below that level would increase the likelihood of a larger fourth-wave decline.
The breakout to all-time highs has confirmed this patterns completion. At minimum, we would then expect a pullback to the 7,300–7,265 area. If 7,265 breaks, the next target is 7,000–6,683.
This alternative scenario is outlined in red and is simply a different way to count the bullish scenario. Instead of a very shallow wave 2 happening in early June, which is what the green count is listing, we would be in that wave 2 once the 7265 support breaks. That would be uncomfortable, but as long as 6,683 holds, both outcomes would be pullbacks within a larger bullish uptrend. Below 6,683 and the odds will increase that we are setting up for the larger 4th wave drop targeting sub-6000.
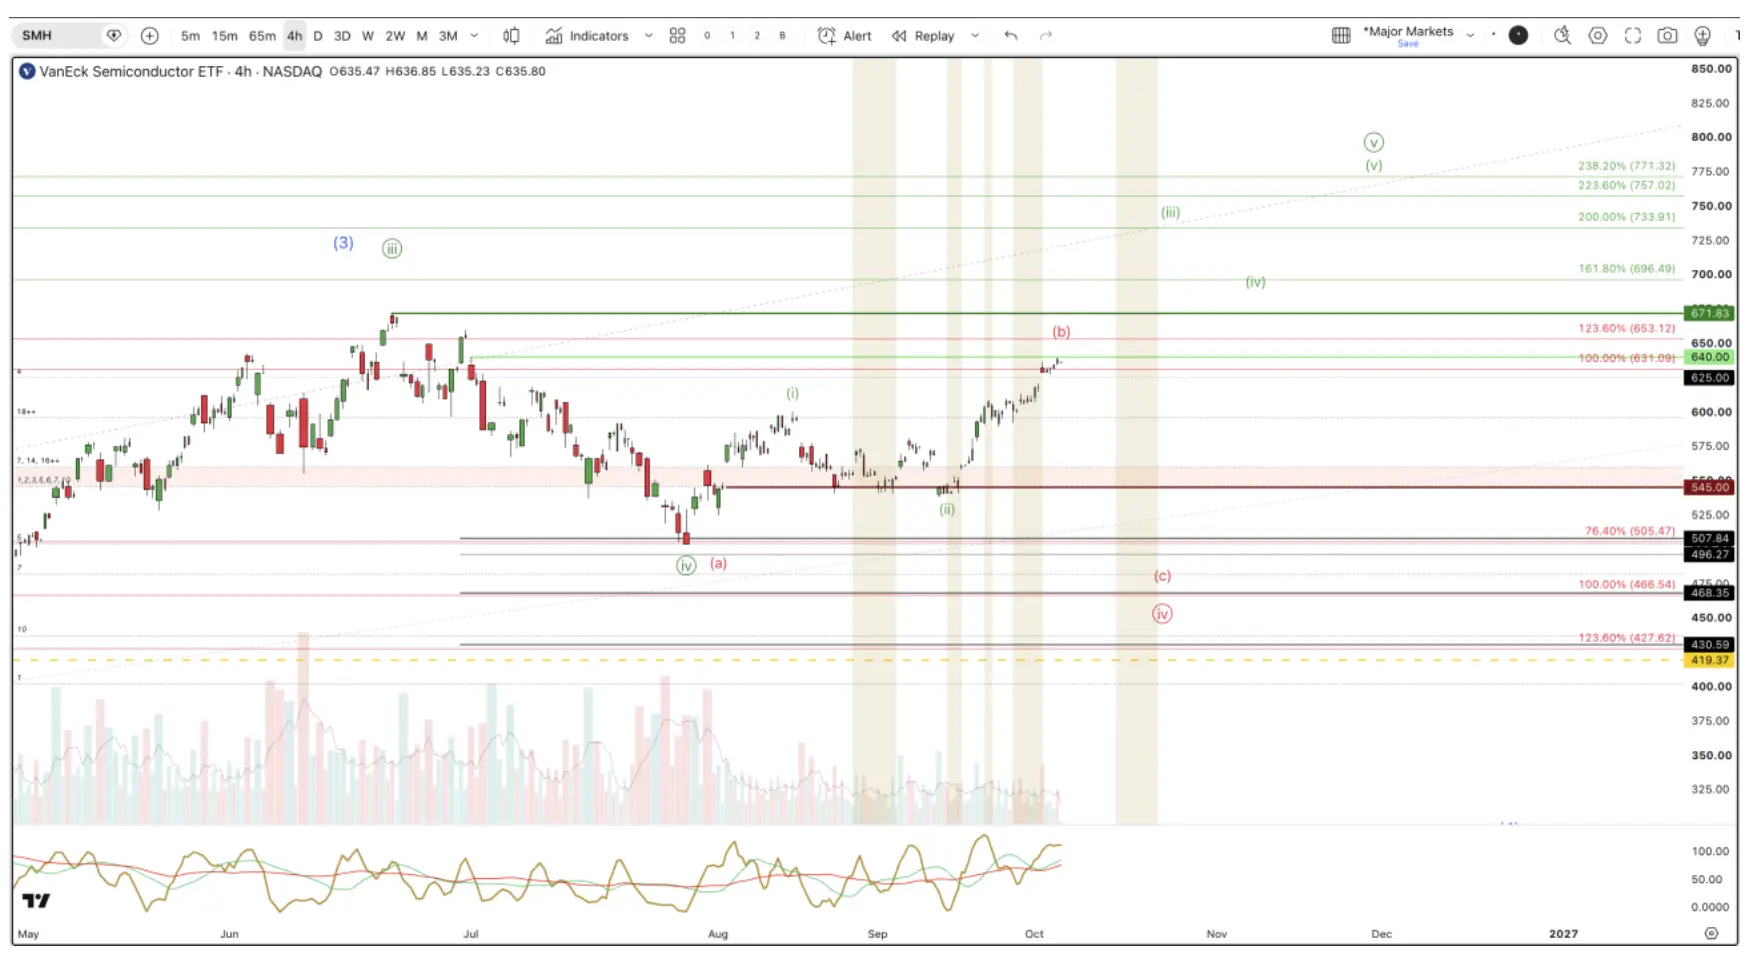
The important AI proxy in the broad semiconductor ETF (SMH) is confirming this risk. It is finishing a three-wave bounce on weak volume. Because the bounce made a lower high, it is best counted as a B wave in an ongoing correction, and not confirming the push higher in the S&P 500. A break below $541 would confirm this view, with a final target of $470–$430. A break above $640–$671.83 would invalidate the downside setup and point to a more bullish outcome sooner.
SMH has rebounded toward resistance at $640-$672 but remains below its prior high. The current move appears consistent with a B-wave rally, with a break below $545 supporting downside targets between $470 and $430. A breakout above $640-$672 would invalidate the bearish setup and signal a more bullish outlook.
Conclusion
Our analysis of the AI investment cycle, combined with strength in the U.S. economy, suggests the secular bull market has another 1-3 years to run. While the current cycle is mature, we believe some of the strongest gains may still be ahead. We will especially watch key levels, such as 6,683 on the S&P 500 to ensure our strategy remains unchanged.
However, the path will not be without volatility. A strengthening U.S. dollar could tighten global liquidity conditions, which we will review in next week’s article. We would view that weakness as a potential buying opportunity, particularly for lesser-known AI stocks, which we cover weekly in our 1-hour webinars held every Thursday at 4:30 p.m. Eastern.
Subscribe now to access our high-performing portfolio, including lesser-known AI names, plus real-time trade alerts on every entry and exit.
Our portfolio is up over 70% YTD—3X the Nasdaq-100—and we are crushing influencer-led tech ETFs both on a YTD basis and cumulative basis.
Please note: The I/O Fund conducts research and draws conclusions for the Fund’s positions. We then share that information with our readers. This is not a guarantee of a stock’s performance. Please consult your personal financial advisor before buying any stock in the companies mentioned in this analysis.