Blogs -Big Tech’s Free Cash Flow is Turning Negative – Who's Next? 

Big Tech’s Free Cash Flow is Turning Negative – Who's Next? 


July 19, 2026

author

Beth Kindig

Lead Tech Analyst

  • Big Tech is gaining momentum when it comes to AI monetization, but capex continues to far outpace operating cash flow. 
  • The company spending the most on capex in 2026 just went free cash flow negative, and our estimates suggest it may not be alone by year-end. 
  • Meanwhile, most of Big Tech is tapping capital markets to fortify their balance sheets, leading to huge debt increases. 

Big Tech’s AI revenue is accelerating, but free cash flow is moving sharply in the opposite direction. Across Google, Microsoft, Meta and Amazon, capex is rising much faster than operating cash flow as Big Tech races to build out AI infrastructure. While this is well understood, what may come as a surprise to investors is these highly liquid companies with strong earnings could soon, one-by-one, turn free cash flow negative as we move into 2027.  

In part one of our Big Tech earnings preview “Is AI Monetization Finally Catching Up to Capex?”, we examined AI monetization drivers supporting growth across these prominent AI companies. Below, we turn to the other side of the equation by looking at cash and debt balances, including how cash flow stacks up against surging capex.  

Notably, the Big Tech company spending the most on capex in 2026 already turned free cash flow negative, and our estimates suggest it may not be alone by year-end. 

Google Taps Capital Markets as FCF Drops Over 40% 

Starting with Google, the company ended Q1 with cash of $126.8 billion. Despite this war chest, Google has issued $20 billion in debt since Q1 ended, putting its pro forma debt balance at just over $100 billion. It also announced a massive multi-phase $84.75 billion gross equity raise. 

The first equity sale will put approximately $44.4 billion worth of net cash proceeds on its balance sheet, while the remaining $40 billion offering will be executed over time, beginning in Q3. Together, its Q1 debt and equity proceeds would increase the company’s pro forma cash balance to approximately $190 billion, before taking into account Q2 results. 

This gives the company a huge amount of liquidity to absorb future capex, which could be needed as capex continues to grow faster than operating cash flow (OCF). Capex increased by 107.4% YOY last quarter to $35.7 billion, coming in 1.8X higher than Google Cloud’s total revenue of $20 billion. Meanwhile, OCF rose just 26.7% to $45.8 billion. This led free cash flow (FCF) to fall (46.3%) to $10.1 billion, while over the last twelve months, FCF fell (21.9%) to $64.4 billion. 

mid

Google’s 2026 capex guidance of $180 billion to $190 billion implies capex of $149.3 billion for the rest of the year, at the midpoint. If Google repeats its LTM OCF growth of 31.5% over all of 2026, it would generate $170.8 billion in OCF during the rest of the year. This would lead to FCF of around $31.6 billion for the full year, down (56.9%) YoY. It is also possible that FCF could move below zero in a given quarter due to lumpiness.  

Another path to negative free cash flow would be for capex to grow more than 44% from 2026 levels. While that is above the current forecast of 30.2% growth, it is not implausible following an estimated 105% increase in 2026. If Google’s capex grows 44% or more in 2027, it would exceed projected OCF and become free cash flow negative. 

The current forecast then assumes capex growth slows sharply to just 7% in 2028, which may also prove too low. Based on projected OCF, capex growth of approximately 18% or more in 2028 would keep Google free cash flow negative for a second consecutive year. In other words, Google would be free cash flow negative in both 2027 and 2028 if capex grows at least 44% in 2027 and 18% in 2028. 
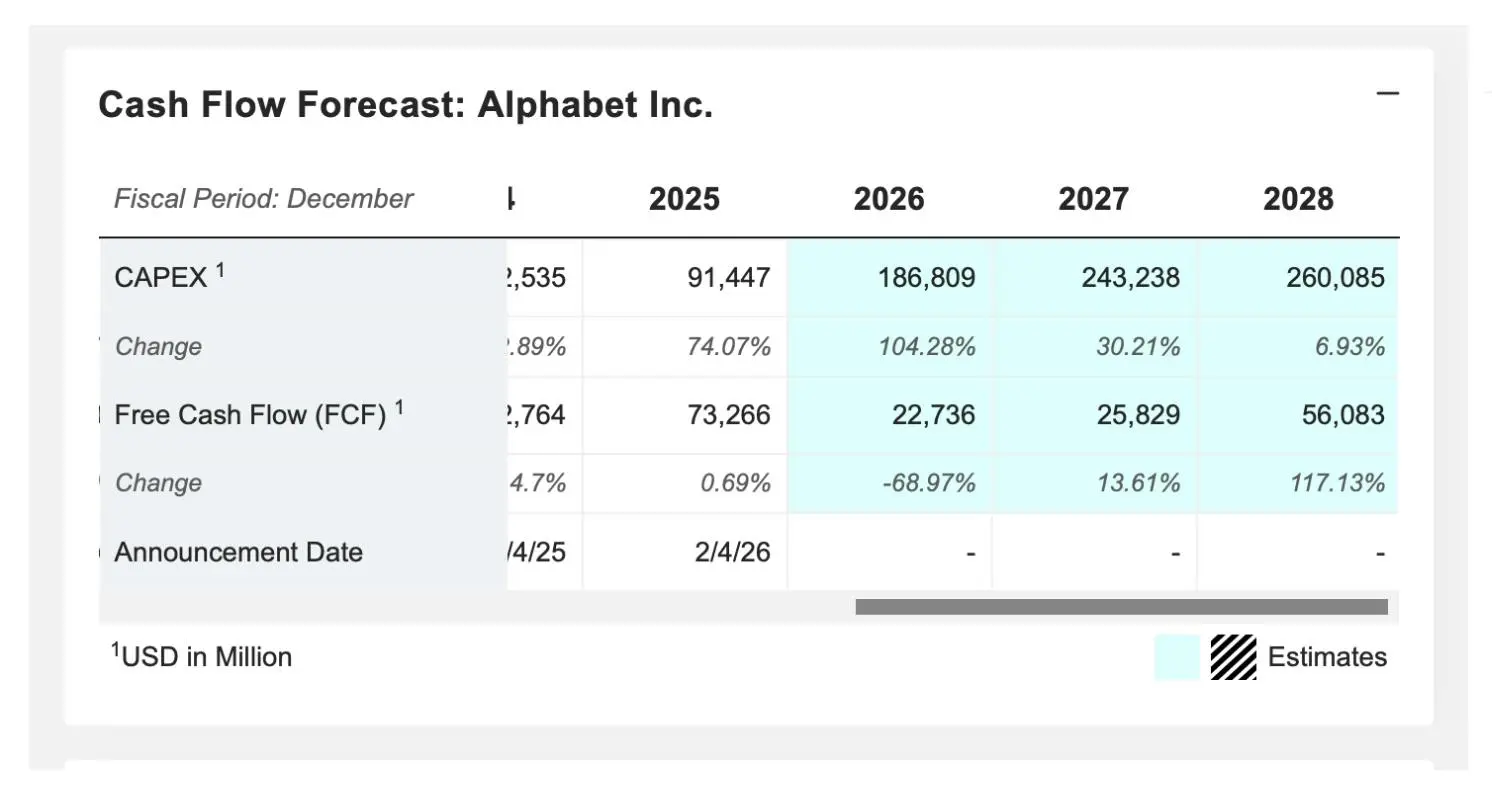
Alphabet cash flow forecast showing capex growth and declining free cash flow from 2025 to 2028.

Alphabet forecast table showing projected capex rising sharply through 2028 while free cash flow declines significantly in 2026 before recovering. Source: MarketScreener

Overall, even with Google Cloud growth nearly doubling to 63% YoY versus 32% YoY in Q2 2025, Google’s capex continued to far outpace this.  

Microsoft Avoids Capital Raises, FCF Could Turn Red

Microsoft ended last quarter with $78.2 billion in cash, down (1.7%) YoY, but unlike Google, it has not announced any debt or equity raises since, with its company’s long-term debt sitting at $40.3 billion. 

Notably, Microsoft’s capex grew by 84.4% last quarter, or more than 3X faster than the 26% increase in OCF. Still, OCF of $46.7 billion was more than 1.5X higher than capex, which came in at $30.9 billion. With Microsoft’s AI business achieving an over $37 billion ARR, implied revenue for the quarter was near $9.25 billion, or just 30% of capex.  

Microsoft's FCF picture is showing mixed signals, as quarterly FCF declined (22.2%) YoY to $15.8 billion, while LTM FCF rose moderately by 5.1% YOY to $72.9 billion. Microsoft’s current capex guidance is $190 billion for 2026, or $159.1 billion over the next three quarters. Repeating its LTM OCF growth of 30.2% over all of calendar 2026 would lead to OCF of $162.3 billion for the remainder of the year. In turn, this estimate would put Microsoft barely above breakeven FCF over that time.  

Notably, over the last 12 months, Microsoft has not tapped equity or debt markets to fund its AI buildout. In fact, the company’s cash from financing was -$56.1 billion over this period. This compares to -$7.4 billion at Meta, $7.9 billion at Google, and $62.5 billion for Amazon, not including financing activities since the end of last quarter. In other words, the cash Microsoft is using for dividends, buybacks, and debt repayment far exceeds the cash it is bringing in from issuing debt or shares. 

Despite this, Microsoft's disclosed AI revenue is well behind its capex, and the company is flirting with negative FCF generation in 2026 if OCF growth decelerates. 
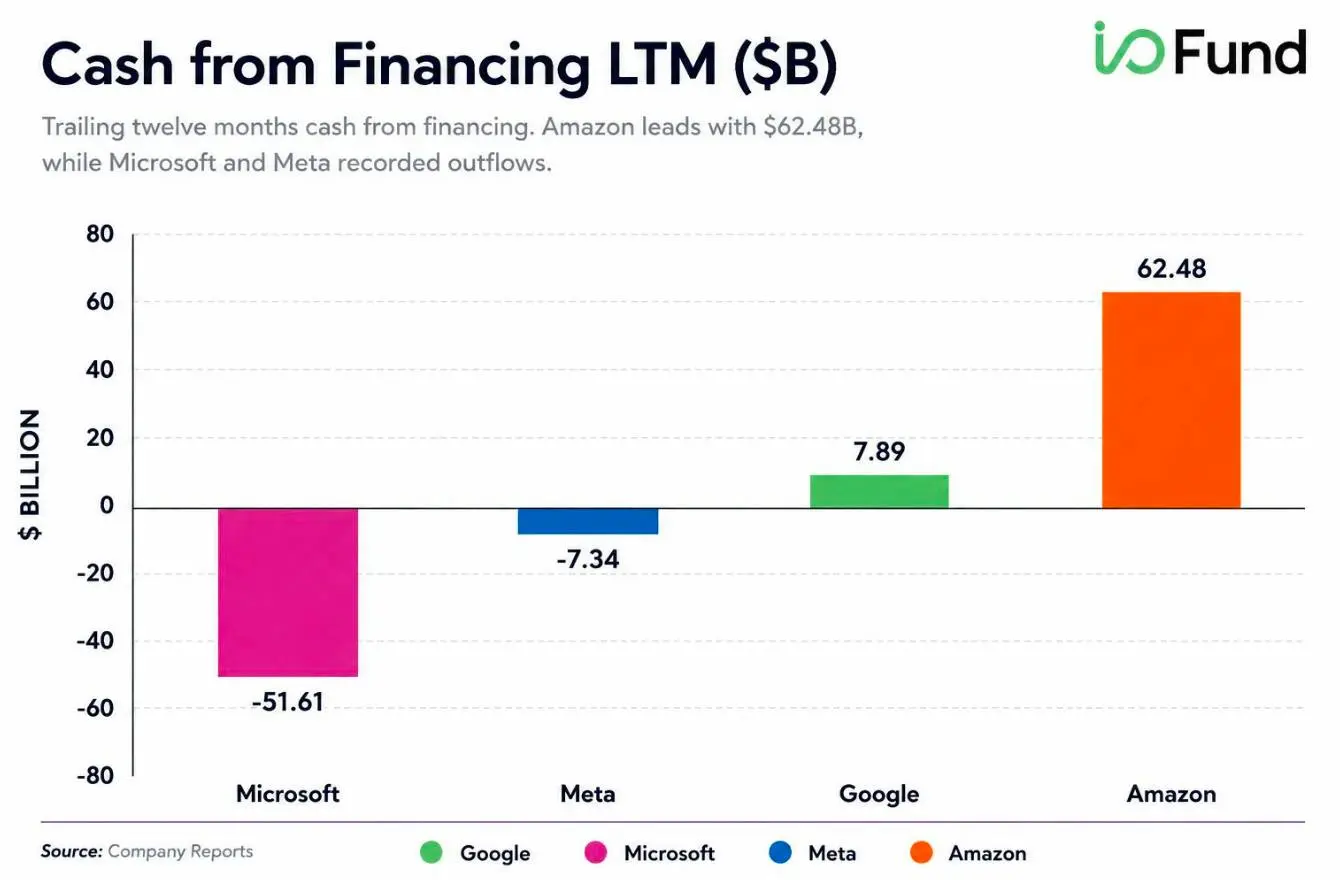
Bar chart comparing trailing twelve-month cash from financing for Microsoft, Meta, Google, and Amazon.

Bar chart showing trailing twelve-month cash from financing across Big Tech companies. Amazon leads with $62.48 billion, followed by Google at $7.89 billion, while Meta and Microsoft recorded financing outflows of $7.34 billion and $51.61 billion, respectively. Source: I/O Fund

Meta's FCF Remains Resilient Despite Rising AI Capex

At the end of Q1, Meta held $81.2 billion in cash, an increase of 15.6% YoY. Meta greatly increased its cash balance after issuing $29.9 billion in debt during Q4. Since the end of Q1, Meta has issued another $25 billion worth of debt. This brings its pro forma debt to approximately $83.7 billion, up 190% versus Q2 2025, and pro forma cash to around $105 billion. 

Meta's OCF grew by 34.1% in Q1 to $32.2 billion, while capex, including principal payments on finance leases, increased by 44.5% to $19.8 billion. In Q3 2025, Meta disclosed that its end-to-end AI-powered ad tools, known as Advantage+, passed $60 billion in ARR. This figure would need to have hit $80 billion in Q1 for capex to equal AI monetization; possible, but not verifiable. 

Due to Meta starting off at a much larger OCF base, its FCF managed to increase by 20.4% YOY to $12.4 billion. However, on an LTM basis, OCF rose just 29% to $124 billion, and capex rose 73% to $75.7 billion, leading LTM FCF to fall 7.8% to $48.3 billion. 

Meta forecasts capex, including principal payments on finance leases, of $135 billion at the midpoint in 2026, or $115.2 billion for the rest of the year. This implies average capex of $38.4 billion over that period, or nearly double its Q1 spend. In turn, Meta’s capital intensity should be much higher through the rest of 2026, with revenue not expected to grow nearly as fast. 

Notably, to hit OCF of $38.4 billion in Q2, the figure would need to grow by 50.2% YOY. This would be a high bar to clear, creating potential for Meta to turn free cash flow negative if capex scales abruptly. However, a gradual scaling of capex throughout the year would ease this burden greatly and allow OCF to catch up over time.  

Repeating its 29% LTM OCF growth rate would lead to OCF of $117 billion. Meta would manage to stay slightly FCF positive, although even a slight deceleration would put it up against negative FCF territory for the rest of 2026. 

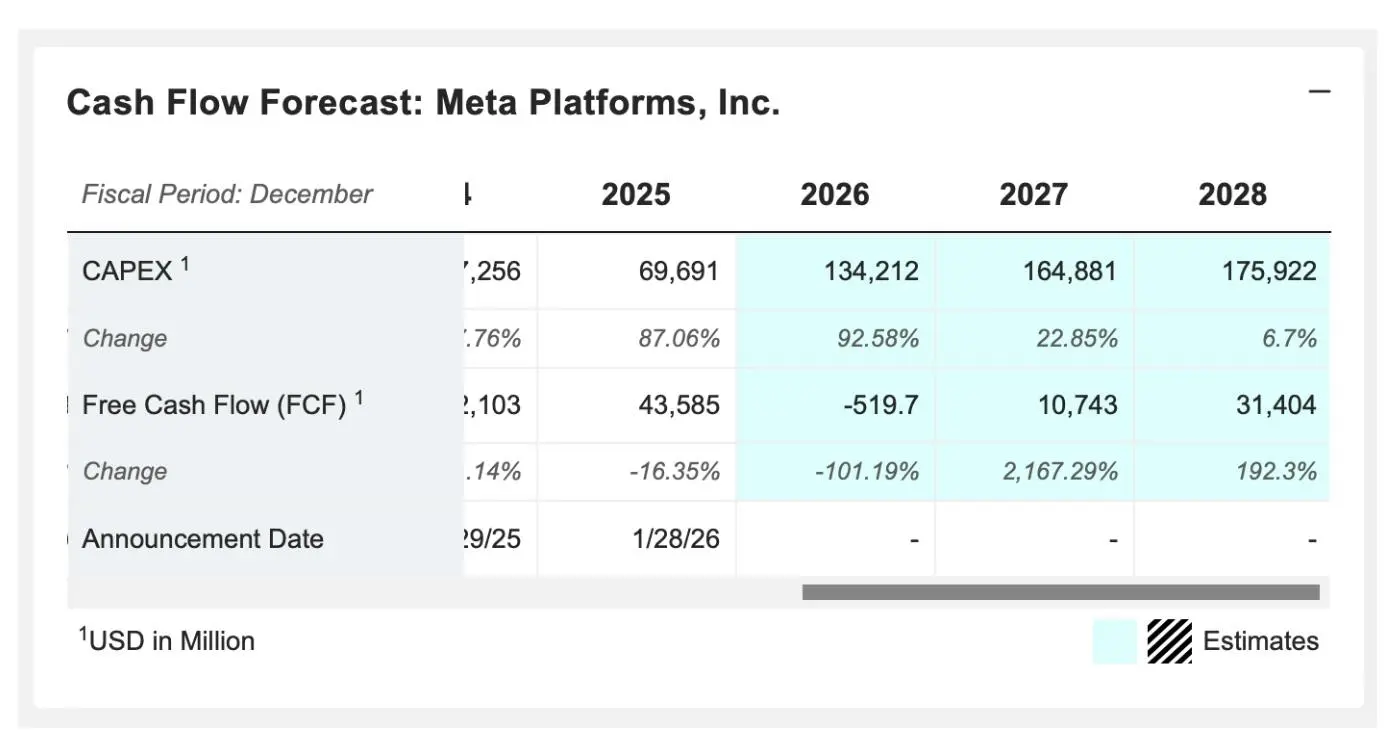
Meta cash flow forecast showing projected capital expenditures growth and free cash flow turning negative in 2026 before recovering through 2028.

Chart showing Meta on the brink of turning free cash flow negative in 2026 as AI infrastructure spending and capital expenditures rise rapidly toward operating cash flow. Source: MarketScreener

Amazon Becomes the First Big Tech Company to Turn Free Cash Flow Negative 

Finally, Amazon sat on a massive $143.1 billion cash pile at the end of last quarter. The company has also issued a huge amount of debt since then, including C$13.9 billion (approximately $9.93 billion) in estimated net proceeds from one offering and $24.9 billion in estimated net proceeds from another. Together, these offerings could push Amazon’s pro forma cash balance to nearly $180 billion and its long-term debt to nearly $154 billion, up 166% versus Q2 2025. 

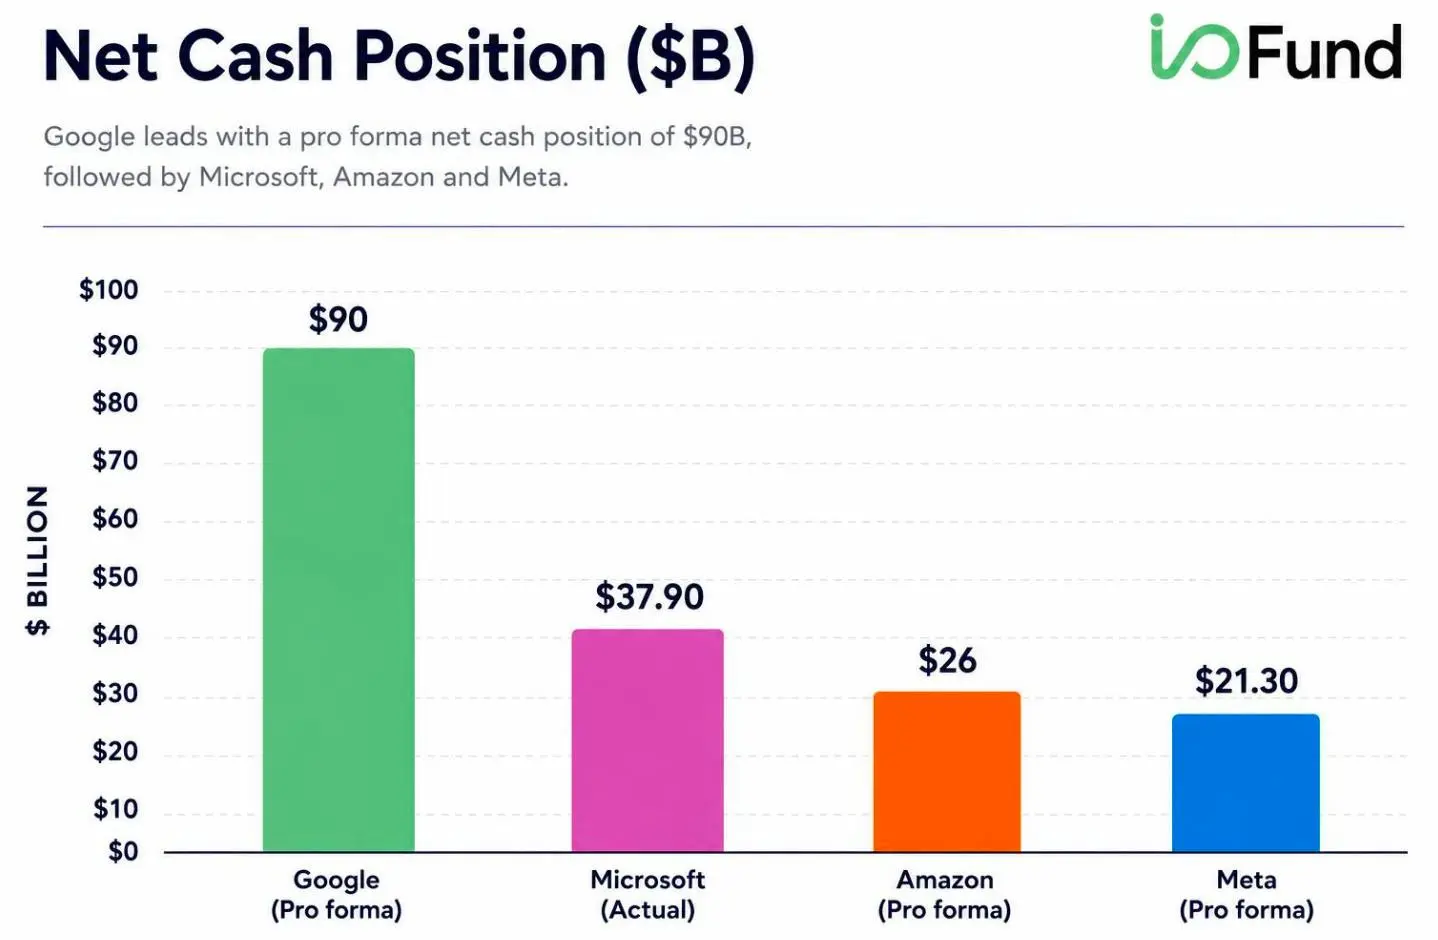
Notably, Amazon and Meta’s net cash positions would be $26 billion and $21.3 billion, respectively. These figures are considerably below Microsoft’s $37.9 billion net cash position, and all three would greatly trail Google’s $90 billion position. 

Bar chart comparing net cash positions of Google, Microsoft, Amazon, and Meta, with Google leading at $90 billion.

Bar chart showing net cash positions across major Big Tech companies. Google leads with a pro forma net cash position of $90 billion, followed by Microsoft at $37.9 billion, Amazon at $26 billion, and Meta at $21.3 billion. The chart highlights Google's significantly stronger liquidity position relative to its peers. Source: I/O Fund

Amazon’s FCF has already dipped into negative territory. Capex grew 78.5% last quarter to $43.2 billion. This compares to the company generating approximately $35 billion in ARR across AWS for AI and chips. That equates to $8.75 billion during the quarter, with capex being nearly 5X higher than this.  

Overall, OCF rose 53% to $26 billion, pushing FCF to -$17.2 billion. This led to LTM FCF of just $1.2 billion, nearly turning negative and dropping 95.3% versus the LTM ended Q1 2025. 

Amazon’s 2026 capex guidance is $200 billion, implying $156.8 billion over the rest of the year. The company’s LTM OCF grew by 30.4%. Hitting this mark during the full year would lead to OCF over the next three quarters of $155.9 billion, extremely close to its implied capex. 

Thus, based on this estimate, Amazon’s FCF would be negative over the full year, as it could not offset its large negative post in Q1. However, it is worth noting that Amazon’s capex was the most Q1-weighted among this group. Q1 capex accounted for 21.6% of its full-year capex guidance, compared to 19.3% for Google, 16.3% for Microsoft, and just 14.7% for Meta. By front-loading capacity investments, Amazon should have a longer runway to monetize them over the rest of 2026. 

Capex Continues to Outpace AI Monetization Across Big Tech 

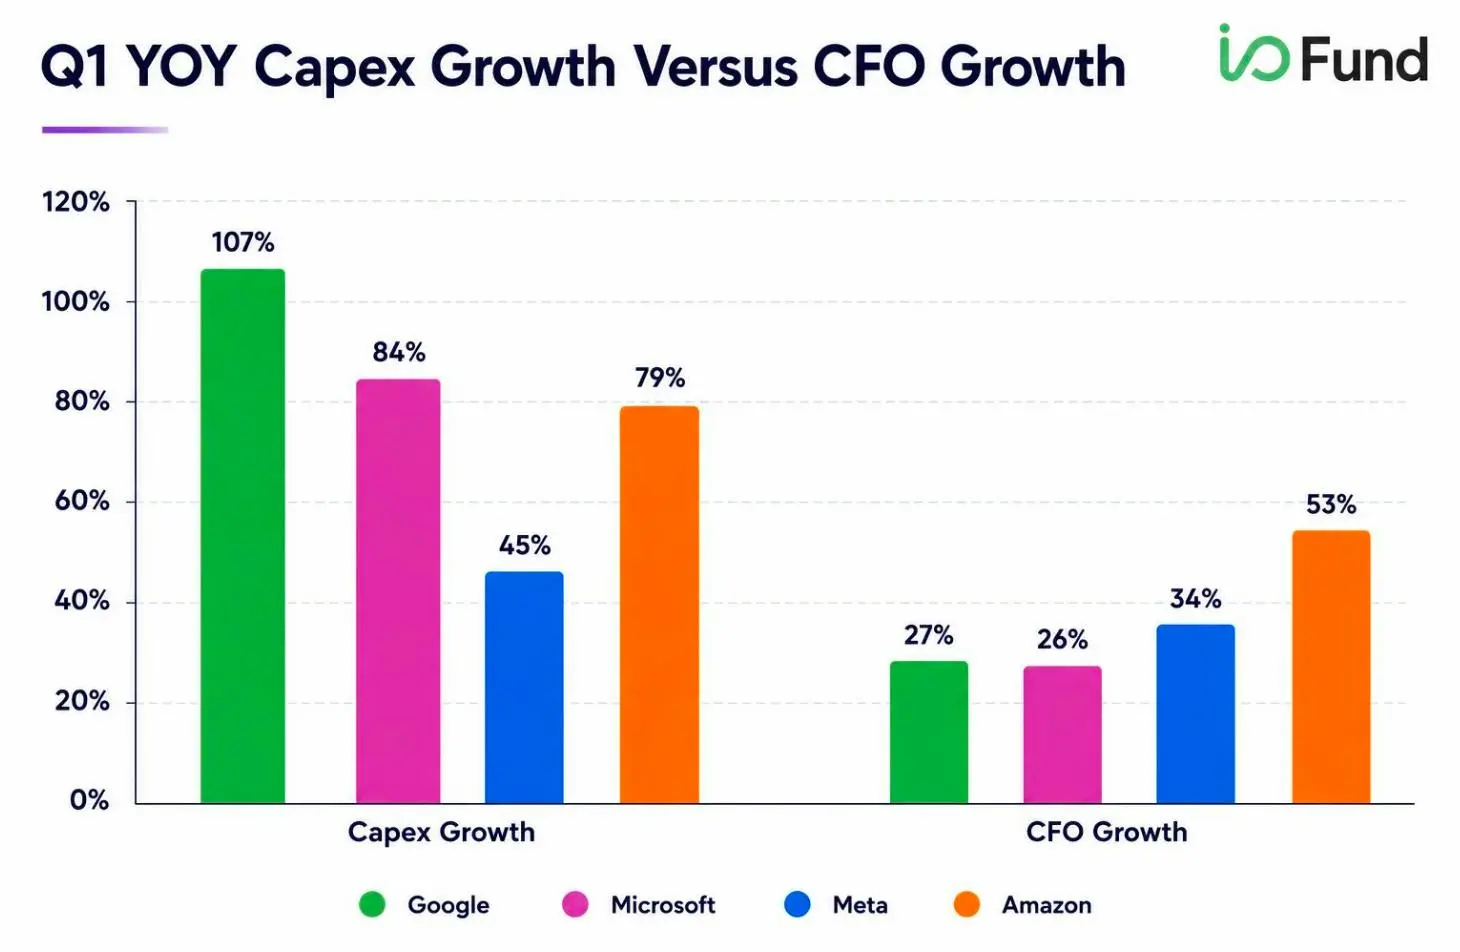
Overall, across Big Tech, capex growth still greatly surpassed many of the key AI revenue sources that these companies disclose, although an overall comparison is somewhat difficult given the lack of consistent and concrete updates on AI-specific sales. Additionally, capex growth exceeded OCF growth by very wide margins last quarter, with Meta being the only name where these rates were relatively close, largely due to its low Q1 spend. 

Bar chart comparing Q1 year-over-year capex growth and operating cash flow growth for Google, Microsoft, Meta, and Amazon.

Bar chart showing Q1 year-over-year growth in capital expenditures (capex) and operating cash flow (CFO/OCF) across Google, Microsoft, Meta, and Amazon. Capex growth significantly exceeds cash flow growth for all four companies, with Google reporting the highest capex growth at 107%, followed by Microsoft at 84%, Amazon at 79%, and Meta at 45%. Operating cash flow growth ranged from 26% to 53%, highlighting the widening gap between AI infrastructure spending and cash generation. Source: I/O Fund

Conclusion

As pointed out in our previous analysis “Is AI Monetization Finally Catching up to Capex?” Big Tech is making measurable progress on AI monetization. Google is seeing an acceleration across Cloud and search, Microsoft’s AI annual recurring revenue has nearly tripled since the beginning of 2025, Meta posted its fastest growth in more than four years, and AWS delivered its strongest growth in 15 quarters.  

However, capex is growing much faster than operating cash flow, and is far outpacing AI monetization rates and cash flows. Amazon appears to be at significant risk of turning FCF negative in 2026, while Meta is on the brink of seeing negative FCF in 2026, and Google could hit this undesirable milestone in 2027-2028. Q2 earnings are unlikely to reverse this dynamic on their own, but they will show whether AI monetization is beginning to catch up t to the scale of these investments. 

The I/O Fund’s core investment thesis has been to invest in the suppliers that directly benefit from rising capex rather than relying solely on the companies funding it. 

Instead of positioning in Big Tech, the I/O Fund concentrated our portfolio across networking, energy and memory stocks. Despite sector-wide volatility in July, we currently have five positions up over 100% YTD and ten positions up over 50% - with many held at high allocations.  

This is not one year of outperformance. Since our inception in May 2020, the I/O Fund has delivered a cumulative return of 326% — outperforming the Nasdaq-100 by 152 percentage points, and that comparison does not yet include our 2026 outperformance. 

Subscribers receive the Top 15 AI Stocks report, real-time trade alerts, full portfolio access, and weekly one-hour webinars.
Sign up now

Please note: The I/O Fund conducts research and draws conclusions for the company’s portfolio. We then share that information with our readers and offer real-time trade notifications. This is not a guarantee of a stock’s performance and it is not financial advice. Please consult your personal financial advisor before buying any stock in the companies mentioned in this analysis.  

Leo Miller, AI and Semiconductor Investment Writer at I/O Fund, contributed to this analysis. Leo Miller owns shares in META and GOOGL.

👉🏻 Share with a Fellow Investor
Help someone else benefit from this insight.

Recommended Reading:

head bg

More To Explore

Newsletter

Amazon, Meta, Microsoft, and Google displayed with financial charts, illustrating rising AI capex and growing free cash flow pressure across Big Tech.

Big Tech’s Free Cash Flow is Turning Negative – Who's Next? 

Big Tech’s AI revenue is accelerating, but free cash flow is moving sharply in the opposite direction. Across Google, Microsoft, Meta and Amazon, capex is rising much faster than operating cash flow a

July 19, 2026
Illustration of Google, Microsoft, Meta, and Amazon stock dashboards against a digital circuit-board background, symbolizing Big Tech earnings, AI growth, and investor performance.

Big Tech Earnings Preview: Is AI Monetization Finally Catching Up to Capex?

The most pronounced difference between 2026’s tech rally compared to rallies in the past is which companies have been left out of it. The names most associated with the AI trade have hardly participat

July 17, 2026
Side-by-side image of an NVIDIA CMX server and a CXL memory expansion card against a data center background.

Nvidia, CXL, and the Battle to Improve AI Inference Economics

This is Part 2 of our two-part series on AI inference economics. In Part 1 — Why Nvidia's Next AI Battle Is About Tokens per Watt, we laid out why tokens per watt has become the defining metric for in

July 12, 2026
NVIDIA BlueField networking platform card shown on a green digital network background.

Why Nvidia’s Next AI Battle Is About Tokens per Watt 

As hyperscalers move from building AI infrastructure to monetizing it, tokens per watt helps to reflect if revenue is scaling and if profitability is improving. Offload engines can increase tokens per

July 10, 2026
Micron HBM3E chip with glowing data streams representing AI memory demand and high-bandwidth memory technology

Micron Is Up 900%. Here’s Why the AI Memory Trade May Still Have Room to Run

Over the past 10 months, memory chip stocks have gone from being solid beneficiaries of the AI boom to capturing a massively outsized piece of the return pie. The inflection in Micron’s performance de

June 26, 2026
Fighter jets flying over a city with smoke rising, overlaid by a rising S&P 500 chart, illustrating markets climbing despite the Iran war.

Why the S&P 500 Shrugged Off the Iran War — and What Could Finally Break the Rally 

On February 28th, the U.S. went to war with Iran, and the market was handed the kind of shock it hasn't contended with for years. The conflict set off a chain reaction across the region: an ongoing su

June 19, 2026
AI cloud and GPU infrastructure visualization representing NVIDIA, CoreWeave, and Nebius in the circular financing of the GPU boom

Nvidia, CoreWeave, and Nebius: Inside the Circular Financing of the GPU Boom

Neoclouds are one of the more hotly debated AI business models, with CoreWeave and Nebius being the two most widely recognized names. These companies have seen their sales, backlog, and share prices s

June 12, 2026
Arm and Nvidia standalone CPU servers in an advanced AI data center environment.

AMD, Nvidia, Arm, Intel: Inside the $120 Billion CPU Gold Rush

CPUs have gone from an afterthought to becoming the AI trade’s next great bottleneck – and with AMD, Nvidia, Arm and Intel circling a market that is doubling nearly overnight, the only question left i

June 05, 2026
AI data center infrastructure with NVIDIA and Google highlighting AI networking and semiconductor growth

Google TPU v8 vs Nvidia: How Inference Is Rewriting the AI Market

In April, Google announced it would begin selling its TPUs to select third-party data center operators, which is something the market has anticipated for nearly a decade. The TPU-versus-Nvidia-GPU deb

May 31, 2026
Modern data center corridor with rows of servers and bright blue fiber optic cables, illustrating high-speed AI networking and optical data transmission

The AI Networking Stock That Beat Nvidia by 7X YTD for Returns of 135% YTD

AI networking stock Lumentum is among the key I/O Fund winners in 2026. We allocated heavily to LITE in January—a month before Nvidia backed the company. While most investors couldn’t stomach taking a

May 22, 2026
newsletter

Sign up for Analysis on
the Best Tech Stocks


Copyright © 2010 - 2026