Nasdaq100 Levels to Watch for the Next Leg Higher
June 11, 2021

Knox Ridley
Portfolio Manager

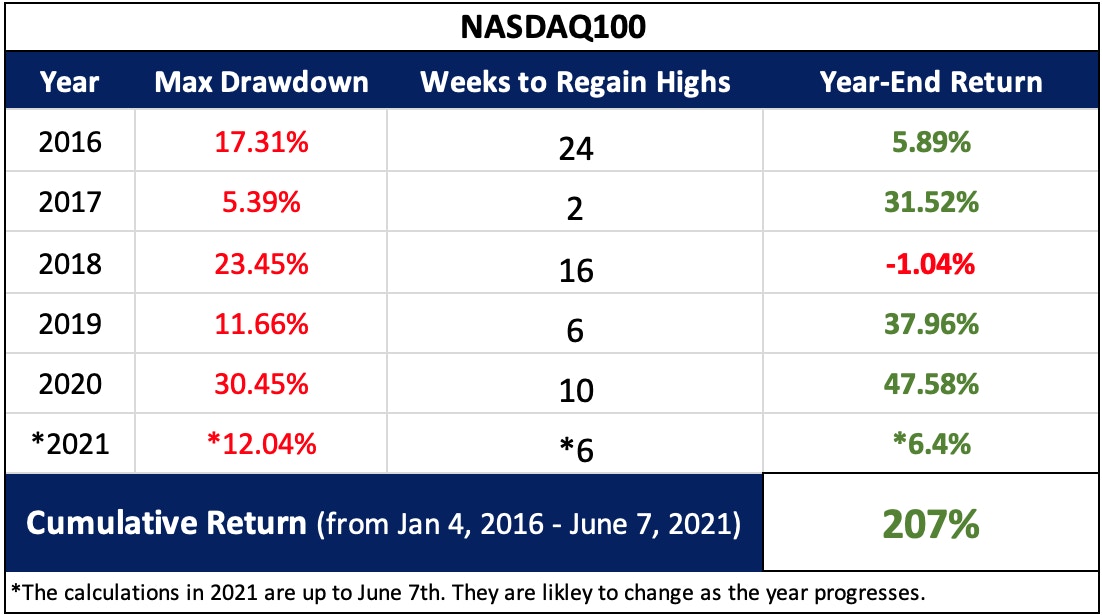
Being a contrarian in tech investing has been a rewarding strategy over the last 5 years. Believe it or not, as far back as 2016, the contrarian position in tech was to remain a bull. Each year since, floods of articles presented the popular thesis that the “tech bubble” was about to burst (2016, 2017, 2018, 2019, 2020, 2021).
For those that remained a contrarian, the cumulative returns of the NASDAQ100 since 2016 has been ~ 207% returns. Meanwhile, the average drawdown per year since 2016 was an eye popping 17%, while the average annual return for the year was about 21%.

Only those who ignored the talk of a bubble participated in the epic run that has resulted in the Nasdaq100 driving forward some of the world’s most valuable companies. Which leads to another point: analysts continually and consistently misunderstand tech in the early days of a company’s rise. Using value metrics to build the case for a bubble, these same analysts have gone silent when that bubble refuses to cooperate with soothsayer predictions.
Once again, this year is witnessing a rotation out of tech growth, as more articles claim that this is the actual popping of the tech bubble – for real, this time. Although I do believe the market will experience a true secular bear market at some point in the future, more importantly, I believe the market is setting up first for what appears to be the next leg higher.
I also believe that tech, as well as growth, will resume its lead in the next leg higher. I outline my reasons below.
1) Understanding Tech and What it is Telling us Now
From September of 2019 through January of 2020, the market narrative was that cloud computing was over stretched, resulting in a severe value rotation. At that time, we were hearing that the stocks in this sector had price/sales ratios greater than many of the tech stocks during the dot.com bubble.
A fair representation of these companies can be found in the ETF with the ticker symbol CLOU. This is a pure play on the cloud microtrend and was overweight many of the richly valued tech darlings of the time, such as Zoom, Shopify, Crowdstrike - just to name a few.
Despite cloud being “overstretched” with “dot-com like valuations,” from the February peak to the March low, CLOU saw a 32.94% drawdown, compared with the S&P500 that saw a 35.63%. Also, worth noting, CLOU finished the year up 77.9% while the S&P500 finished the year up 18.4%.
In other words, stocks with little to no earnings, and a price/sales ratio ranging between 20 – 40, provided more protection to investors during the March ’20 bear market than the value oriented broad markets. The reason behind this phenomenon is either ignored or shrugged off as an anomaly; however, understanding why this occurred is the type of information that would help one to identify companies like Amazon and Google in early stages, despite their rich valuations.
Beneath the negative earnings, and price/sales ratios well into the double digits, are powerful microtrends that can scale globally. Beth Kindig of the I/O Fund presciently wrote an article in 2019 stating that Cloud Computing would be a good safe haven in an economic contraction, even with bubble-like valuations.
“My prediction is this may be one of the last cycles when tech is considered less safe than value stocks. As the market will find out (the hard way), cloud software is actually very safe. It is insulated from trade wars and overseas manufacturing issues. It reduces costs for enterprises, which is ideal for a recession.”
Her thesis was simply that the cloud microtrend was still in the middle of its expansion, and the very nature of migrating to the cloud makes enterprises more efficient as well as reduces costly IT overhead, which can help them survive slowing GDP.
Furthermore, we are seeing companies within cloud grow YoY revenues at rates that are historical records. For example, in recent reports: Shopify grew YoY revenue by 110.4%, Zoom by 191.4% (this is after 3 consecutive quarters of greater than 350% growth), Snowflake grew by 110% and Crowdstrike grew by 70%.
All of these companies came in above consensus in the most recent quarter while most raised forward guidance. We are now lapping the most critical quarter for tougher comps from Covid and we think in the next couple of months, the words “tougher comps” will fade from memory as the better term will be “sustained growth.”
2) Technical Signals
Where is the money from growth flowing?
Since the February top in 2021, we have seen a large rotation from growth names into value. Some have posited that the growth trend is over, and the era of value is set to lead. To get a clue as to whether this thesis is correct, I think analyzing the flow of money from tech is key.
On a simple 3-month relative return, which takes us back to the start of the correction, we can see money flowing from high growth sectors and into value sectors.

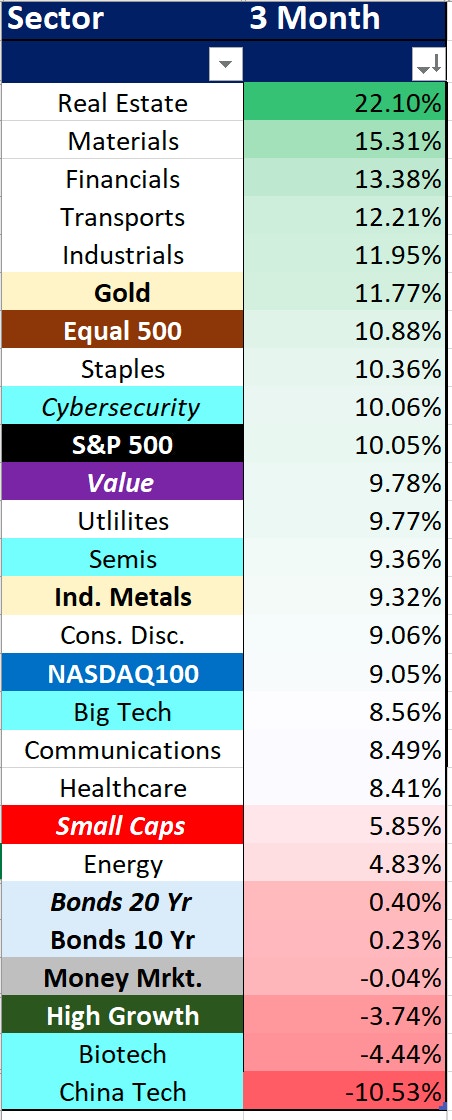
However, if we dig down a little deeper, the money seems to be flowing into early-mid cycle sectors, such transportation, financials, industrials, materials. The standard late-cycle sectors, such as utilities and consumers staples, appear to be lagging, which suggests that the market is more likely positioning for a move higher than preparing for a protracted drawdown.
I further believe that the market put in an important bottom on May 12th. Below is a chart showing that since the May 12th bottom, quietly, we’re starting to see a rotation back to high growth names, and the selling of value as well as commodities.

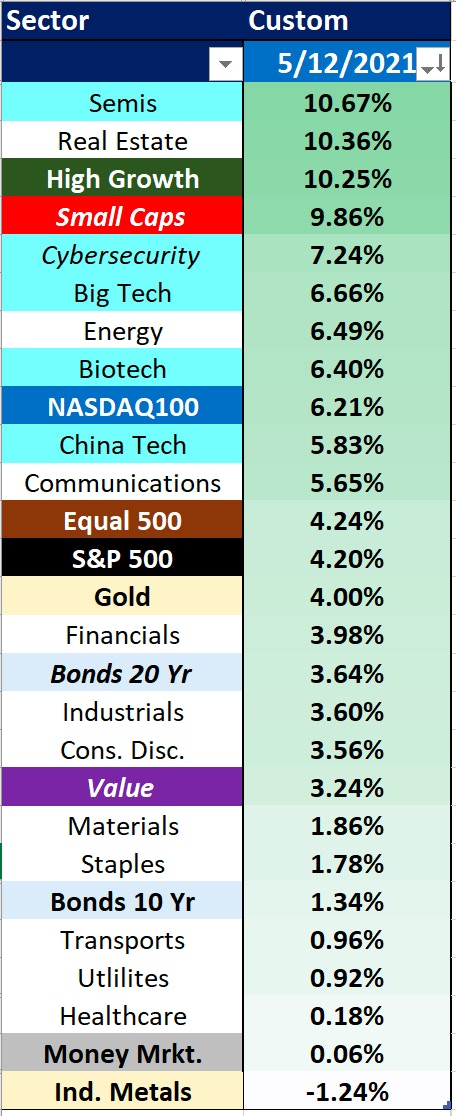
It appears that underneath the moderate price movements in the broad market, we’re beginning to see a rotation back into growth names. We will need to see this trend continue, but so far, if the bottom is in, the up days in the market are suggesting a continuation of growth outperformance.
Breakouts Around the World
Just like in late 2016, we are seeing an abundance of analysts suggesting that the major top is in or we are close. This would be followed by a major and protracted bear market. Also, just like in late 2016, this thesis is not being supported by the price action in major markets around the world.

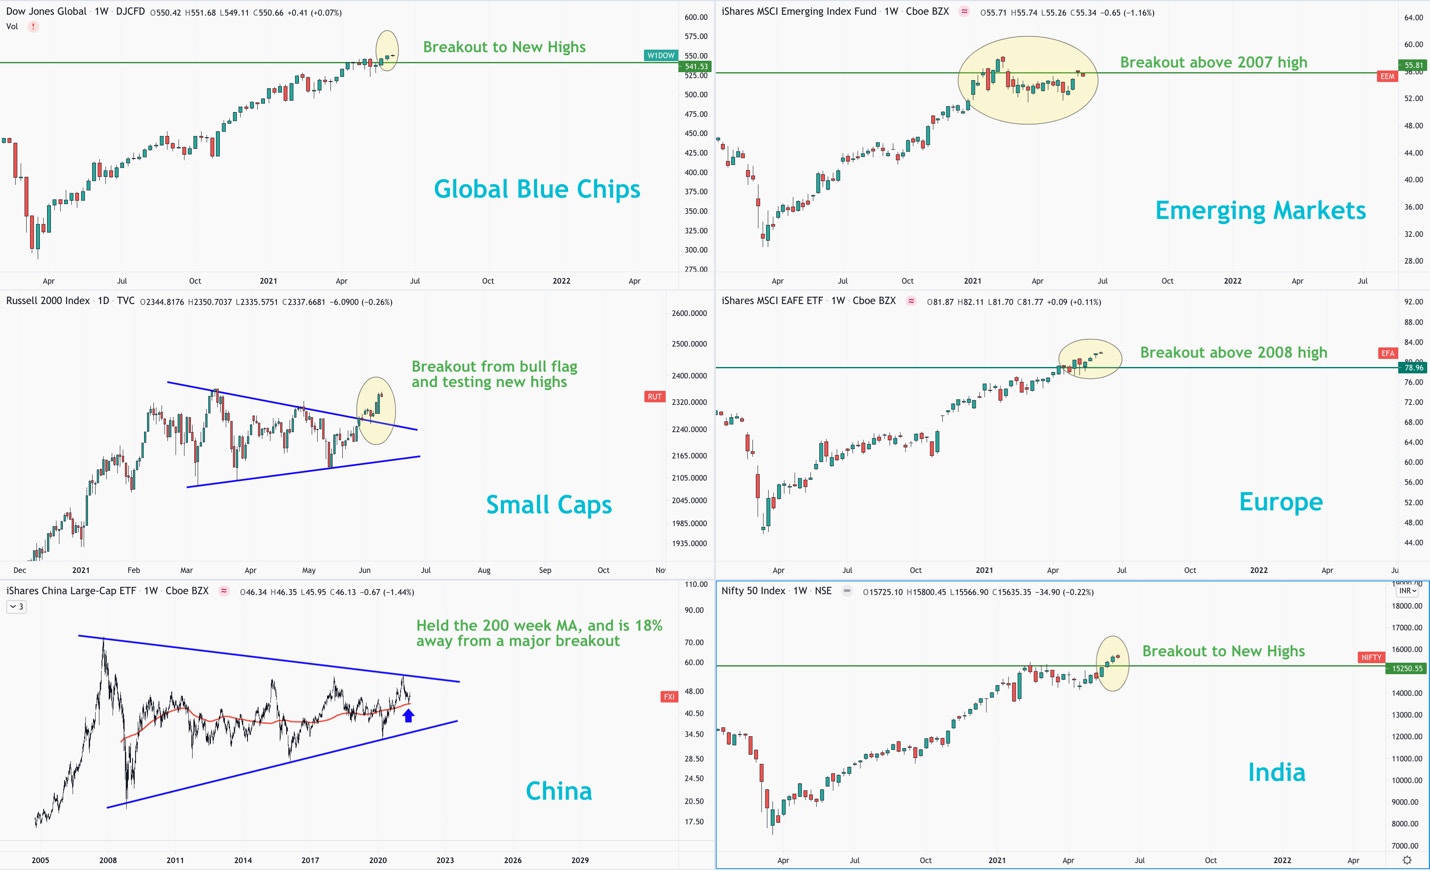
The above chart illustrates the breakouts we are seeing across the board: Global Blue Chips, Emerging Markets, Europe, India, even Small Caps are showing strength, as is China. These are typically not the intermarket signals we see just prior to a major bear market.
Strong Market Breadth
Market breadth is a technical measurement that measures the number of companies participating in a trend. In other words, if the number of companies that are participating in a broad market uptrend is growing with the market, then this is a healthy uptrend.
On the other hand, leading into most corrections, we see market breadth decreasing while the broad market continues higher. If fewer stocks are holding the markets up, this is typically a bad sign for an uptrend.
We use many methods to measure market breadth, but the simplest and oldest way is the advance decline line. Simply put, this indicator plots the difference between the number of stocks in the market that are increasing in price vs. the ones that are decreasing.

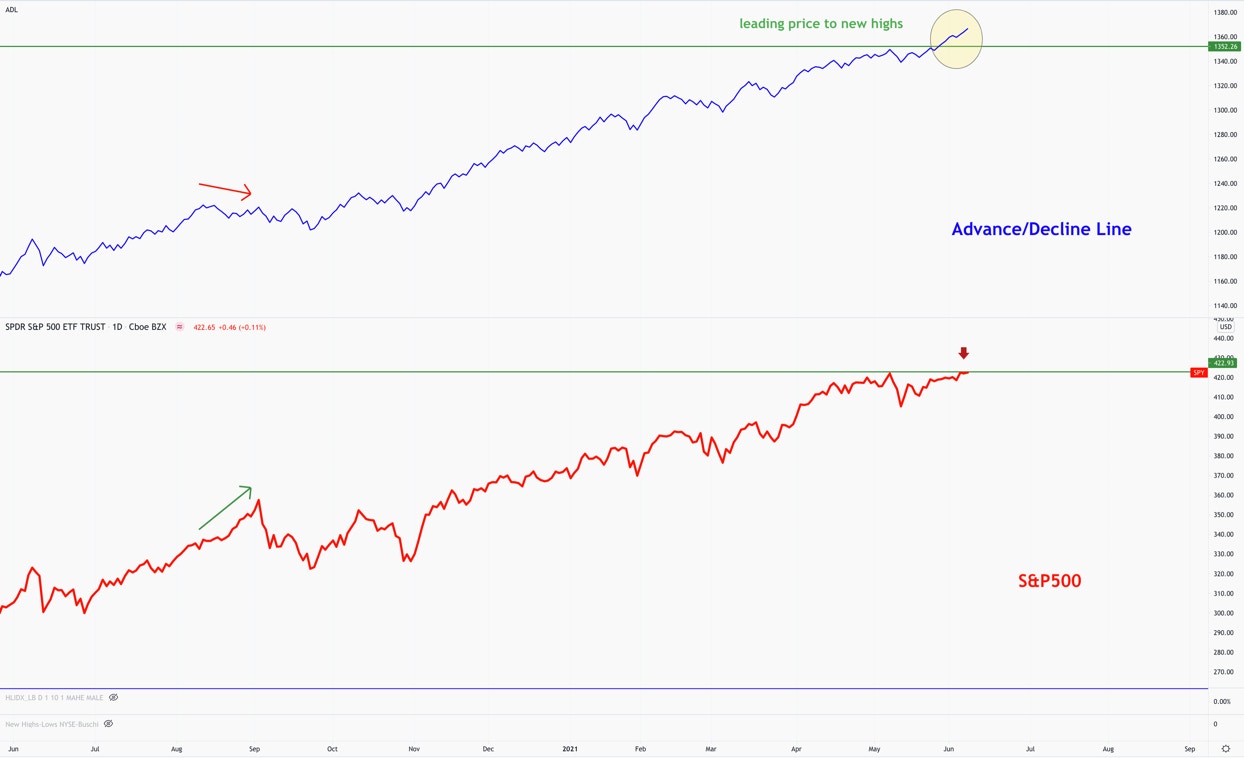
If we compare this indicator to the S&P 500, we can see an instance leading up to the September selloff in 2020 where the advance/decline line was signaling weakness, while the market continued higher. Today, we are not seeing this. In fact, the advance/decline line is breaking out to new highs before the market. This is indicating that more stocks in the market are moving up vs. down, and when we see this indicator breaking out ahead of price, more time than not, price follows.
The NASDAQ100
Most importantly, the NASDAQ100 (NDX) appears to be setting up for a large breakout move.

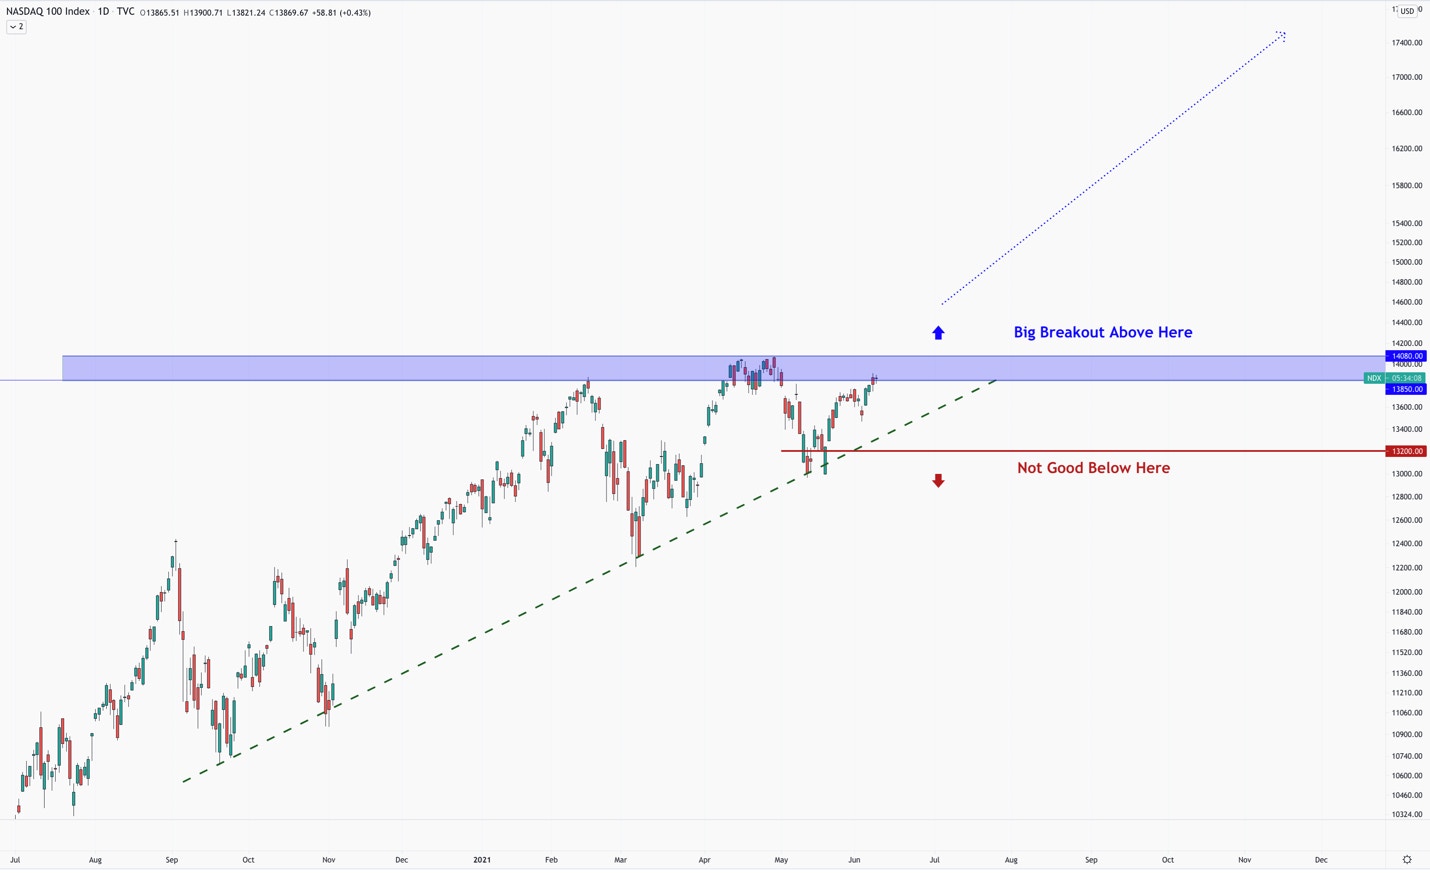
NDX is approaching a major resistance zone in blue on the chart (between 3800-4080). The upward-trending, zig-zag pattern into this resistance is typically a bullish pattern. Also, note how the price has respected the upward sloping trendline, which is highlighted with the dashed green line. This is also a promising sign, and gives us a clear level to work with regarding any coming weakness.
The Counter Argument
With as many bullish signals as we are getting, the NASDAQ100 must confirm the next leg higher with a breakout above 14080. Tech is simply too important of a sector both in the economy as well as being a large percentage of the broad market. If NDX fails to break out, and instead breaks below major support at 13200, we could see another correction before we can get another shot at a breakout setup.
Also, the transportation index is flashing a potential warning that this breakout could be premature.
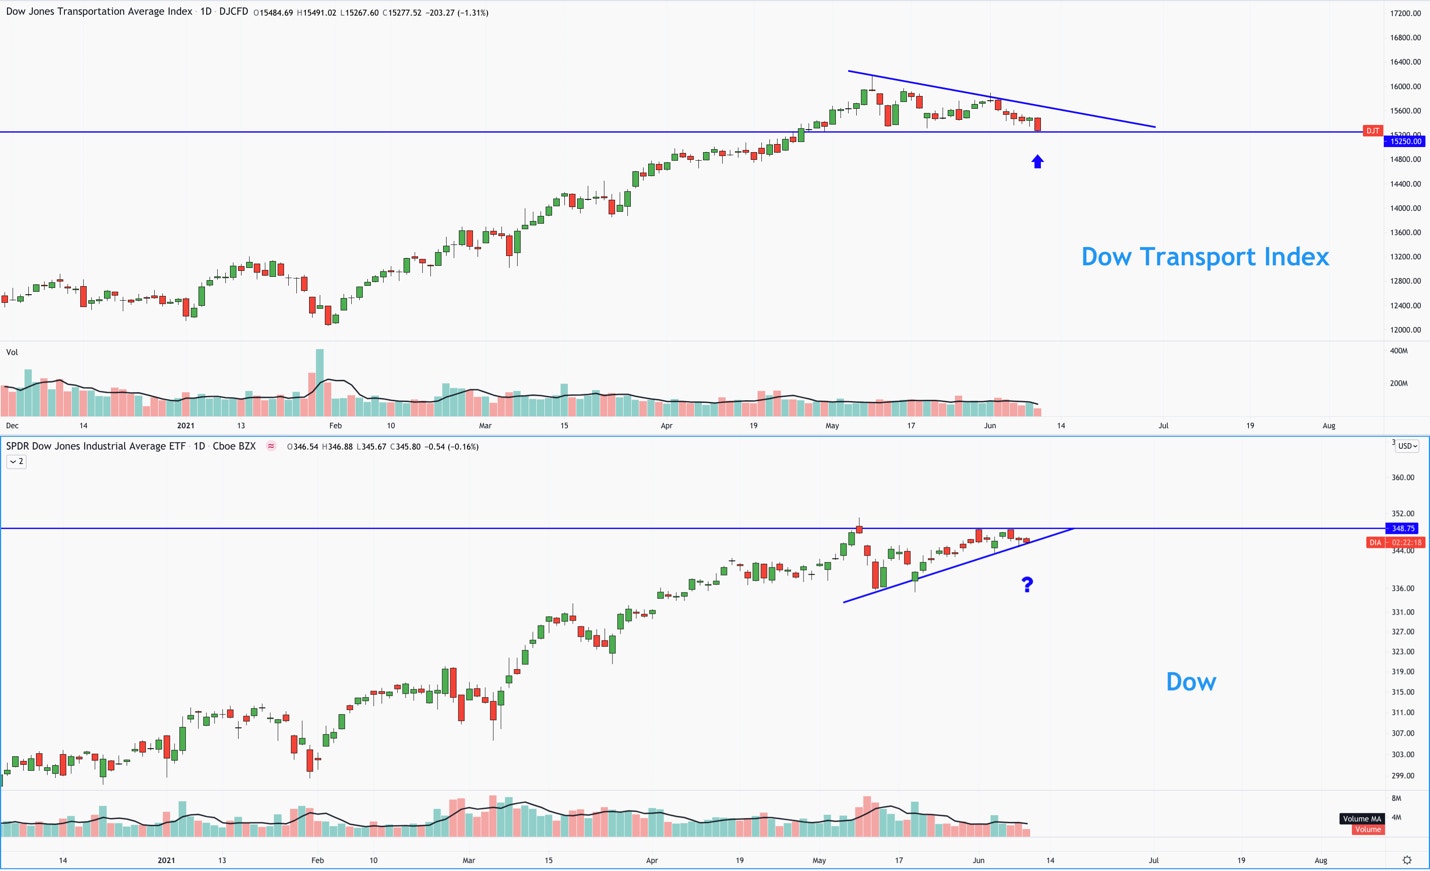
Historically, the transportation index tends to lead the market. Because global commerce relies on transportation, a slowing down in this sector tends to signal a slow-down in the economy. Also, because equities are usually looking ~6 months out, the price of the transportation index can be a strong leading indicator.
As of today, the Dow Jones Transportation Index (DJT) is trending down while the rest of the major indexes are trending up. Because of the tight consolidation, this trend could change in an instant; however, I would not get too concerned unless supports break across the board in the U.S markets.
Supports to watch
Dow Jones Transportation Index – 15250
Dow Jones Industrial Index – 34300
NASDAQ100 – 13200
Regardless of the bullish signals and global breakouts we identified, if the above supports breakdown, we will likely look to hedge our portfolio over the short to intermediate-term time frame. We believe the outlook, as of now, is signaling a higher probability of another leg higher. However, until price agrees with our thesis, the I/O Fund remains cautiously bullish.


More To Explore
Newsletter

Nvidia and Google Are Crowding TSMC’s N3 Node - Can Intel Fill the Gap?
Nvidia is moving its next-generation Rubin GPUs from 4nm to 3nm, yet Google’s latest TPUs are already on N3 and are expected to remain there. Meanwhile, a growing number of AI CPUs from Nvidia, Amazon

Intel vs TSMC: How CoWoS Packaging Constraints Could Create an Opportunity for Intel Foundry
Taiwan Semiconductor (TSMC) is the single, most important company to the AI industry. However, to compete with the incumbent, Intel does not need to beat TSMC at leading-edge manufacturing. It only ne

Big Tech’s Free Cash Flow is Turning Negative – Who's Next?
Big Tech’s AI revenue is accelerating, but free cash flow is moving sharply in the opposite direction. Across Google, Microsoft, Meta and Amazon, capex is rising much faster than operating cash flow a
Big Tech Earnings Preview: Is AI Monetization Finally Catching Up to Capex?
The most pronounced difference between 2026’s tech rally compared to rallies in the past is which companies have been left out of it. The names most associated with the AI trade have hardly participat
Nvidia, CXL, and the Battle to Improve AI Inference Economics
This is Part 2 of our two-part series on AI inference economics. In Part 1 — Why Nvidia's Next AI Battle Is About Tokens per Watt, we laid out why tokens per watt has become the defining metric for in
Why Nvidia’s Next AI Battle Is About Tokens per Watt
As hyperscalers move from building AI infrastructure to monetizing it, tokens per watt helps to reflect if revenue is scaling and if profitability is improving. Offload engines can increase tokens per

Micron Is Up 900%. Here’s Why the AI Memory Trade May Still Have Room to Run
Over the past 10 months, memory chip stocks have gone from being solid beneficiaries of the AI boom to capturing a massively outsized piece of the return pie. The inflection in Micron’s performance de

Why the S&P 500 Shrugged Off the Iran War — and What Could Finally Break the Rally
On February 28th, the U.S. went to war with Iran, and the market was handed the kind of shock it hasn't contended with for years. The conflict set off a chain reaction across the region: an ongoing su

Nvidia, CoreWeave, and Nebius: Inside the Circular Financing of the GPU Boom
Neoclouds are one of the more hotly debated AI business models, with CoreWeave and Nebius being the two most widely recognized names. These companies have seen their sales, backlog, and share prices s

AMD, Nvidia, Arm, Intel: Inside the $120 Billion CPU Gold Rush
CPUs have gone from an afterthought to becoming the AI trade’s next great bottleneck – and with AMD, Nvidia, Arm and Intel circling a market that is doubling nearly overnight, the only question left i
