The Case for Bitcoin to $2 Million After This Bear Market
Knox Ridley·AUG 21, 2026·15 min read
On this page
Bitcoin is the best-performing asset in modern market history, outperforming even the greatest technology stocks of the past two decades. Yet those historic returns have come with equally historic volatility, including repeated drawdowns of 70% or more before eventually reaching new highs. If you’re reading this article, you likely know this firsthand.
Although Bitcoin has no shortage of spokespeople, it is far more difficult to find reliable technical analysis that helps investors navigate this immense volatility. Meanwhile, the I/O Fund’s track record has often come from being on the opposite side of the most vocal Bitcoin advocates. The difference can be enormous, since buying near a major low or chasing a euphoric top can mean years of outperformance or years of losses.
This is where the I/O Fund’s track record has often placed us on the opposite side of Bitcoin’s most vocal advocates. We called the bottom near $17K in 2022, then warned in our August report — “Is Bitcoin’s Bull Run Nearing a Top? What the Herd Missed at $16,000 and is Missing Now” — that Bitcoin was potentially putting in a major top on the next swing higher, against the prevailing narrative at the time. Bitcoin has since fallen by 54%.
But that is only the latest in a series of impeccable, turning-point calls dating back to 2019. Notably, our price targets don’t come from a perma-Bitcoin bull who has led the masses into steep losses, but rather, from the same grounded, technically-driven process that has driven outperformance across both crypto and AI stocks.
We are in one of these tricky bear cycles now, and while we are seeing a nice bounce off the $57,717 low, we do not believe that we have seen the low in this bear market. Until we see Bitcoin in the $30,000 range, we will view any push higher as a bounce within a large downtrend, as this bear market continues to unfold.
However, while our intermediate-term outlook in Bitcoin is not great, our long-term outlook is quite bullish. Once this bear cycle completes, we believe that Bitcoin could produce another epic bull run that likely seems impossible today. For this reason, the I/O Fund is revealing for the first time that our long-term price target in Bitcoin is $2 million. It may sound extreme, but so was calling the Bitcoin top near $100K as well as the 2022 bottom around $17K.
Our latest analysis lays out how we plan to navigate the rest of this bear cycle, along with the technical roadmap to $2 million — a view further supported by what we’re seeing across the U.S. dollar, Treasuries, and gold, which together point to a challenging macro backdrop that could ultimately turn favorable for Bitcoin.
I/O Fund Review submitted on Seeking Alpha Platform Forum on August 20th, 2026.
The Signal That Suggests Bitcoin’s Bear Market Isn’t Finished
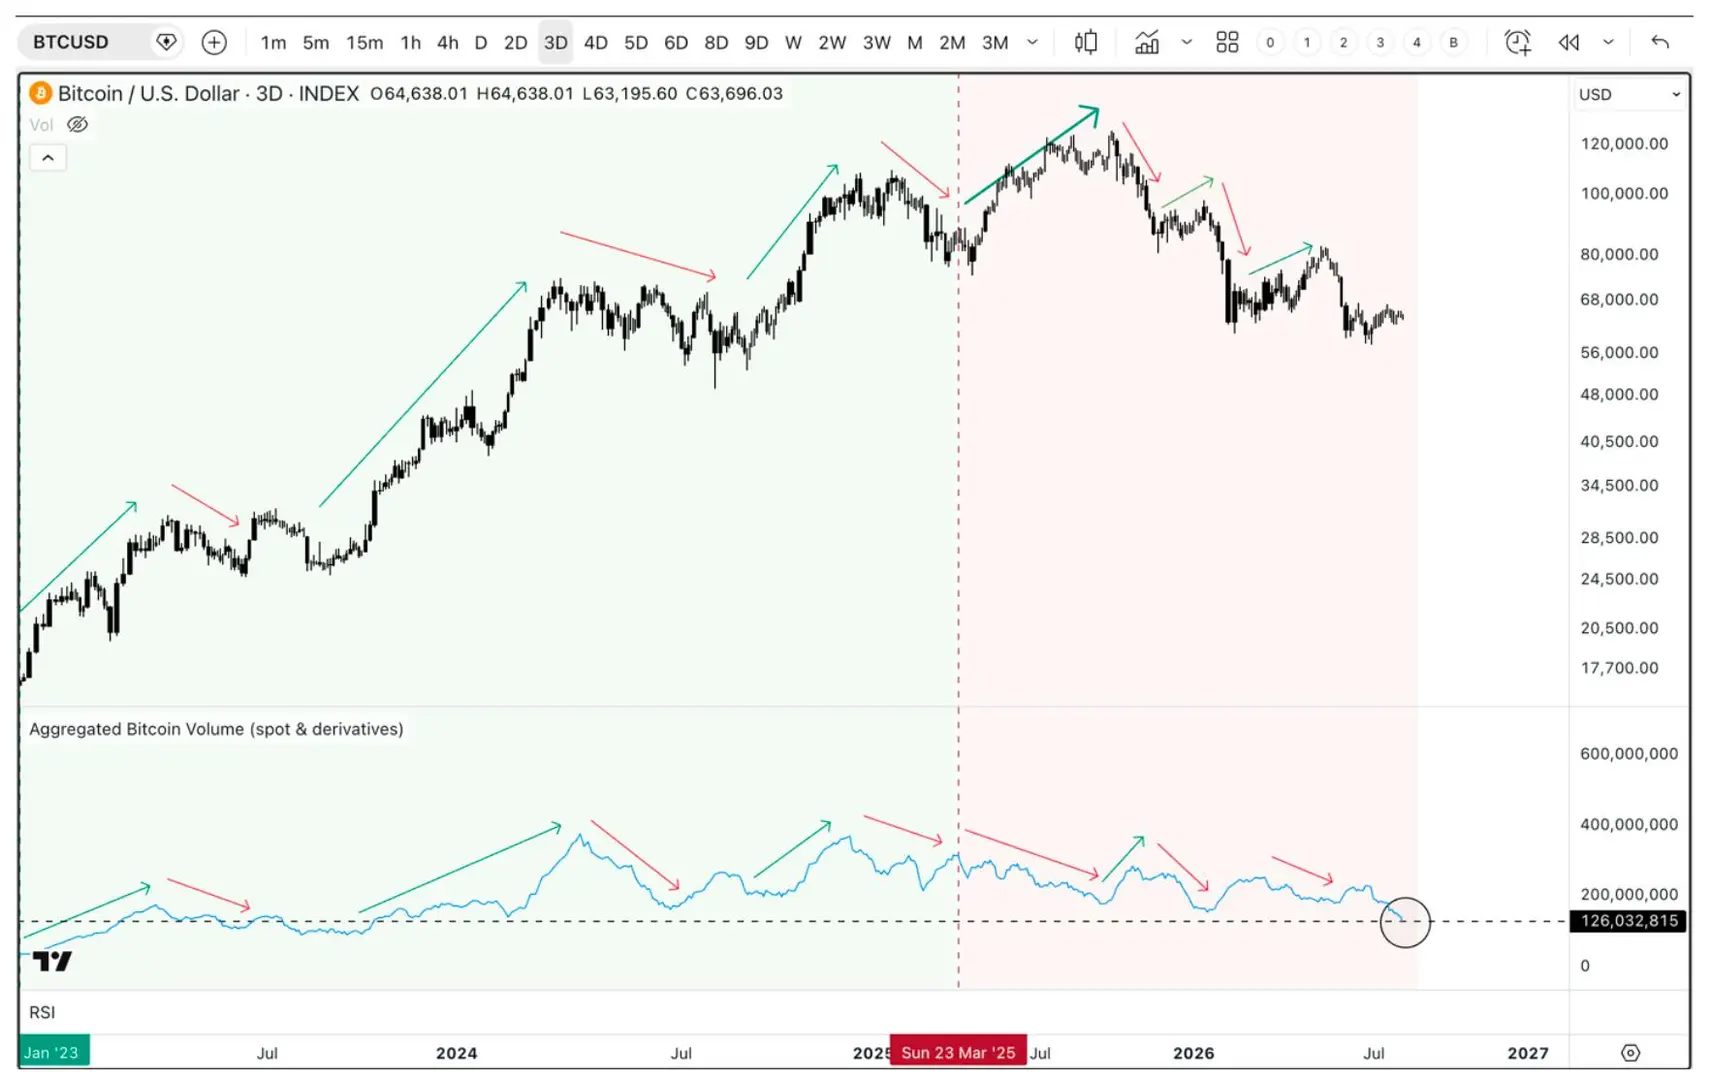
Volume and pattern analysis has consistently kept us on the right side of Bitcoin swings, and these signals are the ones we will continue to use to navigate the current bear cycle. Regarding volume, this is a simple technique we introduced in our May 2025 report on Bitcoin. The characteristic of a typical bull market is that volume expands with price, then retraces when we see a correction. This is exactly the characteristic we saw from early 2022 – March 2025 (marked in green on the chart below).
The chart compares Bitcoin price action with aggregated spot and derivatives volume from 2023 to 2026. While Bitcoin reached new highs in 2025, trading volume failed to confirm the move and has since weakened during rallies, suggesting reduced buyer participation and a continuing bear market environment.
Volume Is Telling a Different Story Than Price
What changed in March of last year is that we began to see an inversion between price and volume (marked in red). While price made a new high into October, it did so with a notable deceleration in volume.
This marked an important change in character for Bitcoin. Ever since, volume has only expanded when price drops, and it tends to shrink when we are in a bounce. Not only is this pattern in play today on the current bounce, but Aggregate Bitcoin Volume has reached a 2-year low, implying that buyers are not coming out to support the recent low.
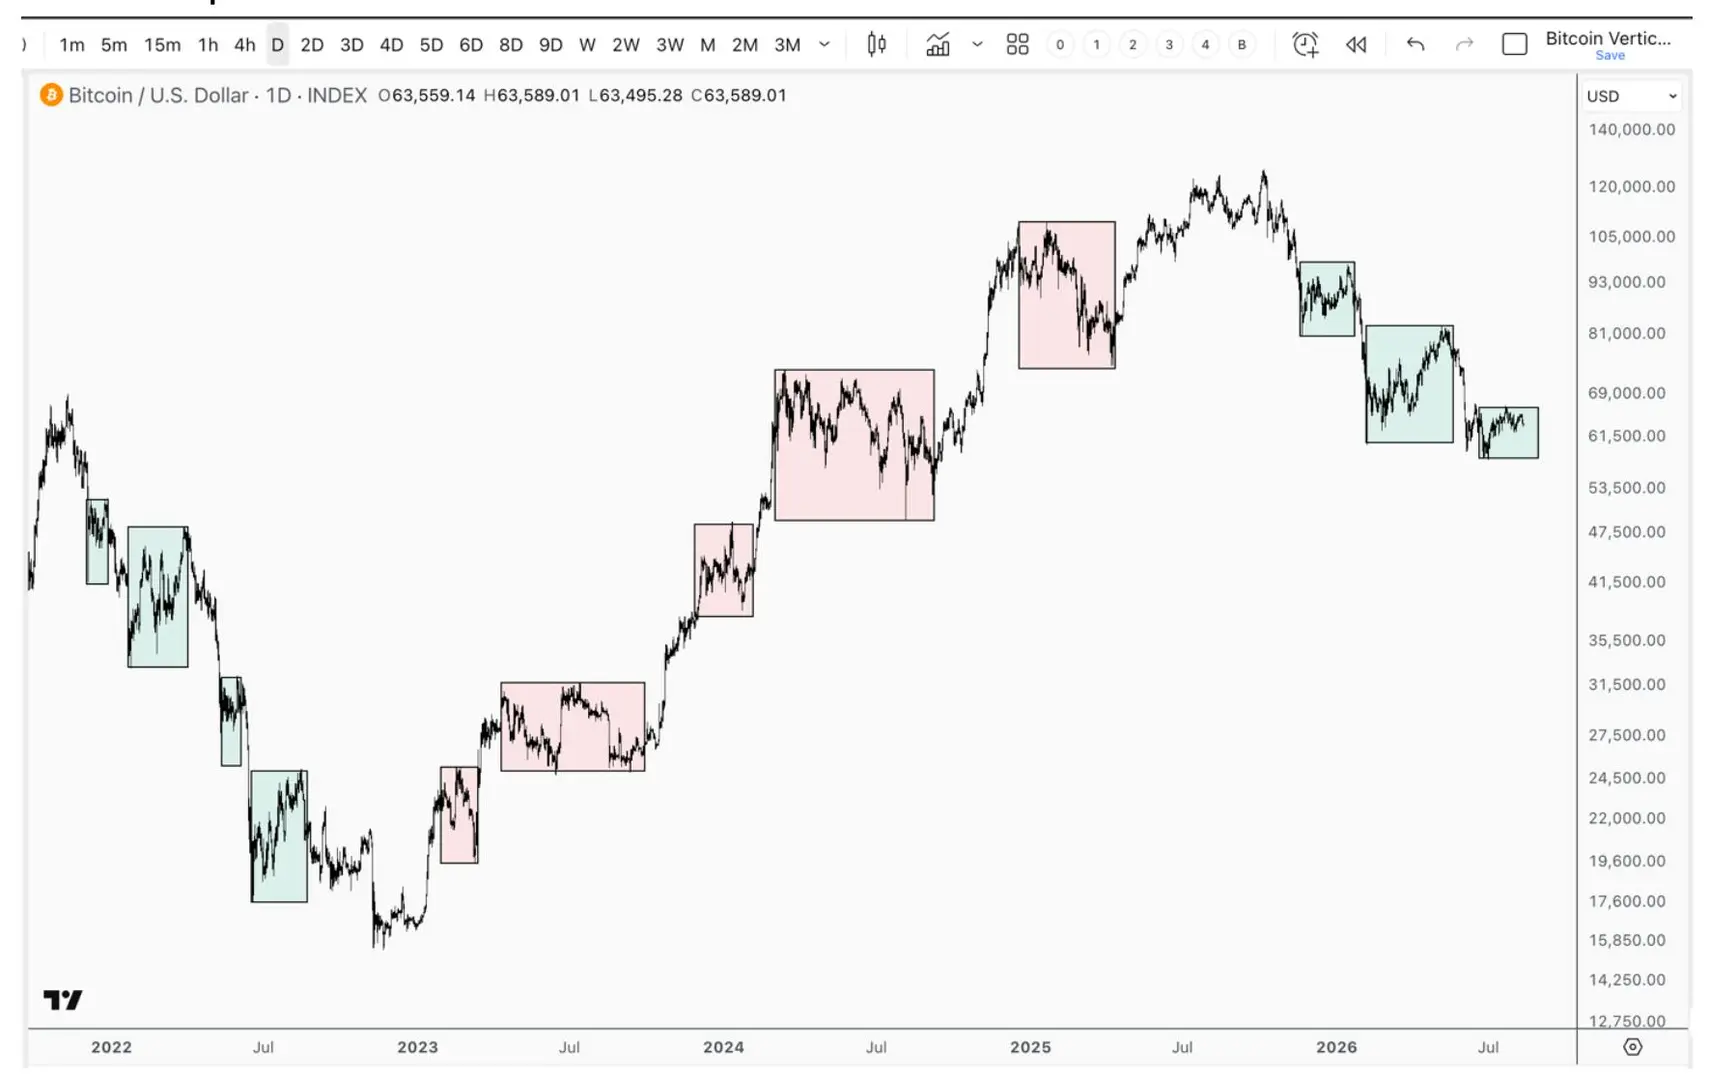
This is backed by the basic pattern analysis that typically defines a trend. From an aerial view, when defining a trend, the easiest way to do this is to look for the direction of the vertical moves, which tend to be punctuated with overlapping/messy corrections within that larger, dominant trend.
The chart below maps the dominant trends since the 2021 top. Note how the last bear cycle in 2022 had numerous vertical drops. The green boxes mark the messy/overlapping bounces that paused the decline. Then the dominant trend changed in late 2022, as price started making vertical climbs. The overlapping corrections shifted to down moves within this new uptrend.
The chart maps Bitcoin’s major price swings from 2022 through 2026, using shaded boxes to highlight consolidation periods between strong directional moves. The pattern shows the transition from the 2022 bear market into a sustained uptrend, followed by a reversal in 2025 as downside moves began to dominate. The current price structure resembles prior bear market behavior, with rallies occurring within a broader downward trend.
We have clearly reversed this pattern, which is now resembling what we saw in 2022. So far, there have been three vertical drops since the October 2025 top, and we are now in our 3rd messy/overlapping bounce.
There has been a clear shift in the dominant trend, which is being confirmed by simple trend analysis and volume analysis, and until these signals shift, we remain cautious of any bounces.
Two Paths for Bitcoin, but Both Point to More Volatility Ahead
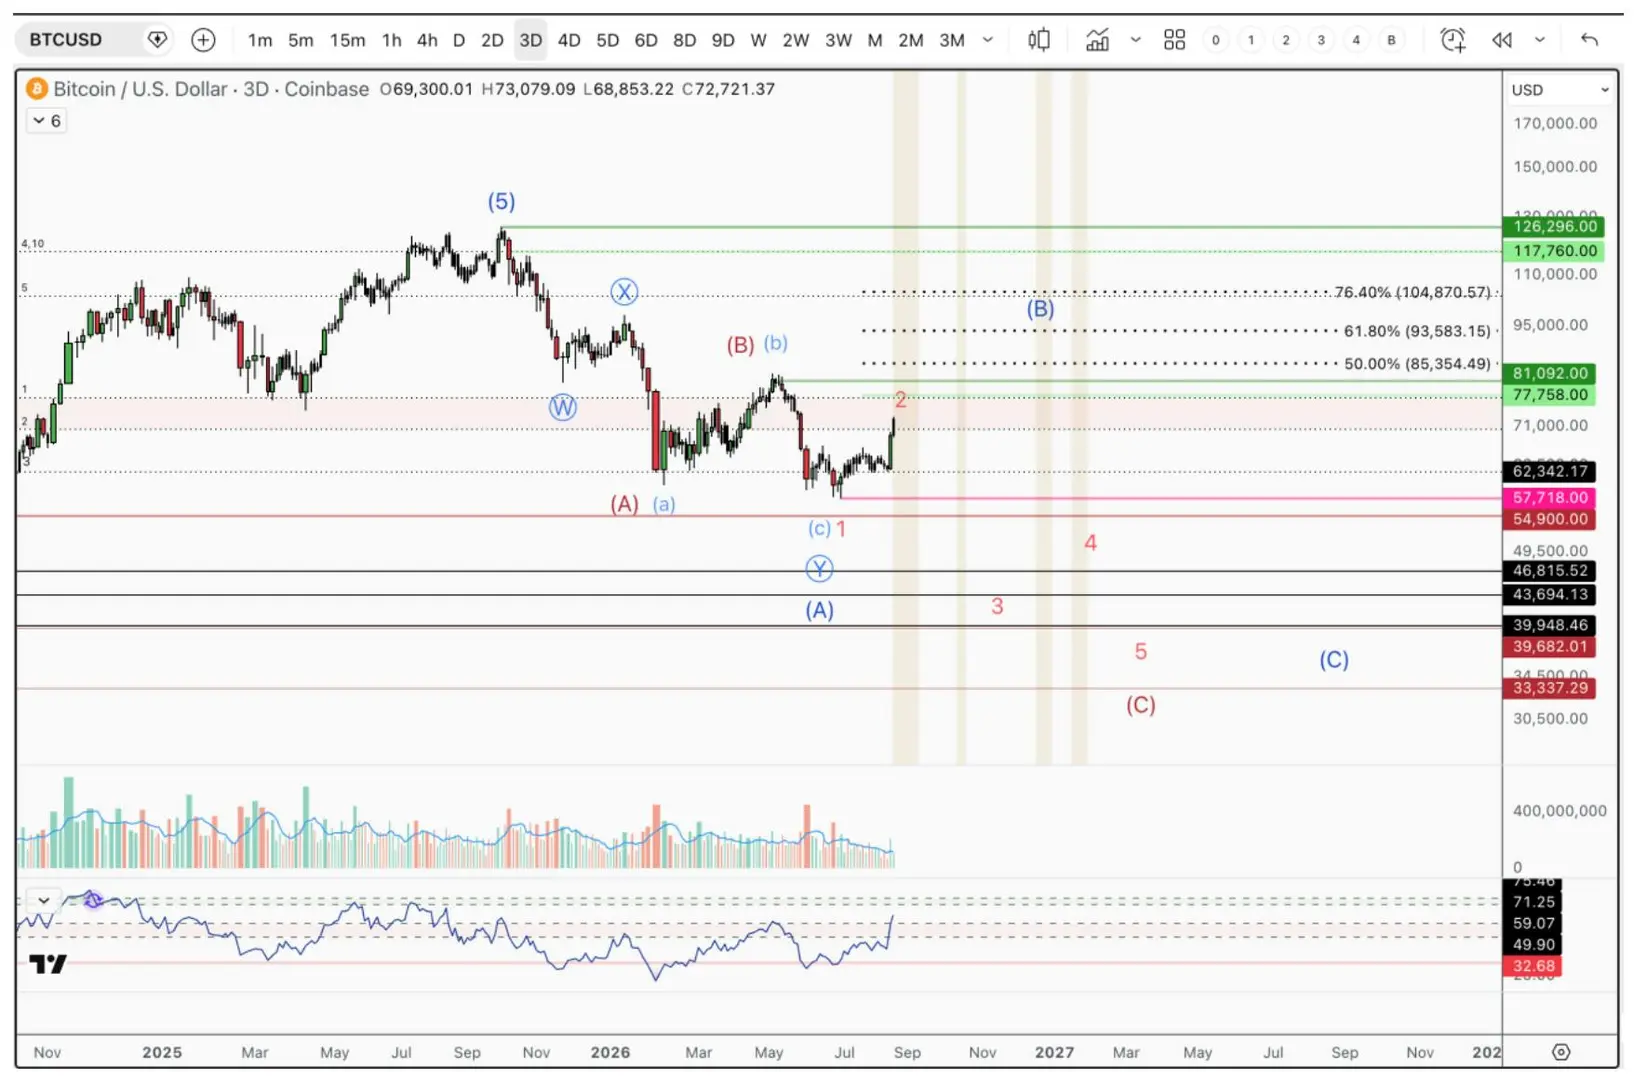
If we look closer at the current price information, there are two likely paths that I am tracking; both also suggest lower levels before we see a meaningful low.
Red – The February bounce was a B wave bounce within a larger decline. Since topping in May, it is difficult to ignore the drop to the form of a 5-wave pattern, which has now been followed by a 3-wave bounce. If the next drop breaks through $54,900 with force, with volume and momentum expanding, it will support a more dramatic drop toward the $30,000 region. This would likely conclude the bear cycle that started in October of 2025.
Blue – We have put in a low, which is giving way to a large bounce. We will break over $77,758 – $81,092, and target $90,000 – $107,000 region, which will likely be a lower high within an on-going bear cycle. If the current bounce can move past $77,757, then we will likely be in the larger B wave without having to make one more low.
The chart outlines two possible paths for Bitcoin following the 2025 peak using Elliott Wave analysis. One scenario suggests a final decline toward the $30,000 region if support near $54,900 breaks, while the alternative anticipates a tradable low followed by a rebound toward higher resistance levels. Key support, resistance, and Fibonacci retracement zones are highlighted to identify potential turning points in the current bear market.
After Bitcoin’s Bear Cycle
Since October 2024, we have been warning our free subscribers that Bitcoin’s bull cycle was nearing an end. We followed that with four additional free articles leading into the October top, each expressing growing caution and a more defensive posture.
After more than two years of caution on Bitcoin, it would be easy to conclude that we are perma-bears. This is inaccurate.
We aggressively participated in both the 2020 bull cycle and the most recent cycle. More importantly, our long-term outlook for Bitcoin is arguably more bullish than most analysts in the space.
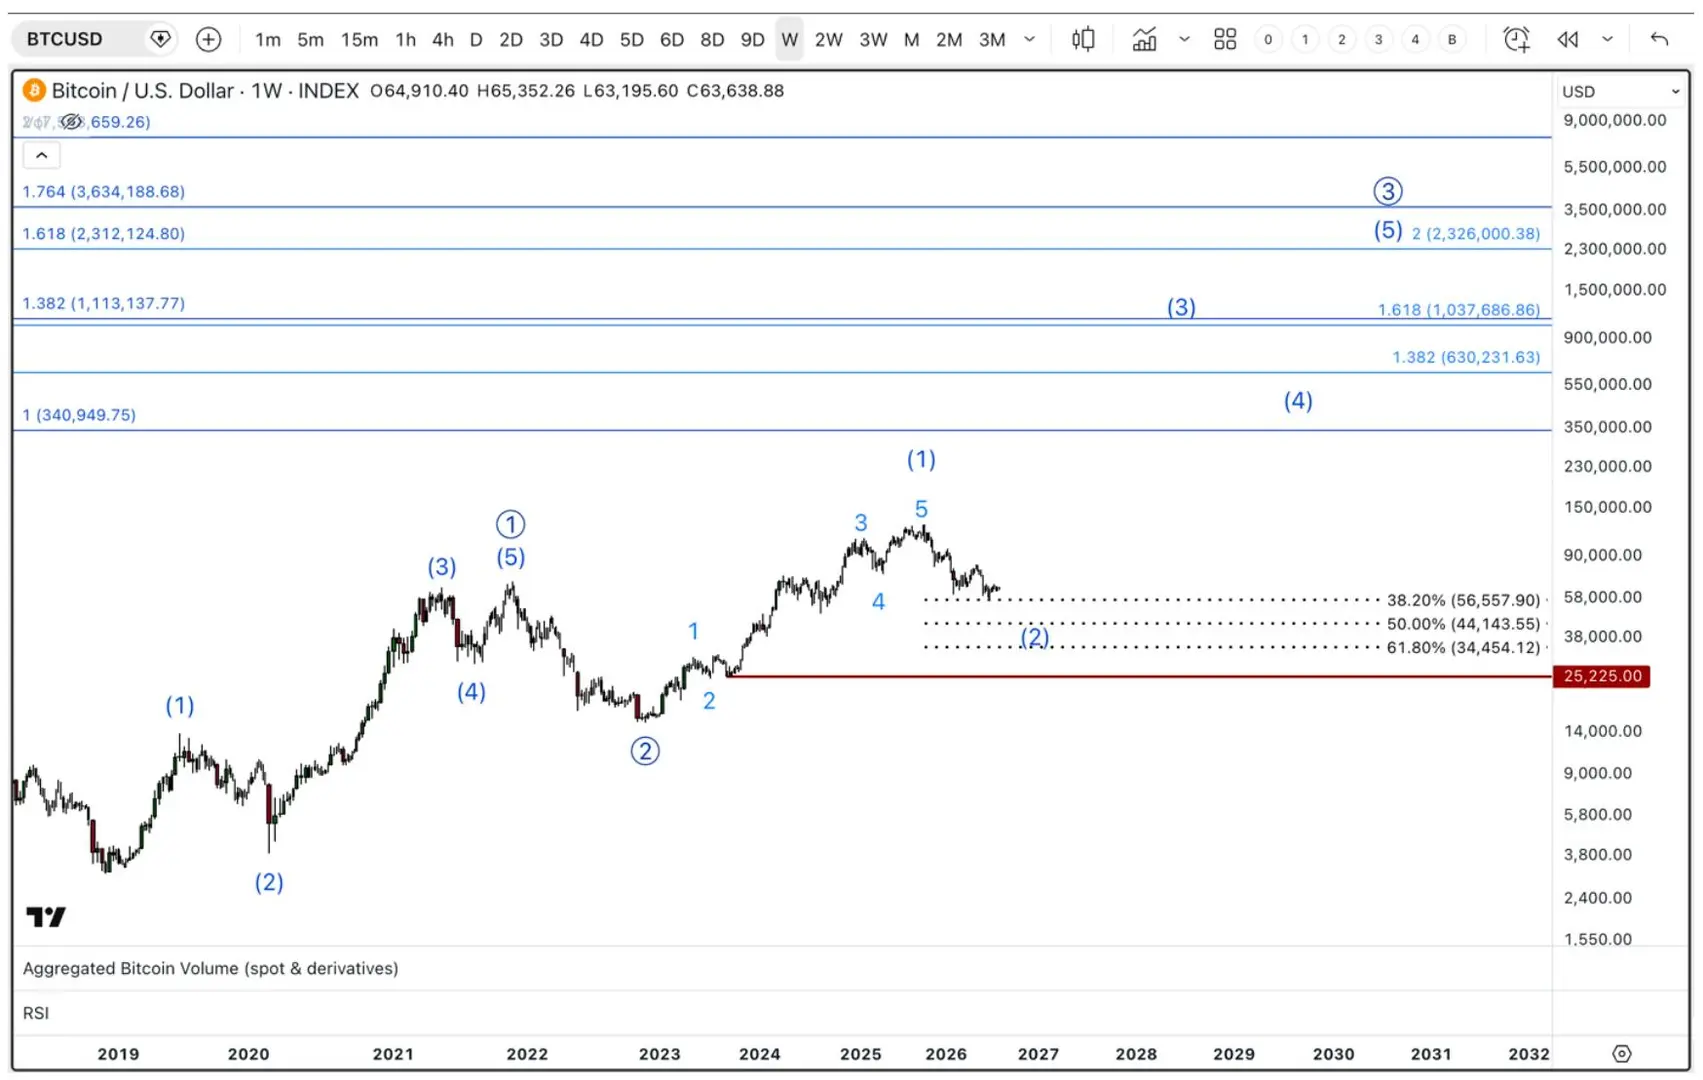
Using strictly technical analysis—a tool that has consistently helped us stay on the right side of Bitcoin’s major cycles since 2020—we believe the end of the current bear cycle could set up an exceptionally powerful move higher. Our long-term technical roadmap points to Bitcoin eventually trading above $2 million.
As long as the current bear cycle holds above $25,255, the long-term setup below remains intact and is what we will likely position for through our premium service.
The chart presents a long-term Bitcoin Elliott Wave roadmap from 2019 onward, highlighting major cycle waves, key Fibonacci retracement levels, and projected upside targets. As long as Bitcoin remains above the $25,255 support level, the broader bullish structure remains intact, with the analysis suggesting the potential for future advances toward the $1 million to $2 million-plus range over the coming market cycles.
This begs the question: what type of macro backdrop could support a move in Bitcoin above $2 million?
The answer becomes clearer when we step back and consider Bitcoin’s original purpose. Bitcoin was designed as decentralized money—a peer-to-peer payment system that could operate without a centralized financial institution. Like gold, its value relies on a widely shared social consensus and monetary premium. Only Bitcoin and metals have achieved this rare feat across human history. This belief is then reinforced by a strict supply cap that cannot be manipulated by a centralized power; therefore, it is immune from inflation. Bitcoin’s ability to generally function as gold, without the storage, custody, or geographical constraints, makes it a uniquely compelling store of value in a world carrying 236% total Debt/GDP.
Get Our Free Weekly Stock Newsletter
Get weekly stock insights, market analysis, and technology updates straight to your inbox.
Weekly stock insights
Market analysis
Technology updates
The Debt Problem That Could Reshape Global Markets
The numbers are sobering. The U.S. alone sits at 121% Debt/GDP, with 31% of all tax receipts now consumed by debt service alone. For the first time in recorded history, America spends more servicing its debt than funding its military.
What makes this more alarming is that there is no relief in sight. The U.S. is projected to run a 5.8% of GDP deficit this year, averaging 6.1% over the next decade. Historically, when governments are in this position, they only have three options:
The first option is to grow GDP faster than debt. With debt expanding at roughly 6% annually, we would need to sustain that pace of nominal growth, which is challenging for a mature economy to sustain for an extended period.
More importantly, we happen to be in a period where nominal growth in the US is outpacing debt growth. Headline nominal GDP is currently expanding at an annualized rate of nearly 8%. Even if we strip out government spending and exports, the US economy is expanding at 5.5% – 6%, which is more than double its 10-year average. However, not even exceptional growth, which is trending well above average GDP growth over a 10-year period, is leading to fiscal retrenchment. Instead, deficits are growing with the economy!
This leaves us with two options:
(2) They can raise taxes. However, closing a $1.9 trillion deficit gap through taxation alone would require a 34% increase in tax receipts, a figure that would almost certainly cross the threshold of diminishing returns and slow the very growth needed to service the debt. That leaves the third option, and the one most governments with reserve currency status have chosen throughout history without fail.
(3) Print money to cover the bills and pass the cost to citizens through inflation. The bill is always paid, just not in the way most people recognize it.
This is where Bitcoin becomes not merely interesting, but structurally important. Unlike the U.S. dollar, which must expand by roughly 6% annually just to cover the deficit, Bitcoin cannot be inflated. Its supply is relatively fixed, and its scarcity is absolute. More importantly, it is increasingly recognized, regardless of whether one agrees with it, as a store of value that crosses borders and transfers directly between parties without intermediaries or the permission of any government.
In a world where more currency must be created to fund ever-growing government spending, and where the political will to stop does not exist, an asset that is widely considered valuable and remains largely fixed in supply becomes, by definition, more valuable over time. This is not a narrative, but simple arithmetic.
What the Dollar, Treasuries, and Gold Are Telling Us Now
In this macro environment we would see a secular devaluation of the U.S. dollar more base units are created to fund ever growing deficits. At the same time, U.S. sovereign bonds would get sold, pushing yields higher; bond buyers will demand a higher term premium to offset the persistent inflation risk inherent in printing more currency to service expanding debt obligations. Interestingly, the long-term charts in the dollar and treasuries are aligned with this narrative.
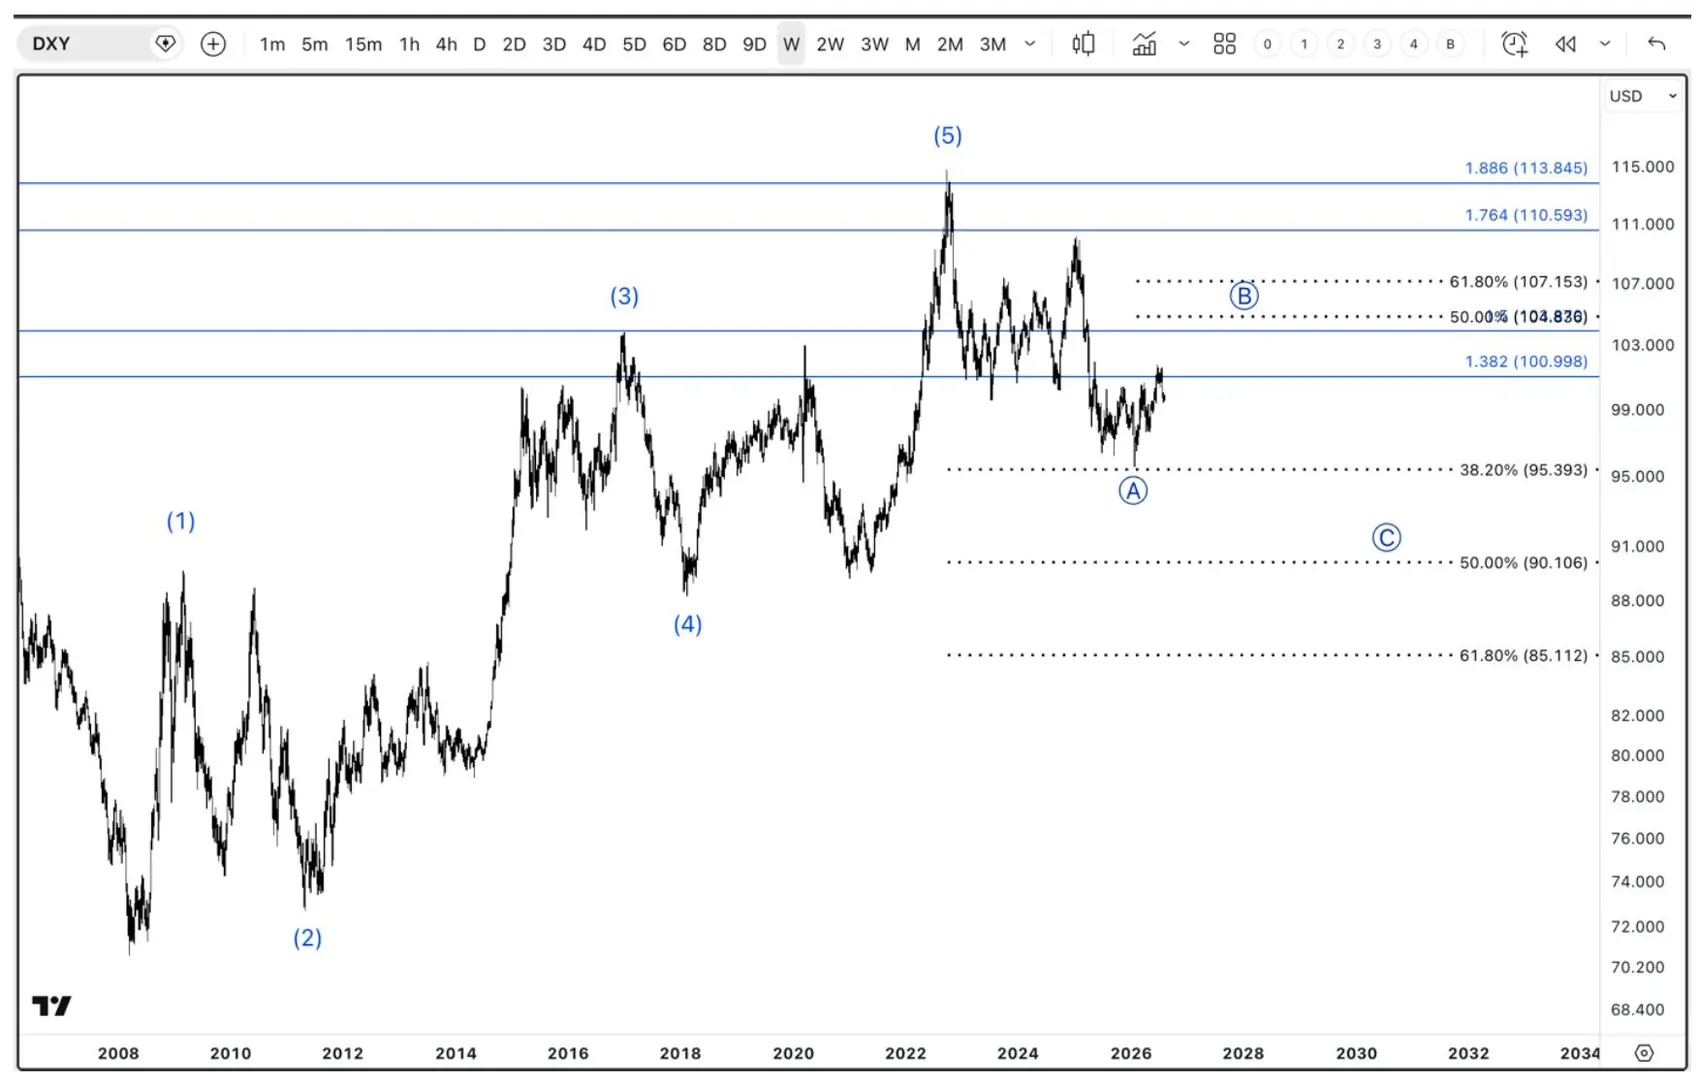
The U.S. dollar, as defined by the Dollar Index (DXY), suggests that a large 5 wave pattern that started in 2009 came to an end in 2022. While the decline will not be in a straight line, the long-term trend appears to have shifted, suggesting years of dollar weakness on the horizon.
The chart tracks the U.S. Dollar Index (DXY) from 2007 through projected future cycles, highlighting Elliott Wave patterns and key Fibonacci retracement levels. The analysis suggests the dollar may have completed a major long-term advance in 2022 and could enter a multi-year corrective phase, with potential downside targets in the 90 to 85 range. This outlook supports the broader thesis of dollar weakness and its implications for scarce assets such as Bitcoin and gold.
Treasury Markets Are Facing a Supply Shock
Over the next twelve months, the U.S. Treasury must finance roughly $12 trillion (approximately $37,000 per U.S. citizen). To put this figure in perspective, it equals 210%–230% of total U.S. personal savings and roughly 42% of all global savings. This wall of sovereign supply arrives at the exact moment structural demand is shrinking – driven by a shift in foreign central bank policies and unprecedented competition from the corporate bond market due to AI.
How this supply/demand shift in Treasuries relates to the fixed supply of Bitcoin is that the higher yields go on US sovereign debt; the larger the deficits must grow to fund higher funding costs. This creates a feedback loop, which pushes yields higher due to on-going dollar debasement and inflation concerns.
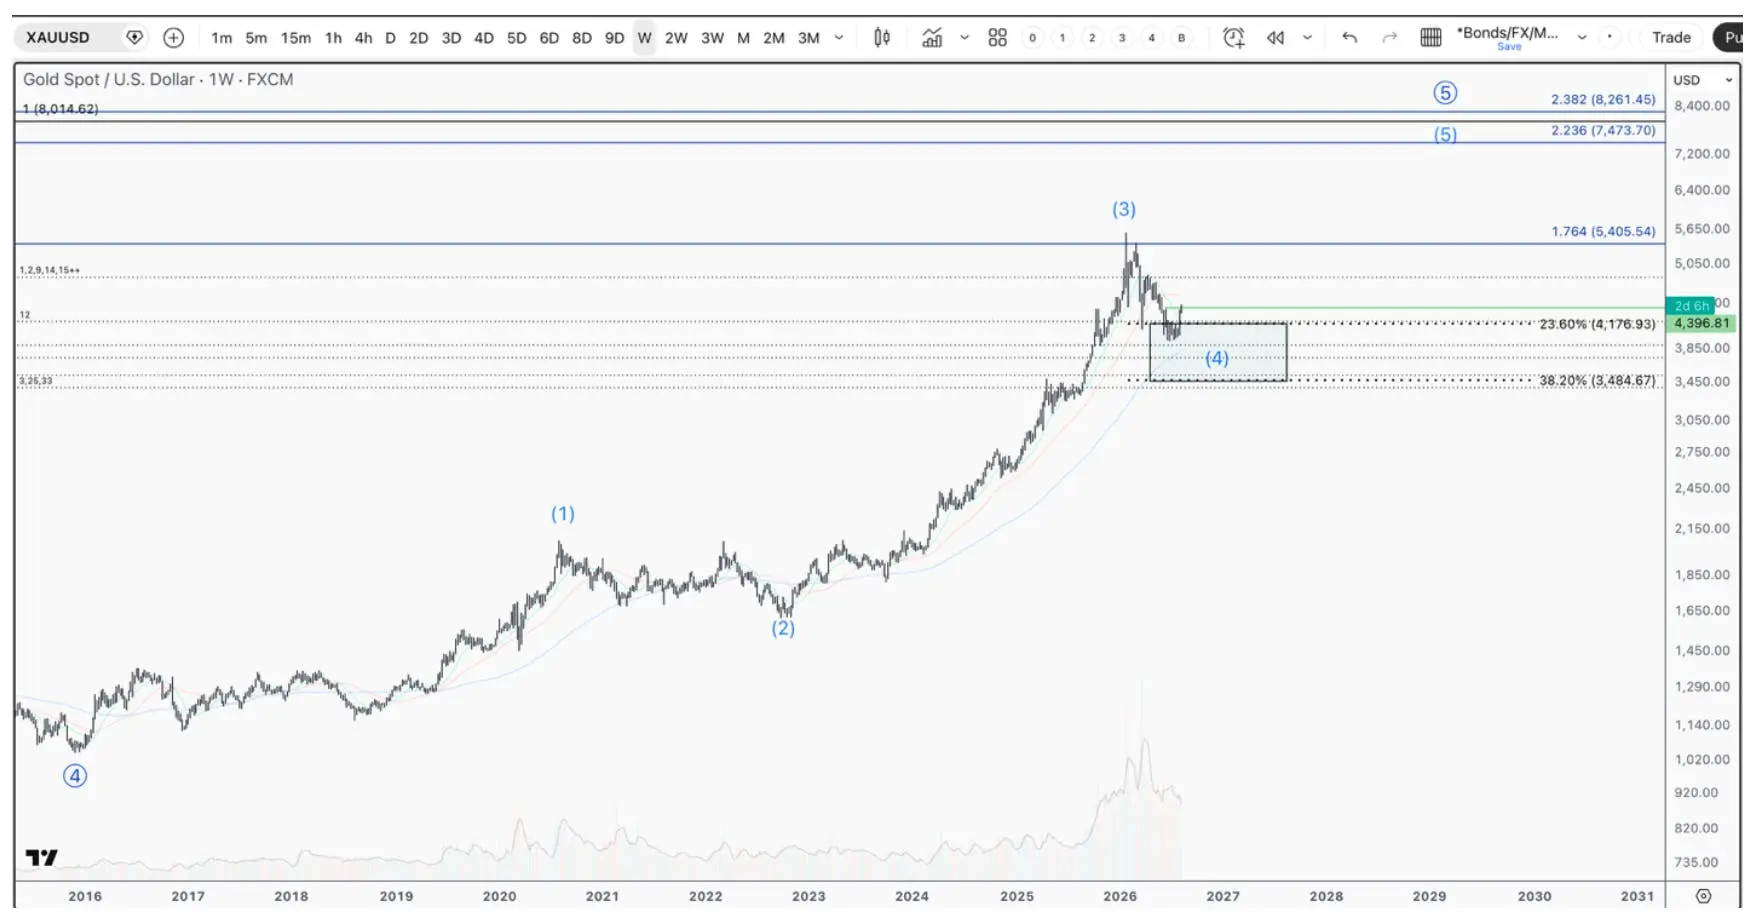
This structural shift in debt dynamics is further backed up by gold’s long-term uptrend, which eerily resembles the trend in Bitcoin that was presented in this report.
The chart tracks gold prices (XAU/USD) from 2015 through projected future cycles, highlighting Elliott Wave formations and key Fibonacci levels. Following a strong advance into 2026, gold appears to be consolidating within a corrective phase while maintaining its broader uptrend. The long-term structure suggests the potential for higher prices in future cycles, reinforcing the case for scarce assets in an environment of persistent debt growth, inflation concerns, and currency debasement.
Conclusion: Bitcoin’s Next Bull Market Could Be Its Biggest Yet
Few analysts have the track record with Bitcoin that we do, and this is visible through out two major bull cycles in Bitcoin, which has been proven at 4 major inflection points going back to 2019. For those newer to the I/O Fund, here is an overview of what you missed:
In 2019, we published a premium report that outlined Bitcoin’s path to $100,000. At the time it was trading around $7000.
In early 2021, we announced that Bitcoin was topping out. We reduced our exposure to crypto, locking in exceptional gains in our premium service.
Since December 2022, when Bitcoin was trading around $16,000, we went against the crowd at the time and called for the start of a new bull cycle. In the months that followed, we published seven additional pieces reaffirming Bitcoin as a buy, and we issued 9 buy alerts to premium members at key points from roughly $25,000 up through $60,000.
At the height of Bitcoin’s narrative hype, in October 2024, we issued 4 sell alerts in our premium service when Bitcoin was trading between $95,000 – $113,000, closing out ~90% of our total position, just before the October top.
All of this was backed by real-time trade alerts sent to our research members.
Today, the same team thinks Bitcoin will go lower in this bear cycle, setting up a buying opportunity that rarely comes around in capital markets. As long as the current bear cycle holds above $25,255, the long-term setup below remains intact and is what we will likely position for through our premium service.
We further think that the long-term outlook in Bitcoin exceeds the most optimistic outlook, pointing to $2,000,000. It won’t happen in a straight line, but our research members will get each entry, exit and inflection point along the way, just as they did in the last Bitcoin bull market.
Join I/O Fund Portfolio Manager Knox Ridley this Thursday at 4 p.m.Eastern as he discusses the portfolio’s latest entries and exits, along with his detailed Bitcoin game plan.
The I/O Fund has consistently outperformedhedge funds, tech ETFs and competing portfolios, with a 326% five-year cumulative return—and that does not yet include the I/O Fund’s 2026 outperformance. This year alone, the portfolio has 16 stocks outperforming the Nasdaq-100, including 6 stocks up more than 100% YTD.
Don’t Navigate the Volatility on Your Own.Subscribe Now.
Please note: The I/O Fund conducts research and draws conclusions for the Fund’s positions. We then share that information with our readers. This is not a guarantee of a stock’s performance. Please consult your personal financial advisor before buying any stock in the companies mentioned in this analysis.