Bitcoin is Going to Rally Again – Here’s What You Need to Know
December 09, 2022

Knox Ridley
Portfolio Manager

Bitcoin is the best performing asset of our lifetime. Given the history of Bitcoin’s awe-inspiring returns shown below, the single most important question for every investor in the market today is if this gravity-defying asset can do it again.
The Bears want you to focus on the -77% bear market, as they have for all of the four major drawdown Bitcoin has experienced. You will not hear one Bitcoin Bear admit the truth, which is that Bitcoin has smashed every single performance record in equities within 15 brief years.

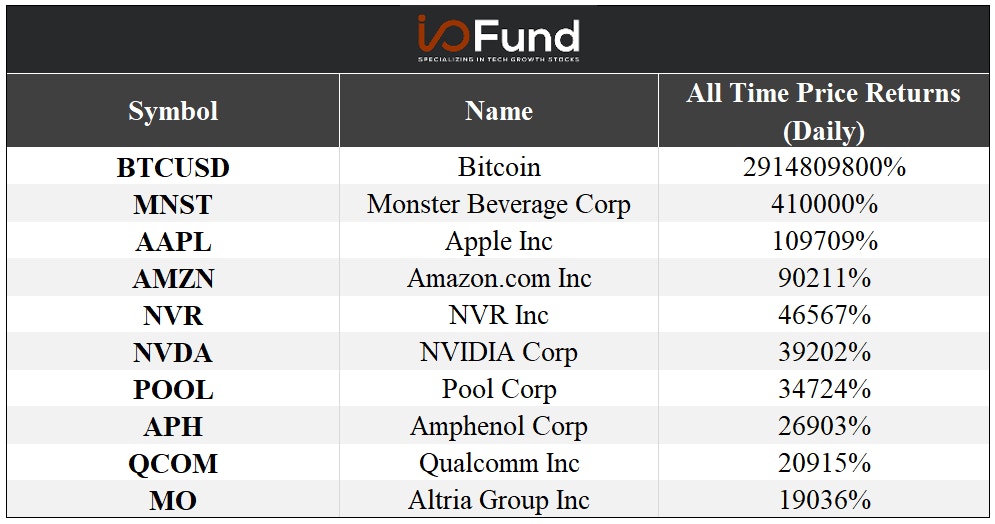
Source: YCharts
Yet, there is key evidence that shows how Bitcoin is stronger today than it was during the previous three drawdowns. The reason you don’t want to ignore this is because – despite steep +80% selloffs -- Bitcoin has reclaimed new highs within 3.5 years, every time. Therefore, it’s not only the size of gains Bitcoin has provided which places it as the #1 asset of all-time yet it’s the speed in which this is accomplished that is also remarkable.
I want my readers to be armed with facts – not emotion – and what I’m presenting below is the culmination of a history of accurate calls that I’ve made in the past on Bitcoin plus new quant-level information presented by Vincent Duchaine of Wealth Umbrella, who has created an automated buy/sell signal in Bitcoin using on-chain metrics.

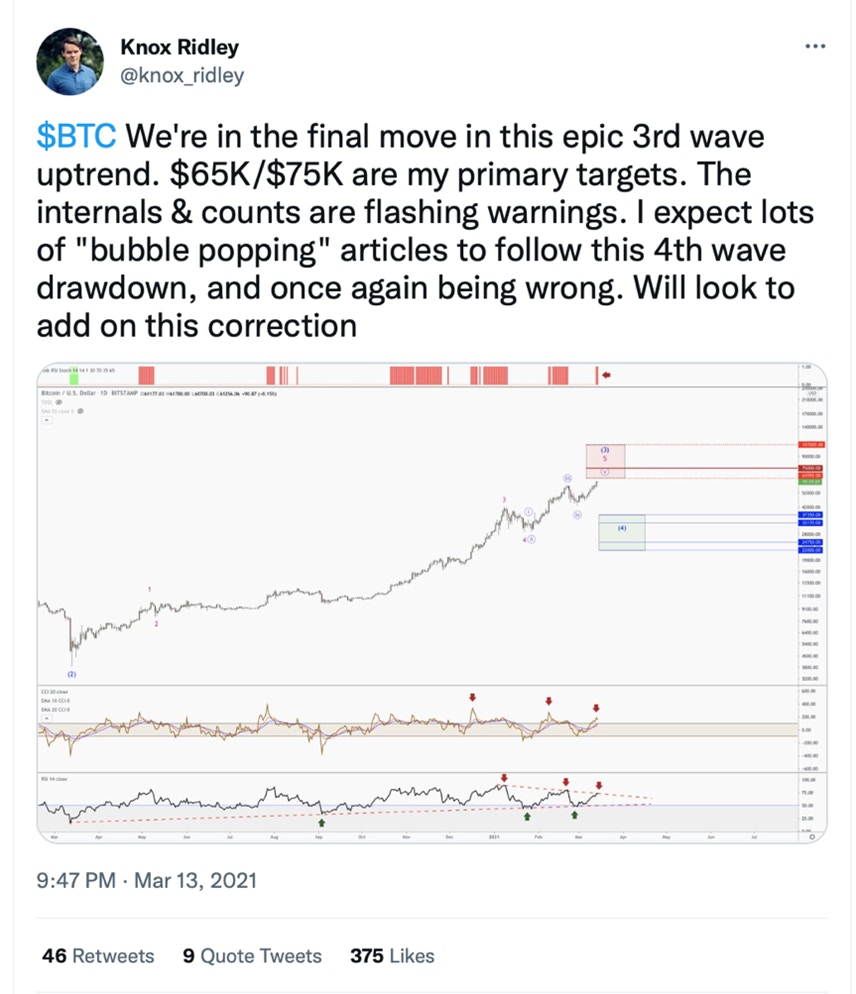
Source: Twitter
Quick Note on the Crypto Panic
Below is an illustration of the history of how quickly Bitcoin has reclaimed its all-time high in the previous drawdowns.

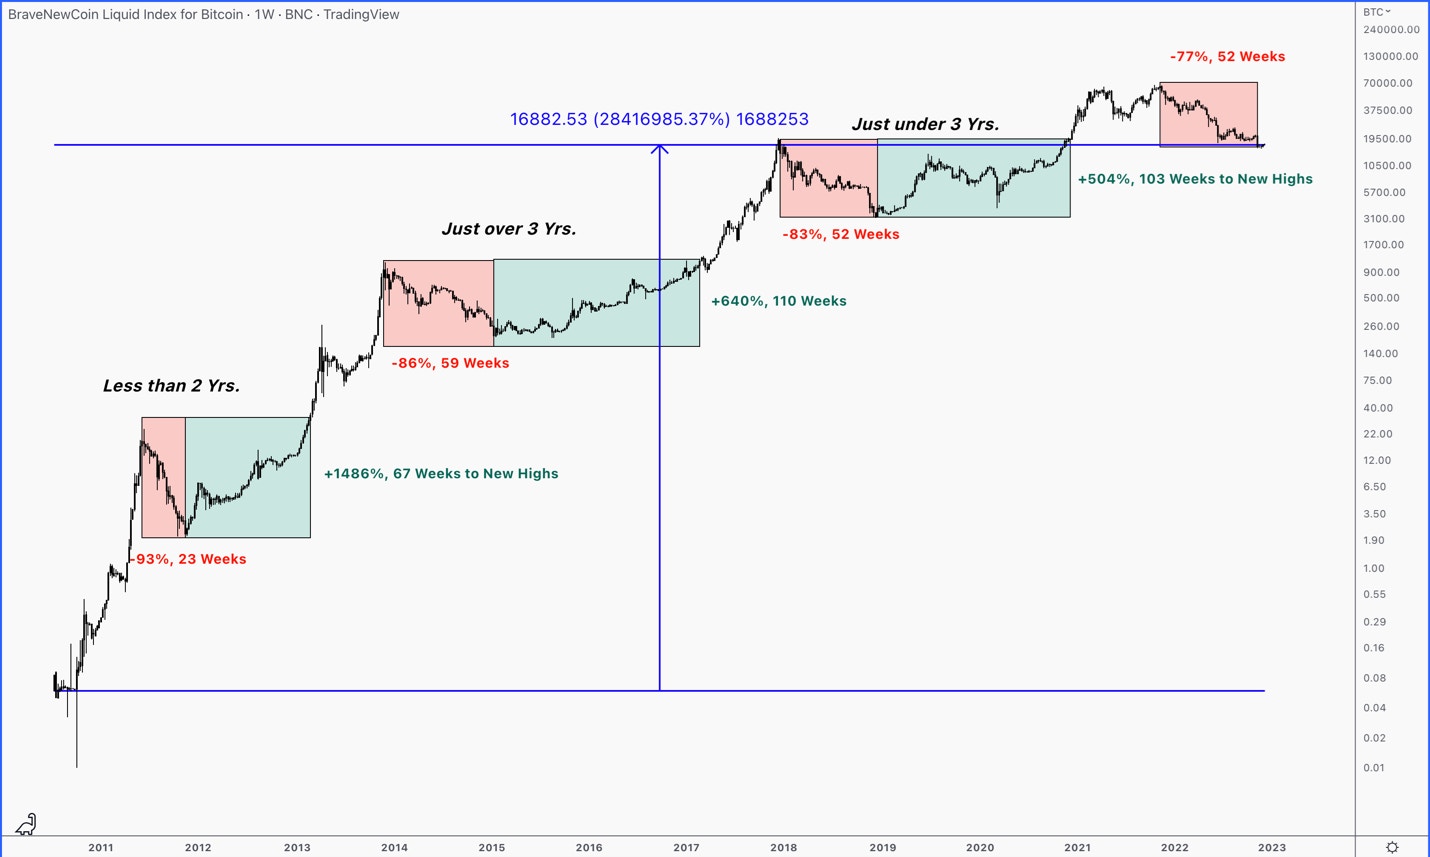
The average time period for Bitcoin to reclaim its all-time high is between two to three years, with 3.5 years being the maximum amount of time. The chart shows the max drawdown for each bear cycle in red, followed by the recovery in green.
Keep in mind, that in order to break even after an 80% drop, it requires a stock or asset to go up 400% just to break even. Qulacomm, for example, suffered a similar drawdown in the dot.com bust. It took about 20 years for QCOM to regain its 2000 high. Cisco, another darling of the late 90s, has never recovered its 2000 peak.
This asset came to market during the Great Financial Crisis, and unlike most tech companies on the market today, not only has survived an economic recession, but was, in fact, found traction in 2009 during a time when tech was faltering to withstand macro pressures.
On January 3rd, 2009, the bitcoin network was created when Satoshi Nakamoto mined the starting block of the Bitcoin chain. Within the coinbase of this first block was the text "The Times 03/Jan/2009 Chancellor on brink of second bailout for banks". This note references a headline published by The Times and has been interpreted as both a timestamp and a commentary on the instability caused by fractional reserve banking systems. Bitcoin quietly set out to disrupt the centralized banking system, prior to which was inconceivable, at a time that was arguably more uncertain than what we face today.
One reason for this is because Bitcoin has successfully accomplished becoming a global store of value – a feat only a handful of currencies/commodities have accomplished. Many have argued against this claim based on bitcoin’s volatility. Those that make this claim fail to see that the two most popular stores of value – the US Dollar and Gold – have terrible track records.
Sign up for I/O Fund's free newsletter with gains of up to 221% - Click here
In 2022, gold topped with a ~45% drawdown. It took gold nearly 10 years to reclaim this high, which it was unable to hold. As of today, gold is about 8% below its 2011 high. The US Dollar, arguably, is the worst store of value. Since 1913 it has lost 97% of its purchasing power. Bitcoin, on the other hand, is up over 28 million percent since it first started trading in 2010, and has recovered from its bear cycles in a relatively short amount of time. It’s no wonder that citizens of emerging markets – who face extreme inflation --- love this store of value.
This specific utility in Bitcoin is further backed when we correlate crypto adoption to a specific county’s level of corruption and/or monetary instability. For example, some of the counties with the highest crypto adoption are Ukraine, Russia, Argentina, Turkey, Brazil, just to name a few.
To these people, Bitcoin offers a secure and efficient exit from the inflationary turmoil and centralized manipulation of their personal earnings. In essence, the lofty goal Satoshi Nakamoto established in the October 2008 white paper, which was to offer an exit from the fiat system, has manifested today in real-time.
Bitcoin’s Upcoming Rally – What You Need to Know
Bitcoin has no earnings reports, management overhauls, or supply chain disruptions that can affect its price. Anytime humans come together in a codified arena and begin trading an asset with their instinct for security as the primary driver, patterns develop across price history. Therefore, in order to determine what Bitcoin does next, we must measure sentiment.
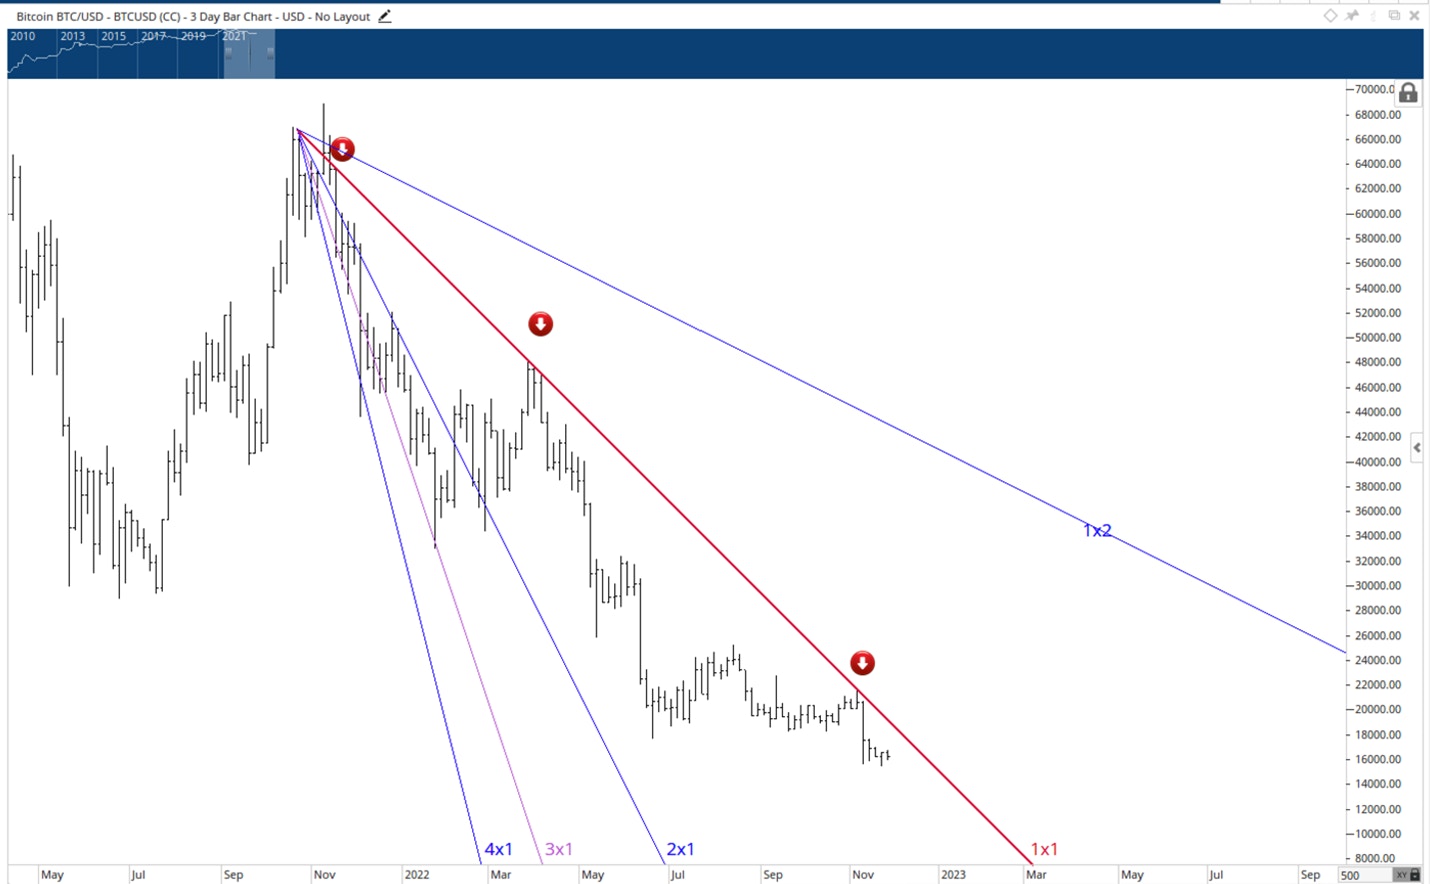
One of the simplest patterns to measure is that an uptrend moves in 5 waves up, then corrects in a 3 waves pattern down. Once we get 5 waves up and 3 down, we then repeat this pattern in a fractal manner. As of now, since the 2018 low, we only have 4 waves in place, which implies that we have one more 5th wave push before the larger bull cycle is over.

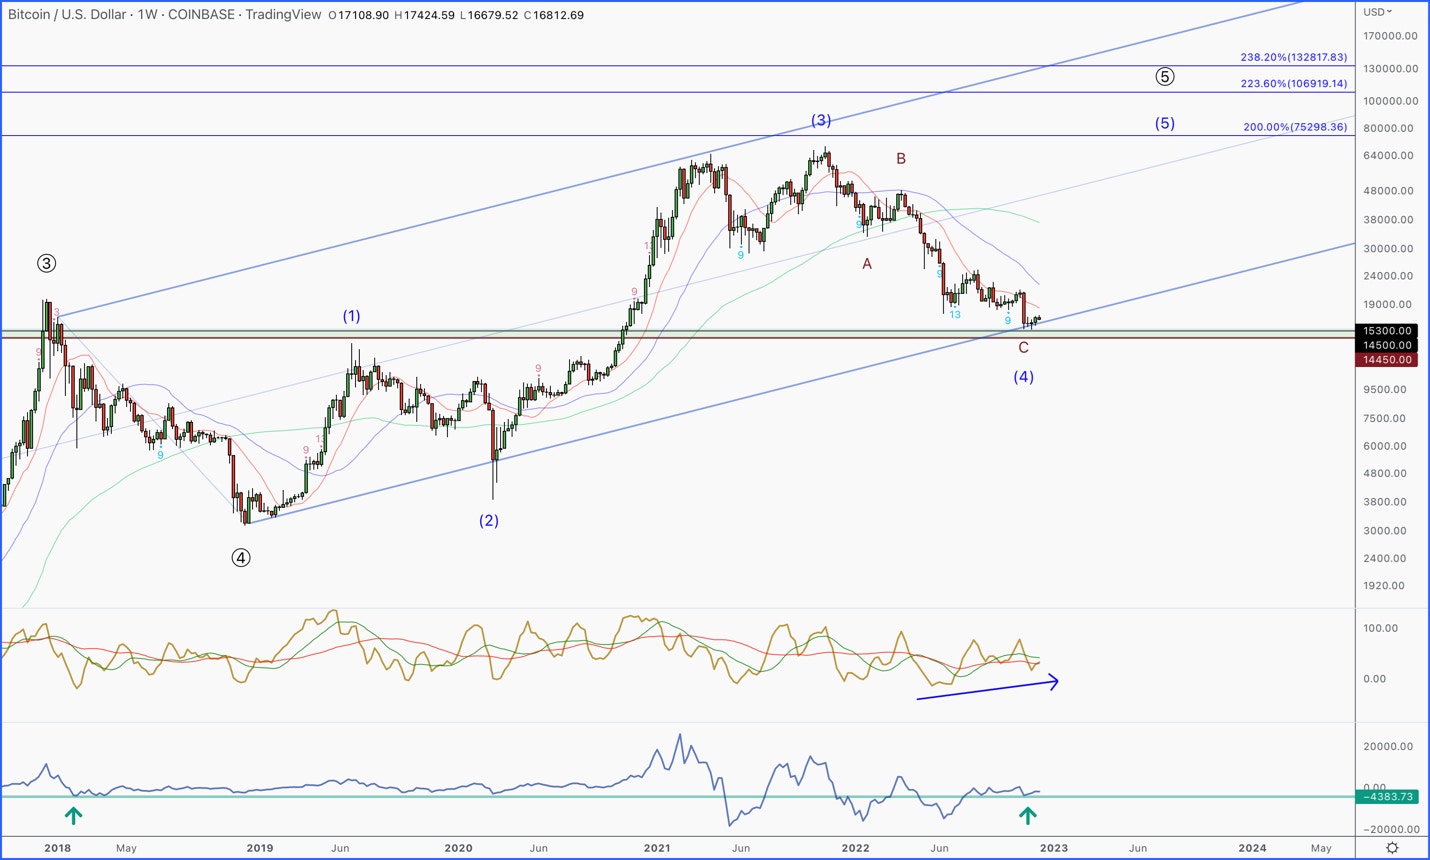
A few points I want to make about the above chart. We have from the 2021 top a very complete and filled out corrective pattern. Recently, Bitcoin pushed lower on the FTX scandal, which has now provided us with the first bullish divergence on a weekly chart since the 2021 bear market began. This is when price goes lower with less momentum. This tends to mark the near end of large drawdowns.
Another one of my favorite patterns can be found in the detrend oscillator below. This is simply measuring the difference between two moving averages, and when set to a seven-year period, it tends to provide very interesting signals. Most importantly, the oscillator is currently finding support at the 2018 low and the oscillator is now building a new uptrend. When a new uptrend is building, this oscillator will tend to build this new uptrend on prior crash lows, which is playing out now.
Note: Knox Ridley is holding a weekly market webinar on Thursday, December 15th at 2:30 p.m. Eastern for I/O Fund Members to go over a detailed buy plan for Bitcoin, plus how he hedges Bitcoin when needed. Sign up today.
The chart below shows a general early warning sign of when the trend is changing. The red line going down the chart is a 45 degree angle, and has stopped each attempt of a recovery since 2021. Once we reclaim this angle, it will mark an early and meaningful change in trend. As of now, that level is around $18,100.

On-Chain Analysis
This conclusion is further backed up by on-chain analysis, which is a field of study that ignores price action, and instead looks at the fundamentals, utility, and transaction activity of cryptocurrency and blockchain data.
Dr. Vincent Duchaine of Wealth Umbrella is an A.I. and Machine Learning engineer. His team spent several months analyzing on-chain metrics within the Bitcoin ecosystem to create an automated risk-on/risk-off signal for retail investors. Vincent stated that most of the on-chain metrics his team analyzed point towards Bitcoin forming a major bottom.
Sign up for I/O Fund's free newsletter with gains of up to 221% - Click here
The level of most metrics is such that we could have already seen it at $15.5k, while other metrics suggest that we could see the price drop down to $13.2K in a final spike down.
Here are some examples of on-chain metrics from Wealth Umbrella that are providing rare signals that have only been seen around major lows:
Shown below, the supply of bitcoin hasn’t moved in more than a year and was barely affected by the FTX scandal. Even after the recent drop, the supply of Bitcoin hovers at a near record high of around 67%, and again, this level hasn’t moved in more than a year

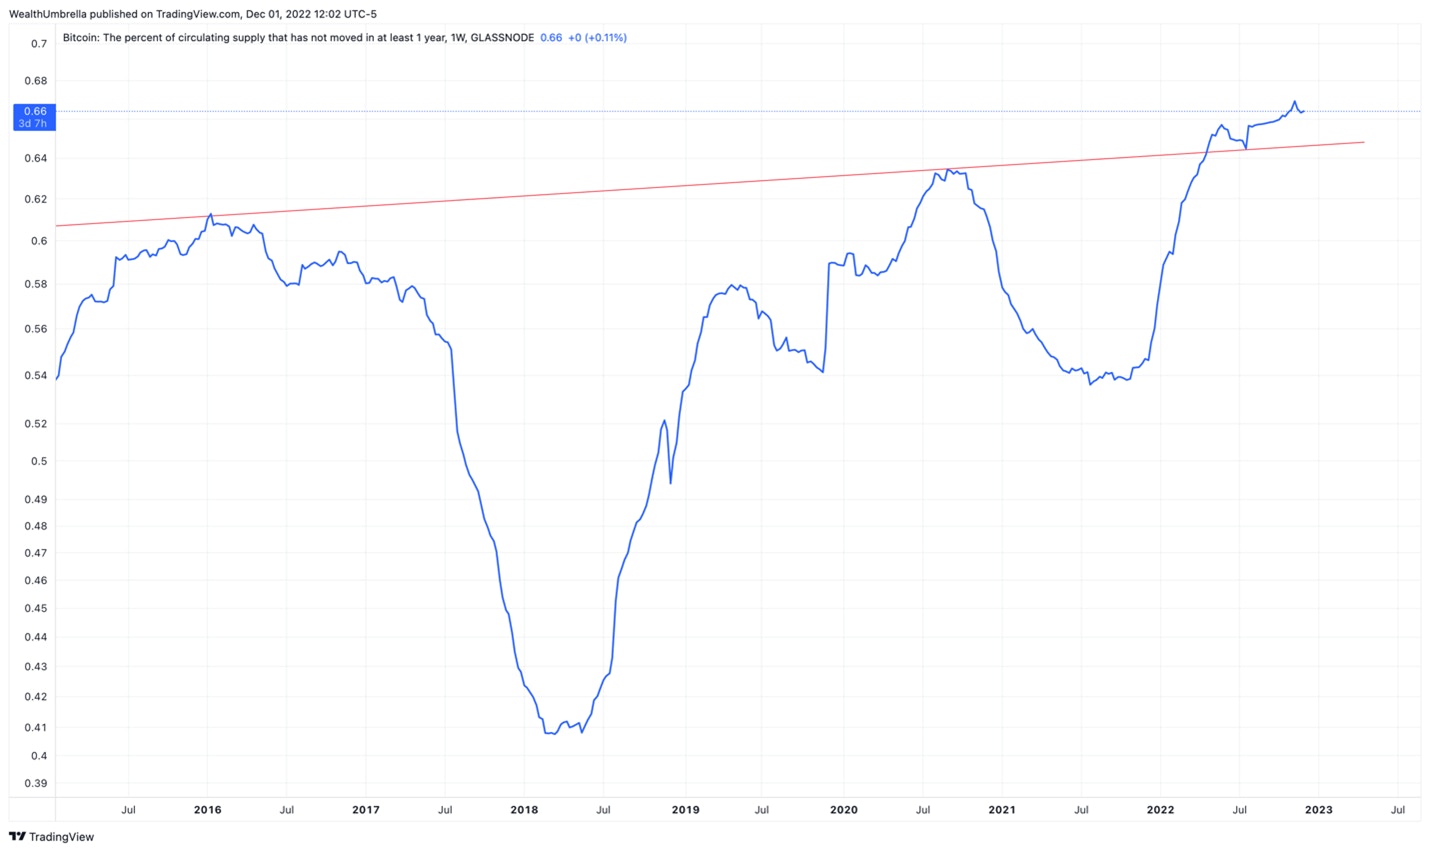
Previous major events, such as the Mt Gox debacle in February 2014, or the price collapse in November 2018, saw a retracement in the range of 2-3% on this metric. Meanwhile, the FTX scare only reduced this value by 0.81%. Ultimately, what this is telling us is that fewer market participants are now willing to sell their Bitcoin, which historically has put a floor under Bitcoin.
The recent low also was accompanied by a new considerable spike of outflows from exchanges. Despite a lower low on the price, this indicator didn’t make a new high, which shows that less and less people are now willing to sell their Bitcoin.
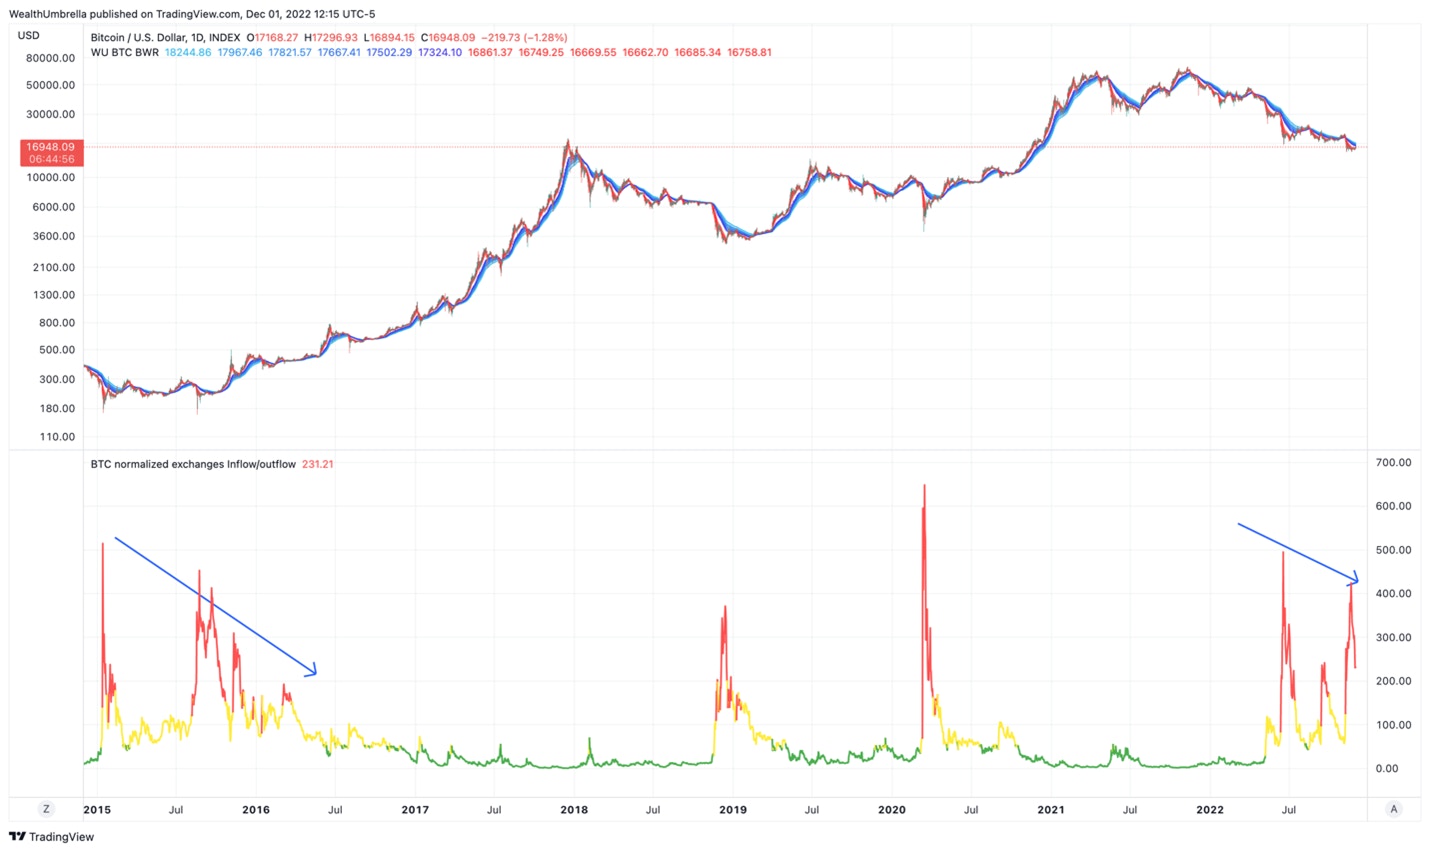
This type of behavior has been observed at bottoms (particularly in 2015). It’s also worth noting that the June spike was also in the same range than the 2015 bottoming zone and higher than what we saw in 2018.
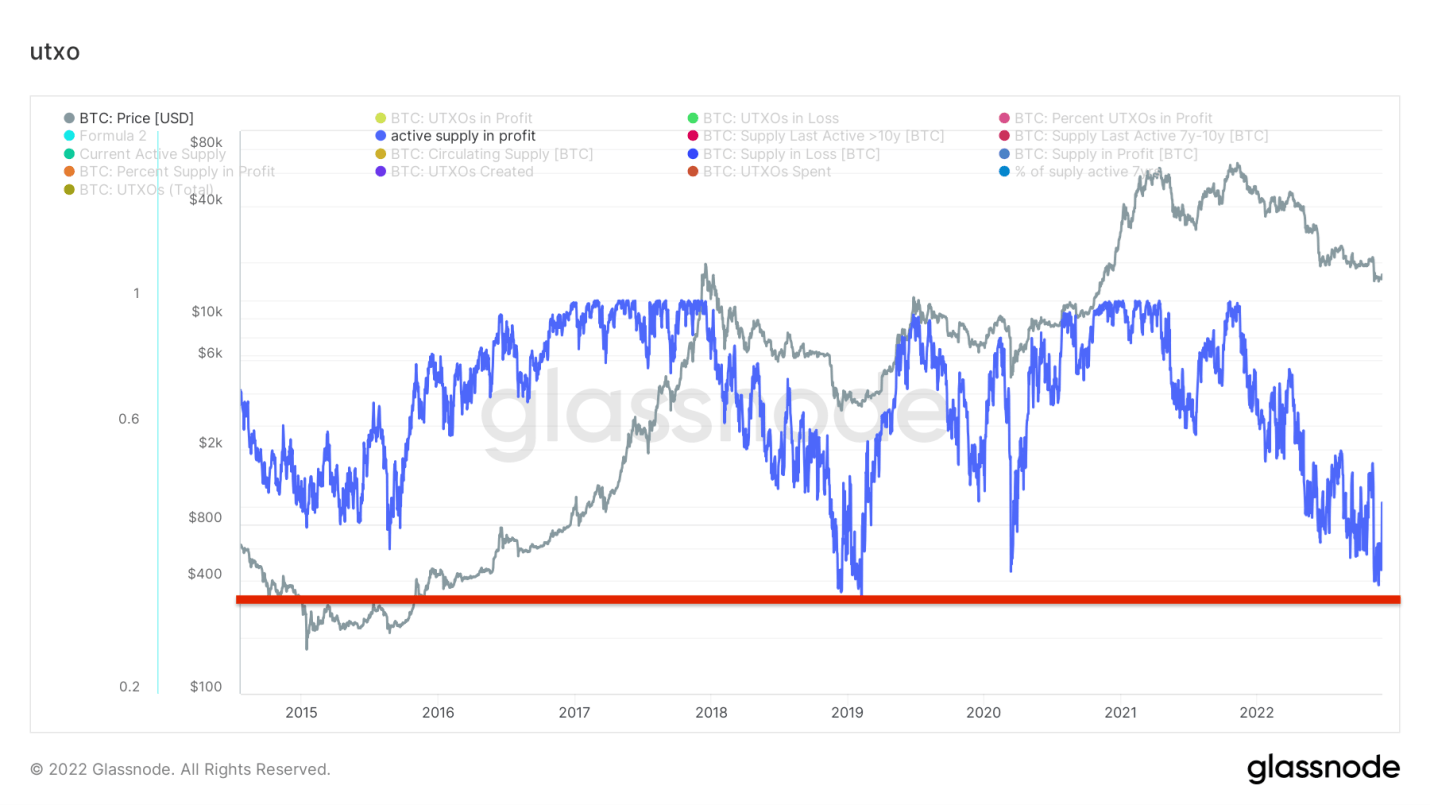
Another interesting metric is the Bitcoin percentage of supply being held in profit for the addresses that were active in the last 7 years. This is helpful to mitigate the effects of long term HODLers or lost supply. Here, we can see that we are now getting pretty close to the all-time low of ~30% of the supply being held in profit, which is the type of capitulation that marks meaningful lows.

Overall, most on-chain metrics from any layers of the Bitcoin ecosystem is providing rare readings that tend to flash around major bottoms. Until these metrics recover it is hard to say with accuracy if the bottom is already in or if we have more way to go in this correction.
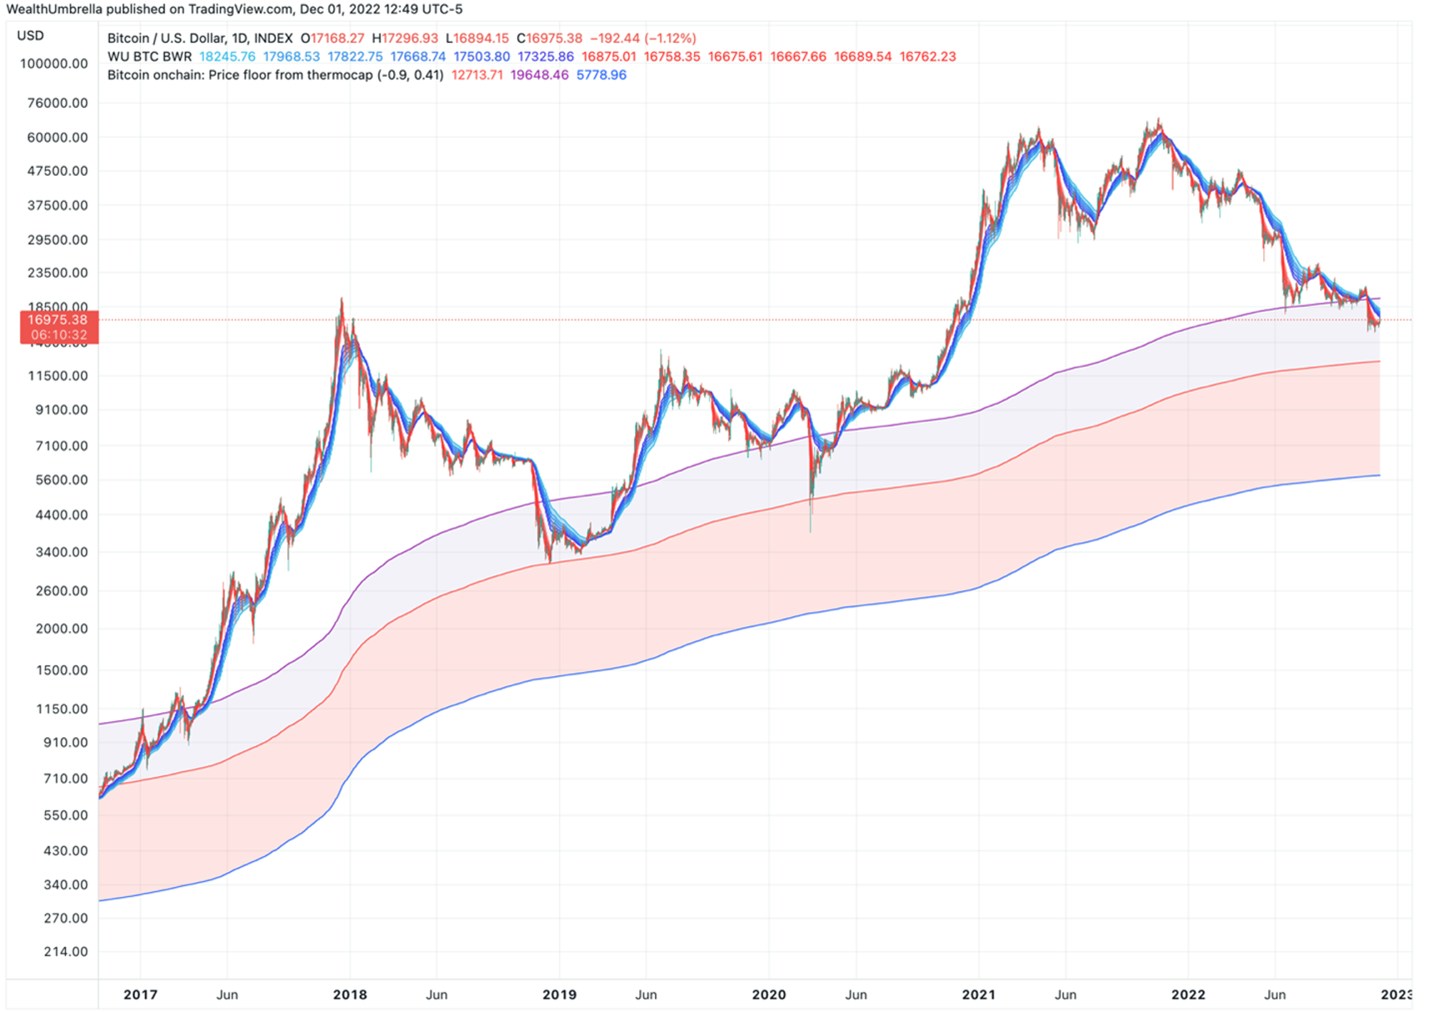
One data set that suggests we could go lower is the relationship between Bitcoin’s Market Cap and its Thermocap. Thermocap is a more realistic means to calculate the size of Bitcoin, instead of using Market Cap. It was first introduced by Nic Carter in 2018, and is the cumulative sum of revenue in USD that miners have generated to secure the Bitcoin network. This can be calculated by doing a summation of the value of each of the roughly 19 million existing Bitcoins at the price they were issued. By using this metric, lost coins and static coins, like the 800,000 coins mined by the mysterious Satoshi Nakamoto, are counted in the total supply at the price they were originally mined.
Wealth Umbrella found that the price of Bitcoin relative to its Thermocap is a great method for identifying high value zones that tend to mark lows. We have entered that zone recently, which is rare, but also supporting another low deeper into this value zone is possible. However, this indicator, based on prior extreme drops, suggests that the current drawdown could see us go towards the $13,000 region before putting in that meaningful low.

Conclusion:
In conclusion, the adoption of Bitcoin beyond retail interest is growing. We are seeing more and more institutional investors, economies and businesses adopting Bitcoin. Though we are in the 4th bear cycle in Bitcoins history, the prior 3 cycles suggest where we are is a rare buying opportunity. There is ample evidence to support the $15,500 level is either a major low or very close to a major low. Both the technical and on-chain analysis support this. As Bitcoin continues to integrate into the global economy, we expect both the volatility and epic returns to calm down. For now, we are content buying Bitcoin at these lows with a long-term mindset.
On Thursday, December 15th at 2:30 pm Eastern, we will be providing our weekly market webinar where we will discuss a buy plan for Bitcoin, including how to hedge Bitcoin when needed. Our goal is to provide context, as well as identify actionable exits and entries for investors. We have used this information to successfully build positions at their lows this year plus we have successfully hedged our portfolio multiple times in 2022.


More To Explore
Newsletter

Token Growth is Surging - Here Are the Beneficiaries
The reality of AI demand growth has shattered early estimates for token processing, yet expectations continue moving up and to the right. In the second installment of our token processing series, we e

AI Token Demand is Shattering Forecasts
Total annual token processing is no longer measured in billions or trillions of tokens, but in the quadrillions and beyond. As annual token processing is now tracked in units with 15 trailing zeros, i

Nvidia and Google Are Crowding TSMC’s N3 Node - Can Intel Fill the Gap?
Nvidia is moving its next-generation Rubin GPUs from 4nm to 3nm, yet Google’s latest TPUs are already on N3 and are expected to remain there. Meanwhile, a growing number of AI CPUs from Nvidia, Amazon
Intel vs TSMC: How CoWoS Packaging Constraints Could Create an Opportunity for Intel Foundry
Taiwan Semiconductor (TSMC) is the single, most important company to the AI industry. However, to compete with the incumbent, Intel does not need to beat TSMC at leading-edge manufacturing. It only ne
Big Tech’s Free Cash Flow is Turning Negative – Who's Next?
Big Tech’s AI revenue is accelerating, but free cash flow is moving sharply in the opposite direction. Across Google, Microsoft, Meta and Amazon, capex is rising much faster than operating cash flow a
Big Tech Earnings Preview: Is AI Monetization Finally Catching Up to Capex?
The most pronounced difference between 2026’s tech rally compared to rallies in the past is which companies have been left out of it. The names most associated with the AI trade have hardly participat

Nvidia, CXL, and the Battle to Improve AI Inference Economics
This is Part 2 of our two-part series on AI inference economics. In Part 1 — Why Nvidia's Next AI Battle Is About Tokens per Watt, we laid out why tokens per watt has become the defining metric for in

Why Nvidia’s Next AI Battle Is About Tokens per Watt
As hyperscalers move from building AI infrastructure to monetizing it, tokens per watt helps to reflect if revenue is scaling and if profitability is improving. Offload engines can increase tokens per

Micron Is Up 900%. Here’s Why the AI Memory Trade May Still Have Room to Run
Over the past 10 months, memory chip stocks have gone from being solid beneficiaries of the AI boom to capturing a massively outsized piece of the return pie. The inflection in Micron’s performance de

Why the S&P 500 Shrugged Off the Iran War — and What Could Finally Break the Rally
On February 28th, the U.S. went to war with Iran, and the market was handed the kind of shock it hasn't contended with for years. The conflict set off a chain reaction across the region: an ongoing su
