My Firm called the Bitcoin’s Bottom; Here is Where the Price Goes Next
December 21, 2023

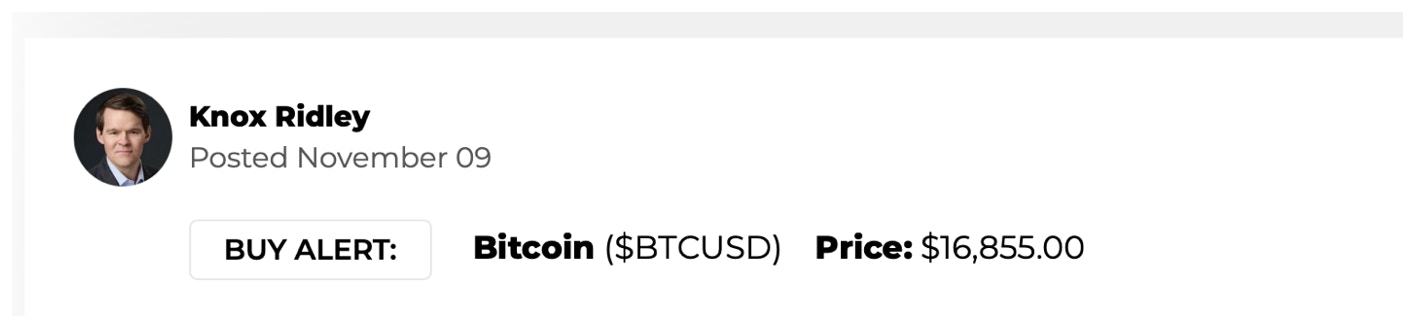
Knox Ridley
Portfolio Manager

Last November, FTX suddenly paused customer withdrawals. One of the world’s largest crypto exchanges soon filed for bankruptcy, revealing a scandal that led to $8.7 billion in missing funds. The FTX incident caused capitulation in crypto with Bitcoin seeing 77% drawdown.
With this backdrop, on December 9th, The I/O Fund and The Wealth Umbrella stated in the analysis: “Bitcoin is Going to Rally Again – Here’s What you Need to Know:”
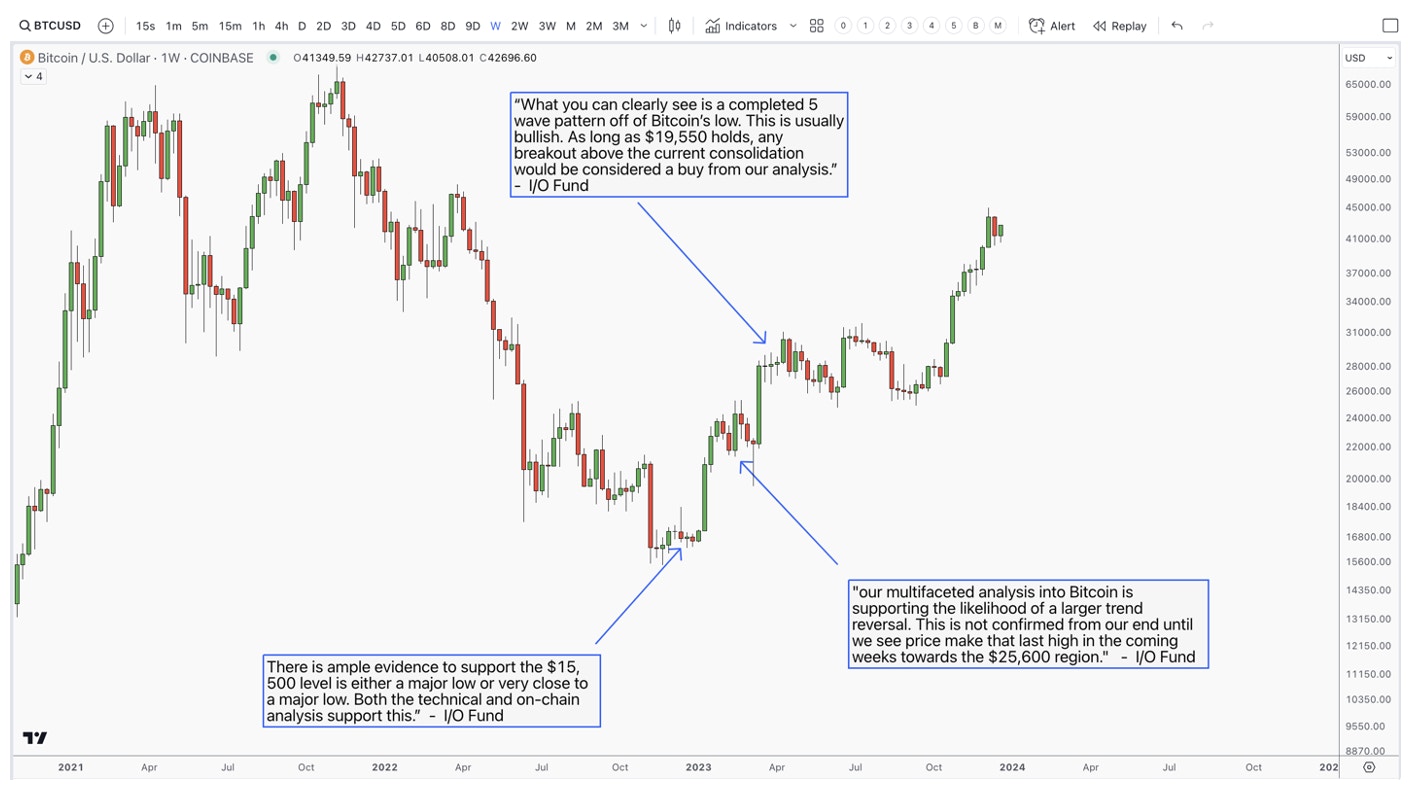
“Though we are in the 4th bear cycle in Bitcoin's history, the prior 3 cycles suggest where we are in a rare buying opportunity. There is ample evidence to support the $15,500 level is either a major low or very close to a major low. Both the technical and on-chain analysis support this.”
We reiterated this in early February in a follow up analysis: Bitcoin is up 40% in 2023, Here’s Where it Goes Next
“In conclusion, our multifaceted analysis into Bitcoin is supporting the likelihood of a larger trend reversal. This is not confirmed from our end until we see price make that last high in the coming weeks towards the $25,600 region. Interestingly, this new bull cycle is coinciding with a weakening US Dollar. Also, it is accompanied with more central banks being boxed into inescapable corners.”
And then to really drive the point home, we repeated in April: Bitcoin Vs Banks: Here's Where the Price Goes Next
“What you can clearly see is a completed 5 wave pattern off of Bitcoin’s low. This is usually bullish. As long as $19,550 holds, any breakout above the current consolidation would be considered a buy from our analysis.”
“As long as The Wealth Umbrella’s signal stays in the “green environment” and price holds above $19,550, we will continue adding carefully to our Bitcoin position with real-time trade alerts sent to our research premium members.”
The chart below illustrates our impeccable timing:

The reason this is important is because our firm offers a rare, yet valuable roadmap for this volatile asset. Not only did we call the Bitcoin bottom, but we also called the previous Bitcoin top at the $58,000 range in the analysis Bitcoin Approaches Upside Target: “We have trimmed some in the $55,000 region, and may trim some more if we reach the $65,000. However, we see any large drawdown to be an opportunity for Bitcoin and we will likely enter again if/when this happens.”
Bitcoin is susceptible to a noisy, bifurcation between bulls and bears with extreme statements, such as: “Bitcoin will go to $1 million” or “Bitcoin is a ponzi scheme and will go to $0.” The truth is that Bitcoin has risen 7,000% in the past 10 years and smashed every record in equities in the past 15 years. Yet, it has also weathered multiple 70%+ drawdowns, but then against all odds, is capable of a full recovery within 3.5 years -- every time. It bears mentioning that many dot-com companies have not reclaimed their all-time highs in over 20 years following such a selloff. Therefore, if you look at this rationally, it only makes sense to try and participate in this asset while limiting the downside. Most especially, if you can buy at the bottom, which is exactly what we set our readers up to do in 2023.
Our firm specializes in this precise discipline with all tech stocks – which is, participating in the upside while limiting the downside by using technical analysis for risk management. However, in the absence of fundamentals, this process excels at the ultimate high risk-high reward tech asset (crypto).
Our method combines price patterns with on-chain metrics which helped determine when crypto was approaching a meaningful top in early 2021. As a result, we cut our crypto holdings in half when Bitcoin was trading between $50,000 - $60,000, and then subsequently, our method helped determine when Bitcoin was bottoming at $15,500. By having a strong process for layering-in at the bottom and layering-out at the top, our firm has surpassed institutional tech portfolios every year since inception.
Below, is our updated analysis including what levels must hold for Bitcoin to be a buy.
Bitcoin is Setting Up for a New All-Time High
One year and 150%+ gains later, my firm would like to update you on where Bitcoin will go next. We do see a critical pullback on the horizon, yet the pullback is likely to be shallow for Bitcoin’s purposes. Most importantly, this next pullback has the potential to be the last great buying opportunity for Bitcoin, as the asset could be setting up for a new all-time high. My firm is prepared to buy this next dip and issues real-time trade alerts for every entry and exit.

Bitcoin’s Next Great Buying Opportunity
In the December 9th report just referenced, we showed a chart that outlined our long-term perspective while Bitcoin was around $17,000.

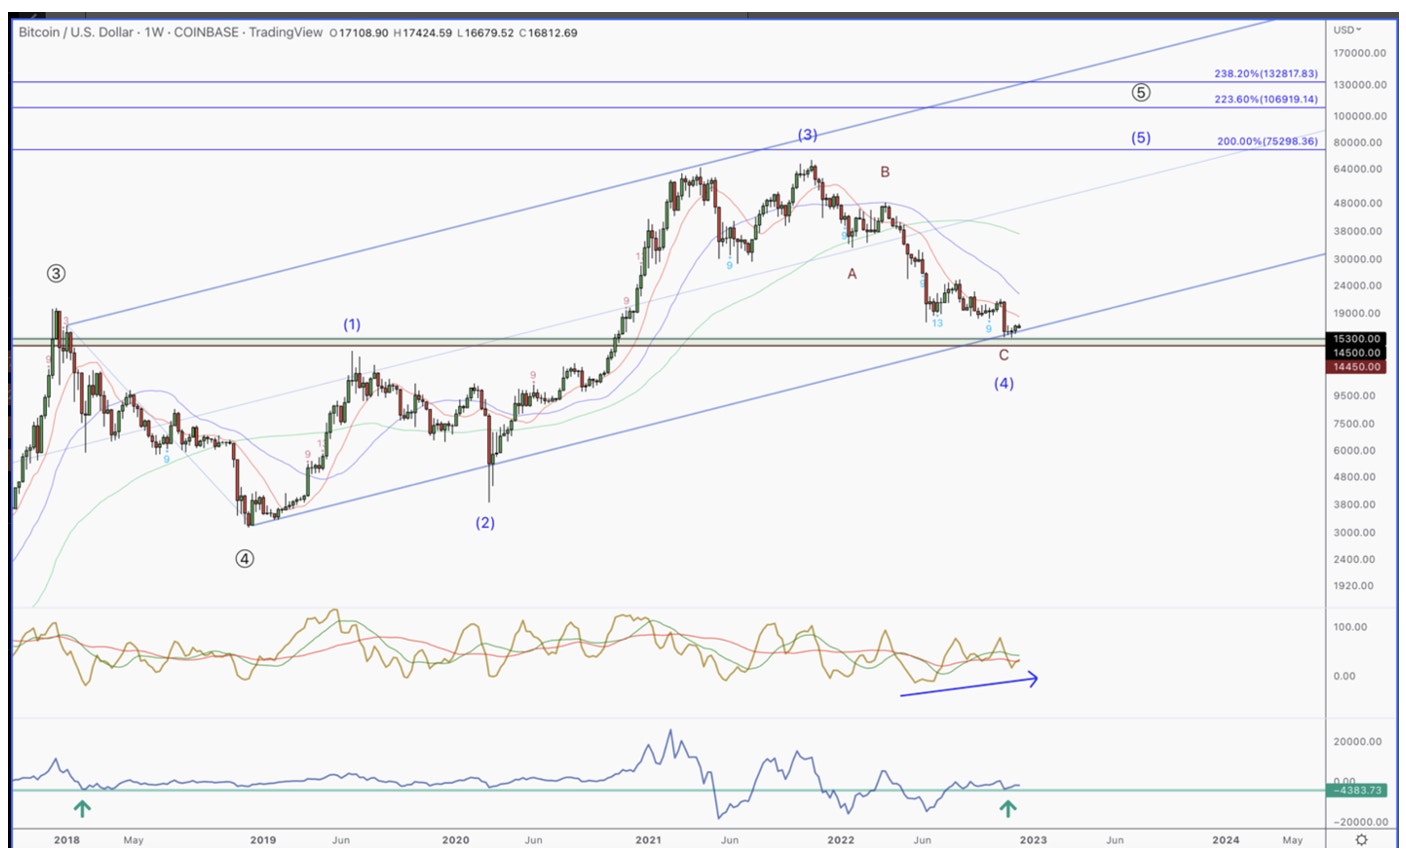
The above chart, at the time, showed Bitcoin was on major support with momentum shifting to the bulls. It also suggested that Bitcoin was only in a correction within a larger uptrend. Our targets for the coming bull cycle were between $75,000 - $132,000.
At the time, these targets seemed unlikely; however, the technical patterns supported them as long as critical support levels held on the way up. Today, Bitcoin is up 175% from our $17,000 buy rating, and the upper targets remain.

It is our belief that the current pullback will potentially be one of the last great buying opportunities before investors are forced to chase Bitcoin higher. The setup is there, but this depends on if Bitcoin can clear a few, key price levels.
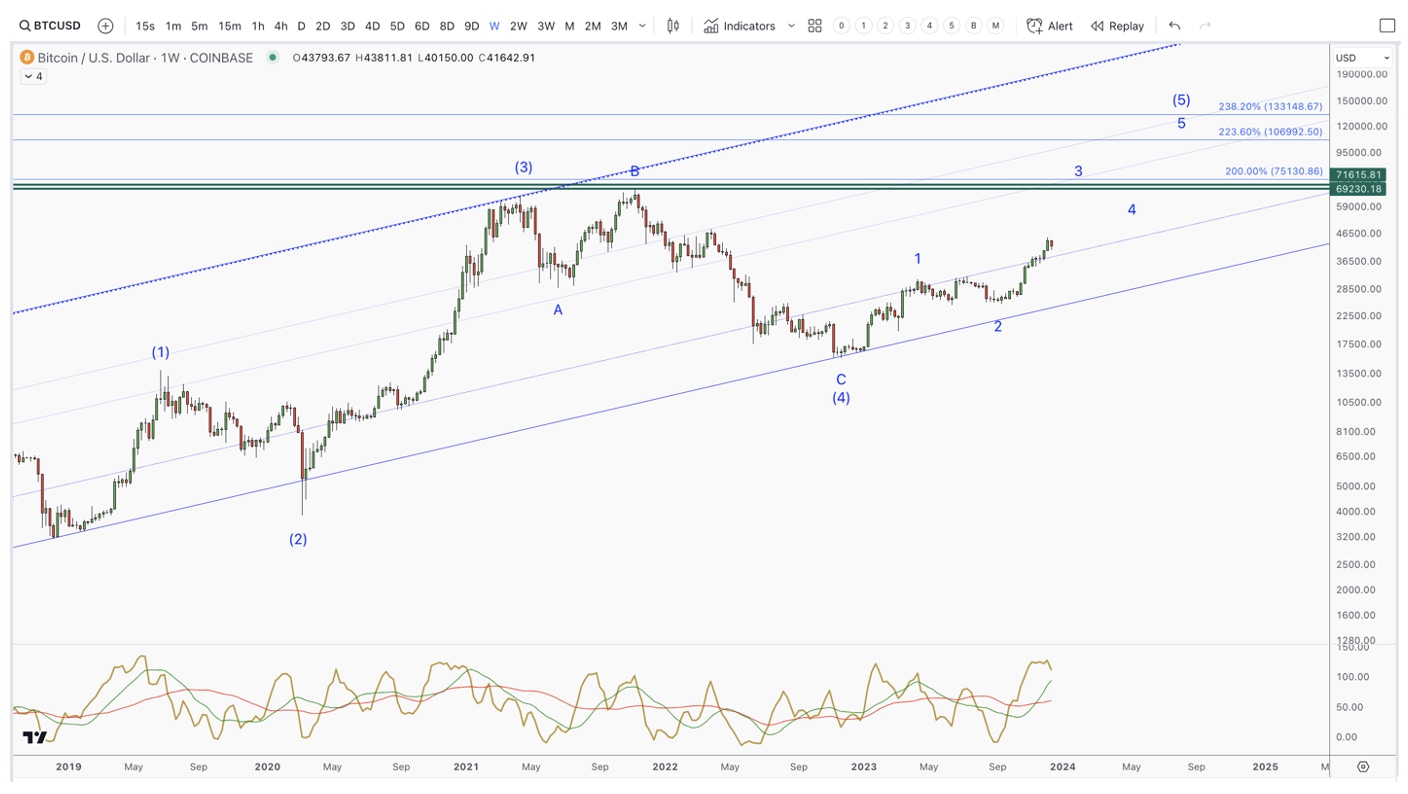
If we zoom into the pattern that is developing off the November 2022 low, we can see the danger zones, as well as updated critical supports that must hold for this pattern to continue higher. Where I will grow cautious is if the next push higher stalls within the $50,000 - $58,750 region. If the 2023 bounce is only a corrective bounce in a much larger downtrend, this is the zone where this corrective bounce will reveal itself, and likely top.

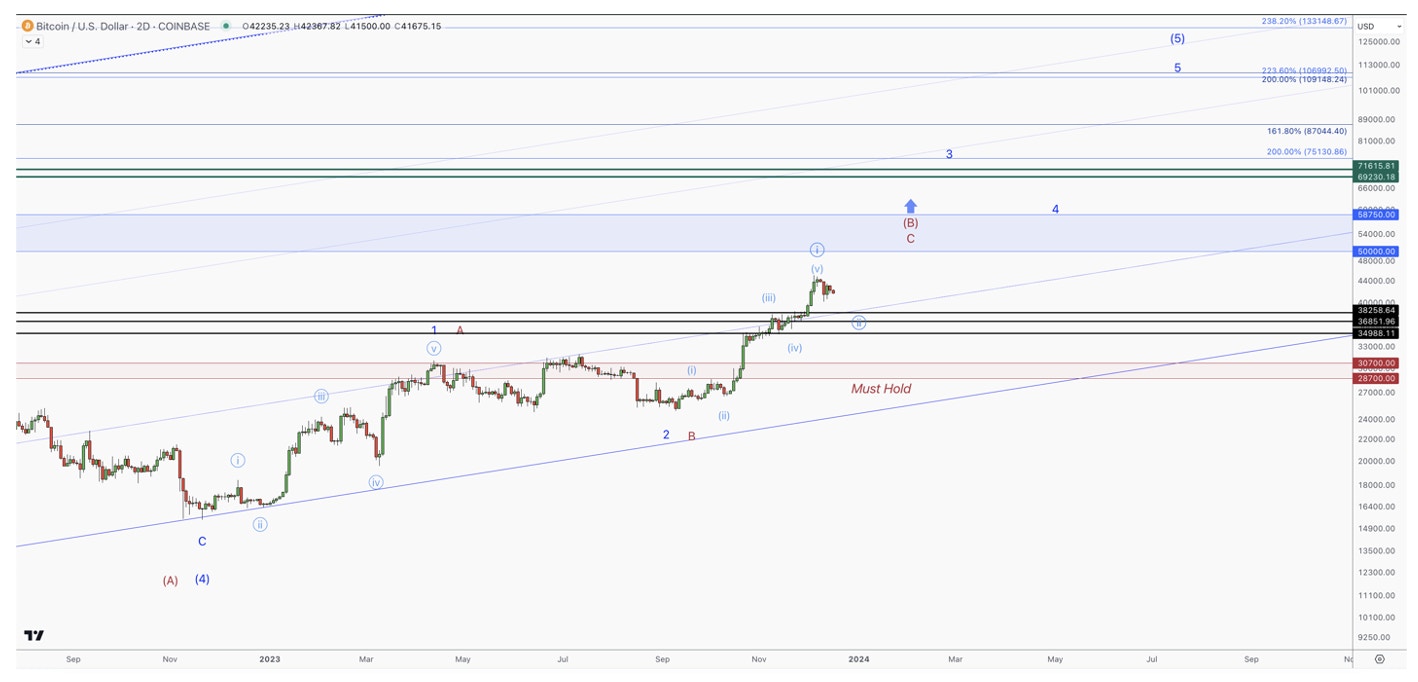
In the above chart, the 1st major change of character was the opposite of what we saw in 2022. The uptrends consist of vertical moves higher, with overlapping and messy corrections that fail to make new lows. What is important to notice, in blue, is that we have successfully completed 2 series of five wave patterns. Each series pushed Bitcoin higher.
What follows a five wave push is always a three wave retrace. We are now starting the 2nd three wave retrace, which we believe will be targeting between $39,000 - $35,000. If this pullback resembles the prior one – overlapping and in an obvious three wave pattern – then, we believe this will be the last great buying opportunity before Bitcoin goes vertical. This will remain our gameplan as long as Bitcoin holds $28,000 in a deeper correction than expected. If we do break below $28,000, then the larger uptrend we are tracing to $100,000 will be invalidated. This is key as what’s central to risk management is always having a game plan if the primary count fails. For us, the $28,000 price level will act as an emergency brake with minimal downside for the mid-$30s. By having this emergency brake, we can participate in the upside while limiting the downside.
The next major hurdle for Bitcoin will be if/when we enter the $50,000 - $58,750 overhead resistance. The alternative red count on the chart suggests that the 2023 bull cycle is actually a corrective bounce in a very large bear market pattern. If we get into this zone and see the character of the trend reverse, then we will alter our risk management plan. If Bitcoin can clear the $58,750 resistance, then odds will greatly improve that we are on our way to the overhead targets listed over a year ago.
On-Chain Analysis
By Vincent Duchaine of The Wealth Umbrella
Even though there is not classic fundamental analysis within the crypto ecosphere, there are numerous data sets within Bitcoin’s blockchain, utility, and transaction activity that can act as a unique form of fundamental analysis. This is called on-chain analysis, and it is very effective in helping us understand when to increase and reduce risk within our crypto holdings.
For this type of analysis, we work with Vincent Duchaine of The Wealth Umbrella. His team of A.I. and Machine Learning engineers have devised a way to quantify risk using on-chain metrics, and the on-chain metrics are confirming the upper targets outlined by our technical analysis. Below is a glimpse into some of this on-chain analysis, which we use to better manage risk in the I/O Fund portfolio.
When Bitcoin hit $44,000, the on-chain metrics were suggesting a pullback was imminent. While BTC was reaching fresh 2023 highs, the number of newly created crypto addresses with a non-zero balance had been on a continuous downtrend for a few days. An easy way to think about this is that the demand for crypto was starting to fade while Bitcoin was making a new high. This is a divergence we usually see at a local or cyclical top.

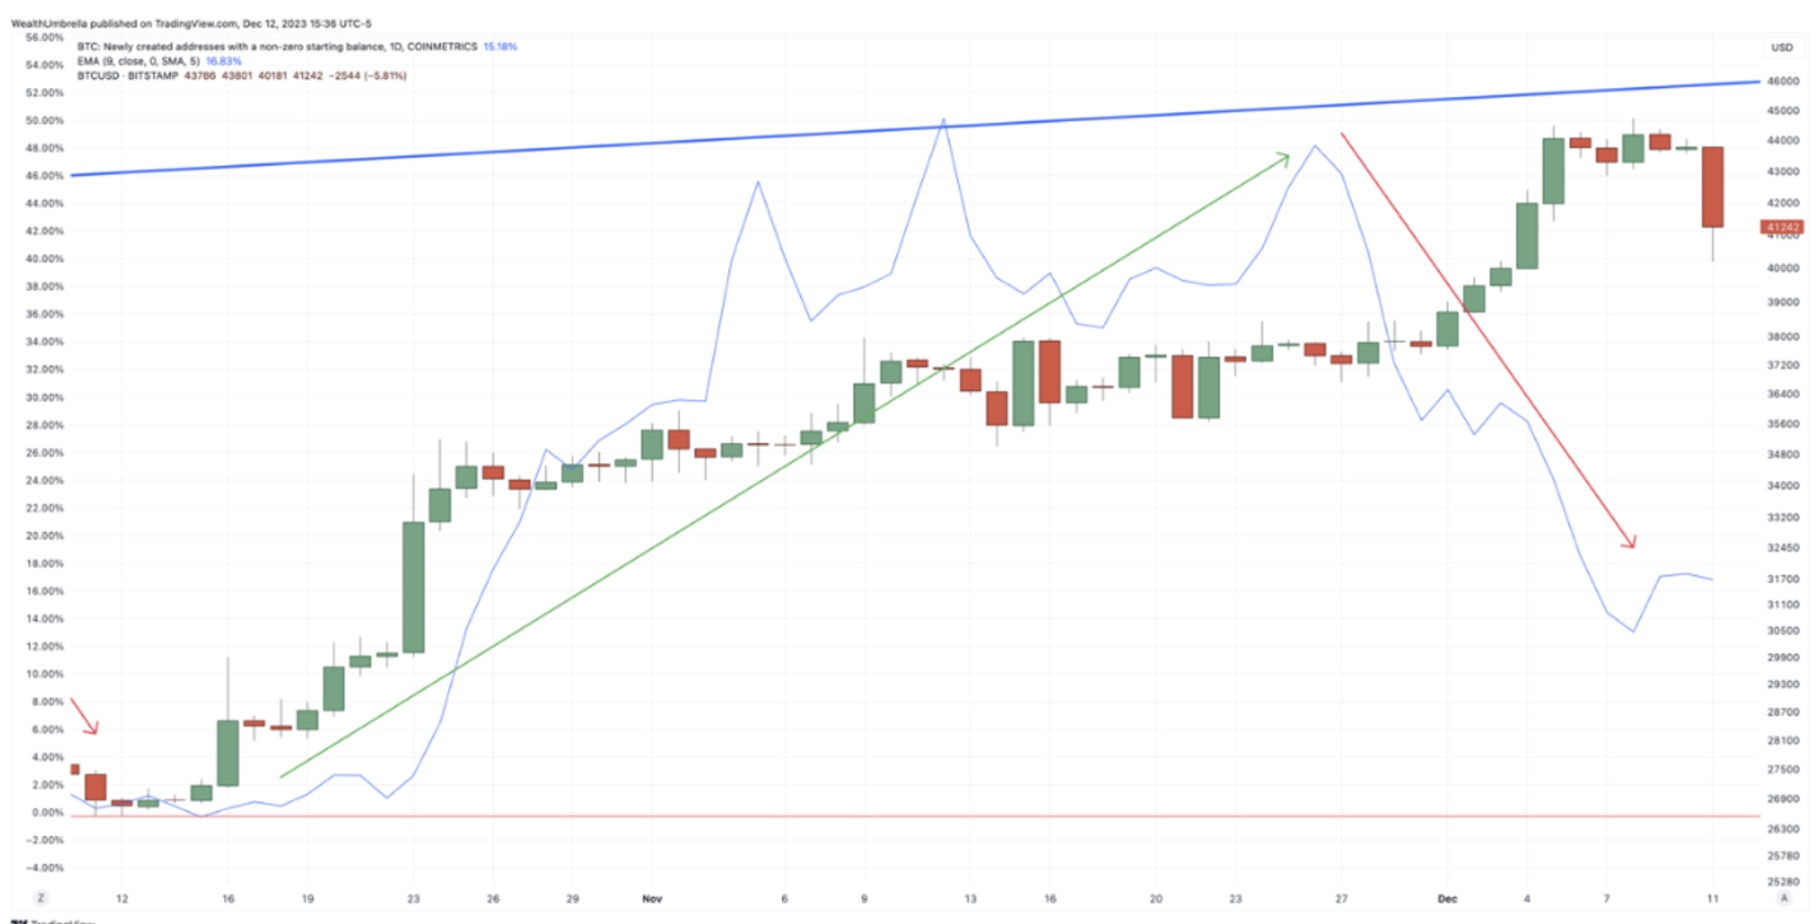
As we were seeing this decrease in demand, it happened to coincide with the % of investors holding Bitcoin for over a year (hodlers) starting to take gains.

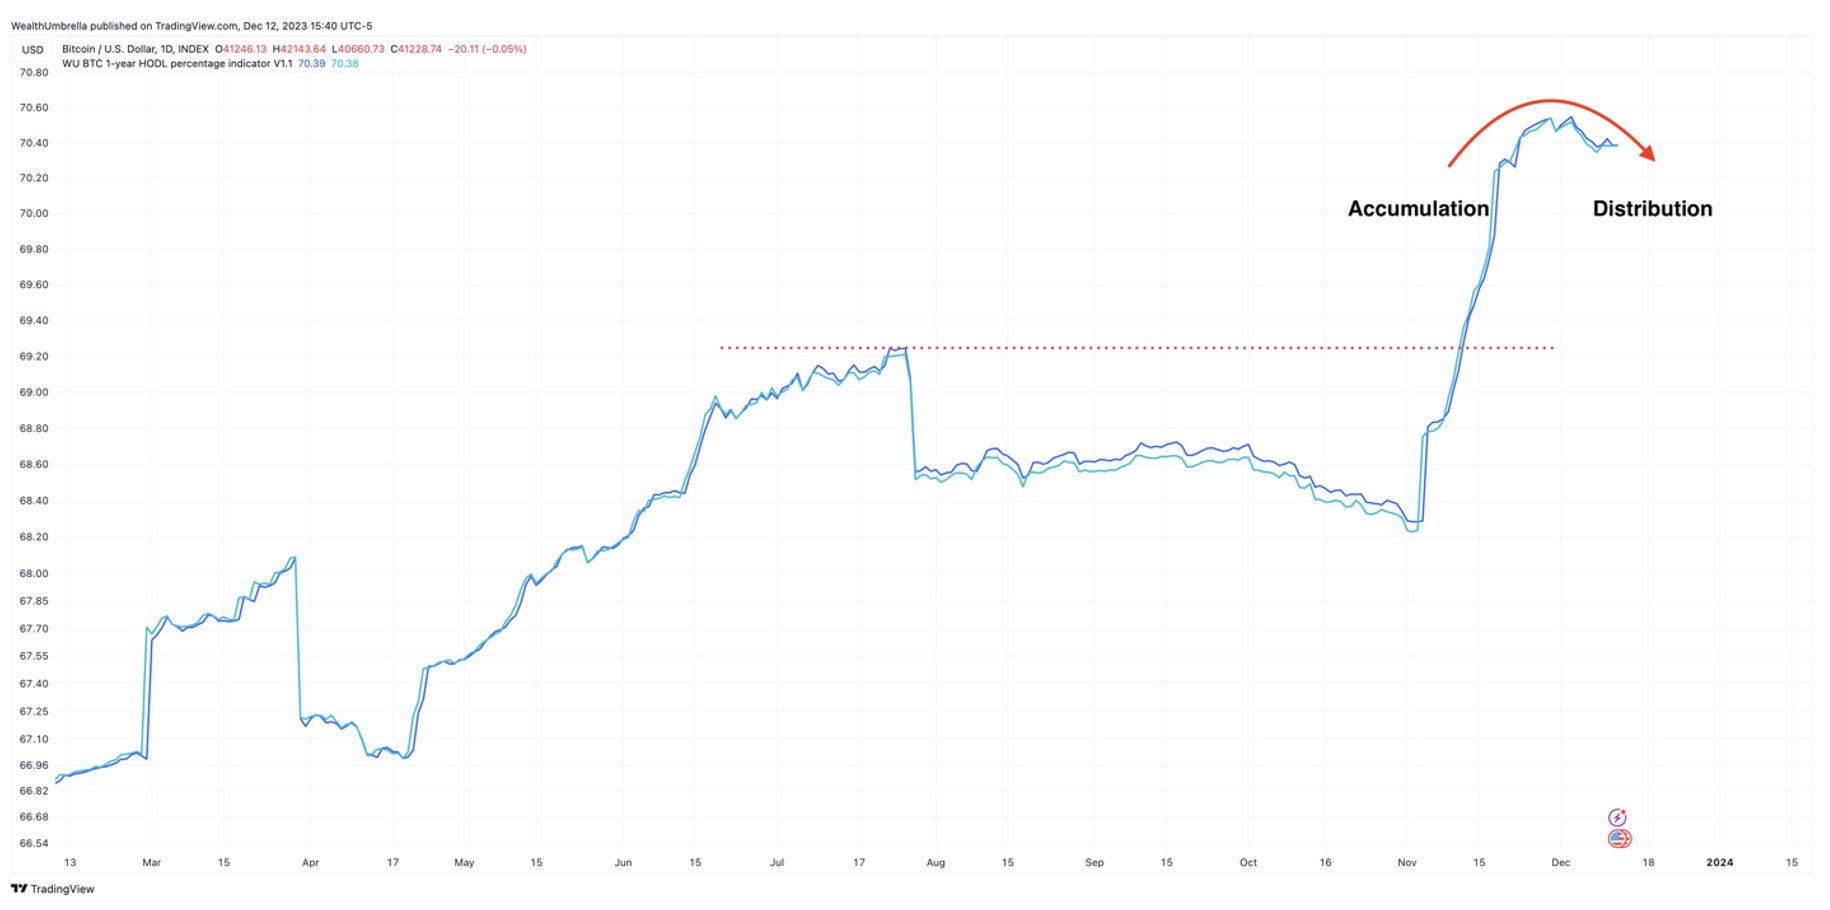
With hodlers looking to sell, and not many new buyers in the network, Bitcoin had no other choice than to pull back. But, despite this pullback, which we think will be short lived, our view is that Bitcoin still has more of upside.
None of our on-chain metrics have come close to a reading that indicates a historic top. A good example of this is our proprietary Kwiatkowski Indicator, which is a normalized aggregation of all the different market caps. It was designed to give a consistent spike at bottoms and tops. It called the bottom in November 2022 when it printed a value of -75. This indicator is currently only at 12, for an average value of 65 at the cyclical top. In fact, this value is actually consistent with a reading associated with the beginning of a new cyclical bull run. Indeed, except for the mini-bull run that happened in summer 2019, any other time this indicator went over 12 in the history of Bitcoin, it was the start of a new cyclical bull run.
With hodlers looking to sell, and not many new buyers in the network, Bitcoin had no other choice than to pull back. But, despite this pullback, which we think will be short lived, our view is that Bitcoin still has more of upside.
None of our on-chain metrics have come close to a reading that indicates a historic top. A good example of this is our proprietary Kwiatkowski Indicator, which is a normalized aggregation of all the different market caps. It was designed to give a consistent spike at bottoms and tops. It called the bottom in November 2022 when it printed a value of -75.
This indicator is currently only at 12, for an average value of 65 at the cyclical top. In fact, this value is actually consistent with a reading associated with the beginning of a new cyclical bull run. Indeed, except for the mini-bull run that happened in summer 2019, any other time this indicator went over 12 in the history of Bitcoin, it was the start of a new cyclical bull run.

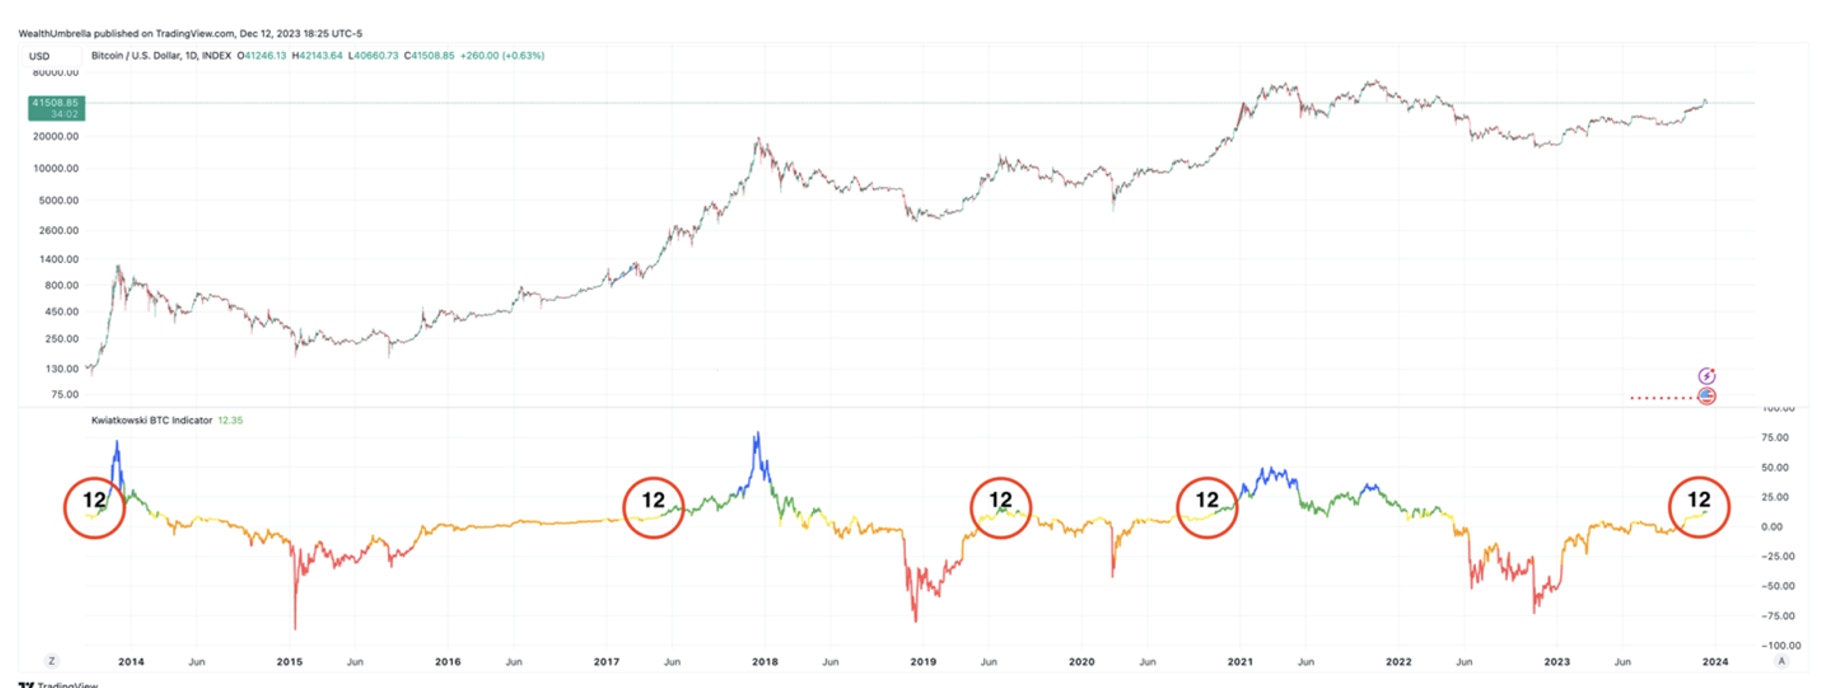
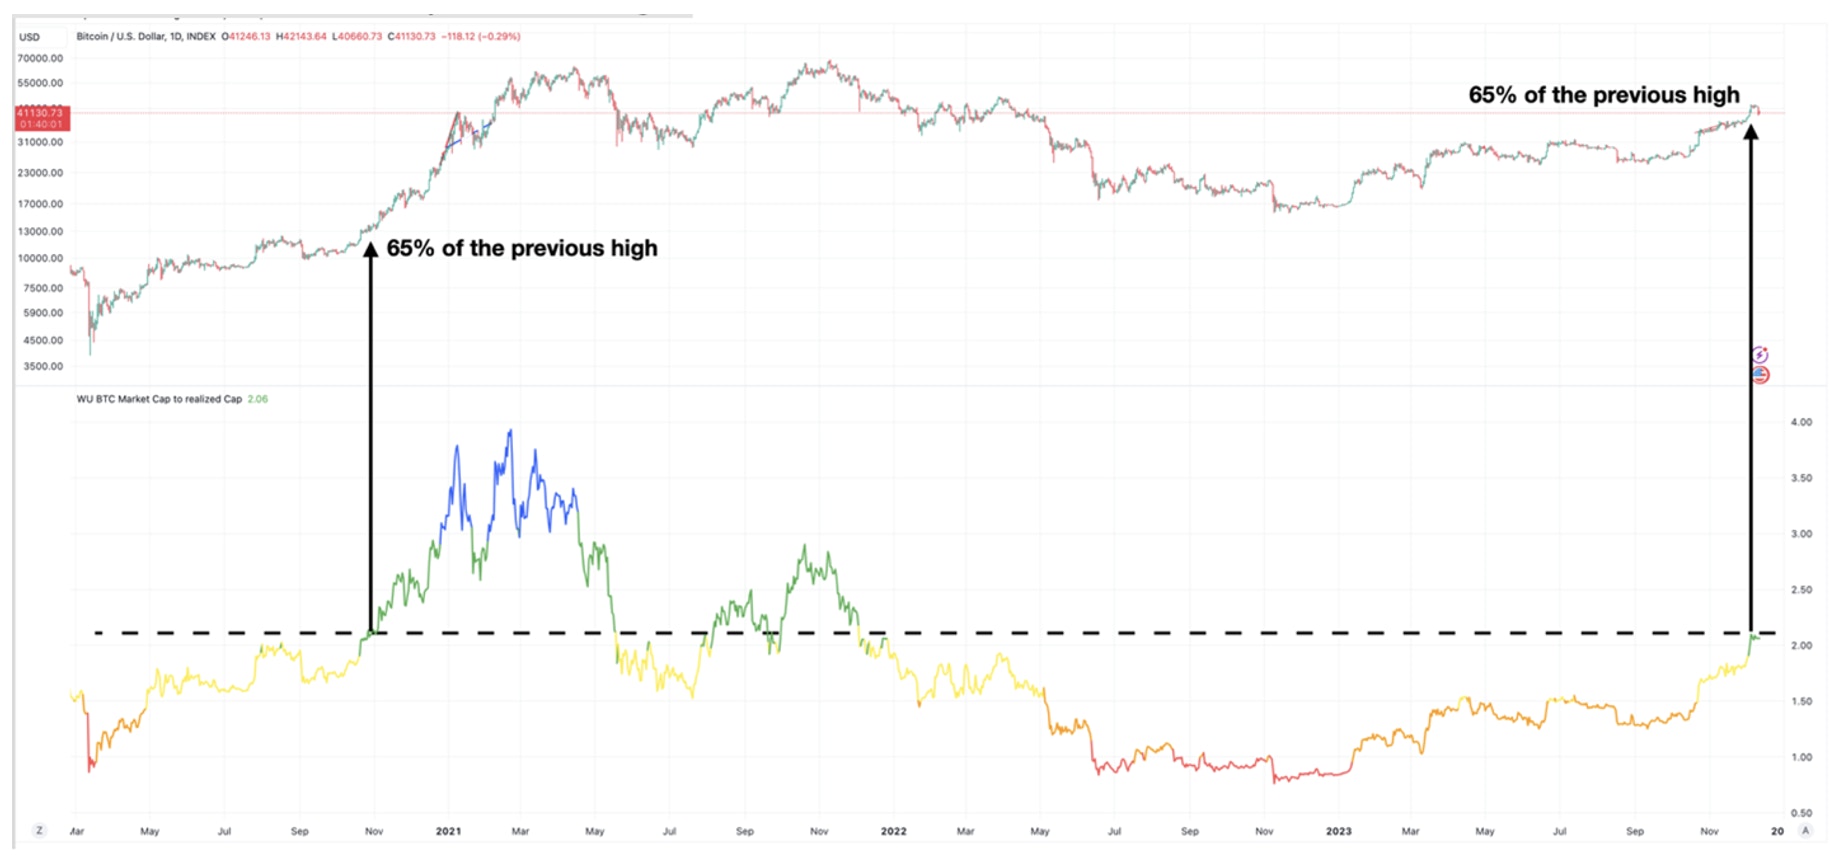
Same message can be found in the Market Value to Realized Value ratio (MVRV) that recently went to 2.11. The last time this indicator crossed this value out of a bear market was on October 26th, 2020. At that moment, Bitcoin was already at 65% of the total value it reached in the previous cyclical bull run. Strange coincidence, when we reached the same MVRV value last week, Bitcoin was also at 65% of its previous high.

Institutional Adoption: Bullish Fundamental Moment for Bitcoin
Bitcoin has no earnings reports, management overhauls, or supply chain disruptions – therefore, in order to measure what Bitcoin will do next, we must measure sentiment. This is why Bitcoin responds particularly well to technical analysis.
However, we can’t deny that Bitcoin is on the precipice of one of the most bullish fundamental moments in its history, which is widespread access for institutions and retail investors. In January of 2024, it’s expected that Bitcoin spot ETFs will be approved, which will allow ETFs to be backed by Bitcoin instead futures, and in turn, this will allow institutions to hold an allocation to Bitcoin in a manner that is secure and can be liquidated similar to a stock.
We have been anticipating this moment since 2019 when we stated: “One of the biggest hurdles for institutions, however, is not the idea of a world run on digital currencies, but rather the decentralization concept and the need for cryptocurrency storage. Institutional investors need to know the assets are secure, insured, and under the care of a trusted third party, per SEC rules, which requires advisers to keep client funds with a qualified custodian.” ETFs greatly simplify these hurdles.
To attempt to size the demand the ETFs may create, Grayscale has $18 billion assets under management. If we assume 10 Bitcoin ETFs are approved of similar popularity, this could add an additional $180 billion in demand for a limited supply of Bitcoin. As a reminder, Bitcoin is limited to 21 million Bitcoins and the next halving occurs in 2024. Halving can lead to a higher value for Bitcoin as it reduces the number of new bitcoins being generated by the network.
In anticipation of ETFs being approved, central banks have released guidelines that allow banks to hold up to 2% of reserves in crypto. The assets of central banks total roughly $44 trillion, and so this would be roughly $800 billion, or equal to Bitcoin’s market cap, if fully utilized.
Conclusion:
Last week, our firm was on Fox Business News where Charles Payne asked Lead Tech Analyst Beth Kindig for a price target. Using the analysis above she stated on live TV that our price target is $100,000 – minimum. This target is backed by both technical and on-chain analysis; the same analysis that has helped us navigate meaningful turns in Bitcoin since 2019.
Of course, investing is never as easy as laying out a price target and holding on. In this report, you got a glimpse into our active process that has been quite rewarding within the crypto space. Further, we laid out what steps Bitcoin must take in order to reach our long-term price target as well as the price at which we pivot to protect our gains. We reserve our entries and exits for premium members. If you’d to know when we are buying or selling Bitcoin with real-time trade alerts, then please consider subscribing below.
Disclaimer: This is not financial advice. Please consult with your financial advisor in regards to any stocks you buy.
Recommended Reading:


More To Explore
Newsletter

Nvidia and Google Are Crowding TSMC’s N3 Node - Can Intel Fill the Gap?
Nvidia is moving its next-generation Rubin GPUs from 4nm to 3nm, yet Google’s latest TPUs are already on N3 and are expected to remain there. Meanwhile, a growing number of AI CPUs from Nvidia, Amazon

Intel vs TSMC: How CoWoS Packaging Constraints Could Create an Opportunity for Intel Foundry
Taiwan Semiconductor (TSMC) is the single, most important company to the AI industry. However, to compete with the incumbent, Intel does not need to beat TSMC at leading-edge manufacturing. It only ne

Big Tech’s Free Cash Flow is Turning Negative – Who's Next?
Big Tech’s AI revenue is accelerating, but free cash flow is moving sharply in the opposite direction. Across Google, Microsoft, Meta and Amazon, capex is rising much faster than operating cash flow a
Big Tech Earnings Preview: Is AI Monetization Finally Catching Up to Capex?
The most pronounced difference between 2026’s tech rally compared to rallies in the past is which companies have been left out of it. The names most associated with the AI trade have hardly participat
Nvidia, CXL, and the Battle to Improve AI Inference Economics
This is Part 2 of our two-part series on AI inference economics. In Part 1 — Why Nvidia's Next AI Battle Is About Tokens per Watt, we laid out why tokens per watt has become the defining metric for in
Why Nvidia’s Next AI Battle Is About Tokens per Watt
As hyperscalers move from building AI infrastructure to monetizing it, tokens per watt helps to reflect if revenue is scaling and if profitability is improving. Offload engines can increase tokens per

Micron Is Up 900%. Here’s Why the AI Memory Trade May Still Have Room to Run
Over the past 10 months, memory chip stocks have gone from being solid beneficiaries of the AI boom to capturing a massively outsized piece of the return pie. The inflection in Micron’s performance de

Why the S&P 500 Shrugged Off the Iran War — and What Could Finally Break the Rally
On February 28th, the U.S. went to war with Iran, and the market was handed the kind of shock it hasn't contended with for years. The conflict set off a chain reaction across the region: an ongoing su

Nvidia, CoreWeave, and Nebius: Inside the Circular Financing of the GPU Boom
Neoclouds are one of the more hotly debated AI business models, with CoreWeave and Nebius being the two most widely recognized names. These companies have seen their sales, backlog, and share prices s

AMD, Nvidia, Arm, Intel: Inside the $120 Billion CPU Gold Rush
CPUs have gone from an afterthought to becoming the AI trade’s next great bottleneck – and with AMD, Nvidia, Arm and Intel circling a market that is doubling nearly overnight, the only question left i
