

In December of 2022, when Bitcoin was trading around $17,000, we boldly stated that “Bitcoin is a buy.” At the time, we were beginning to position for a new Bitcoin bull cycle. We even posted a chart in this report entitled “Bitcoin’s Upcoming Rally – What You Need to Know,” showing our targets for the coming bull market of $75,000 – $132,000, shown below.
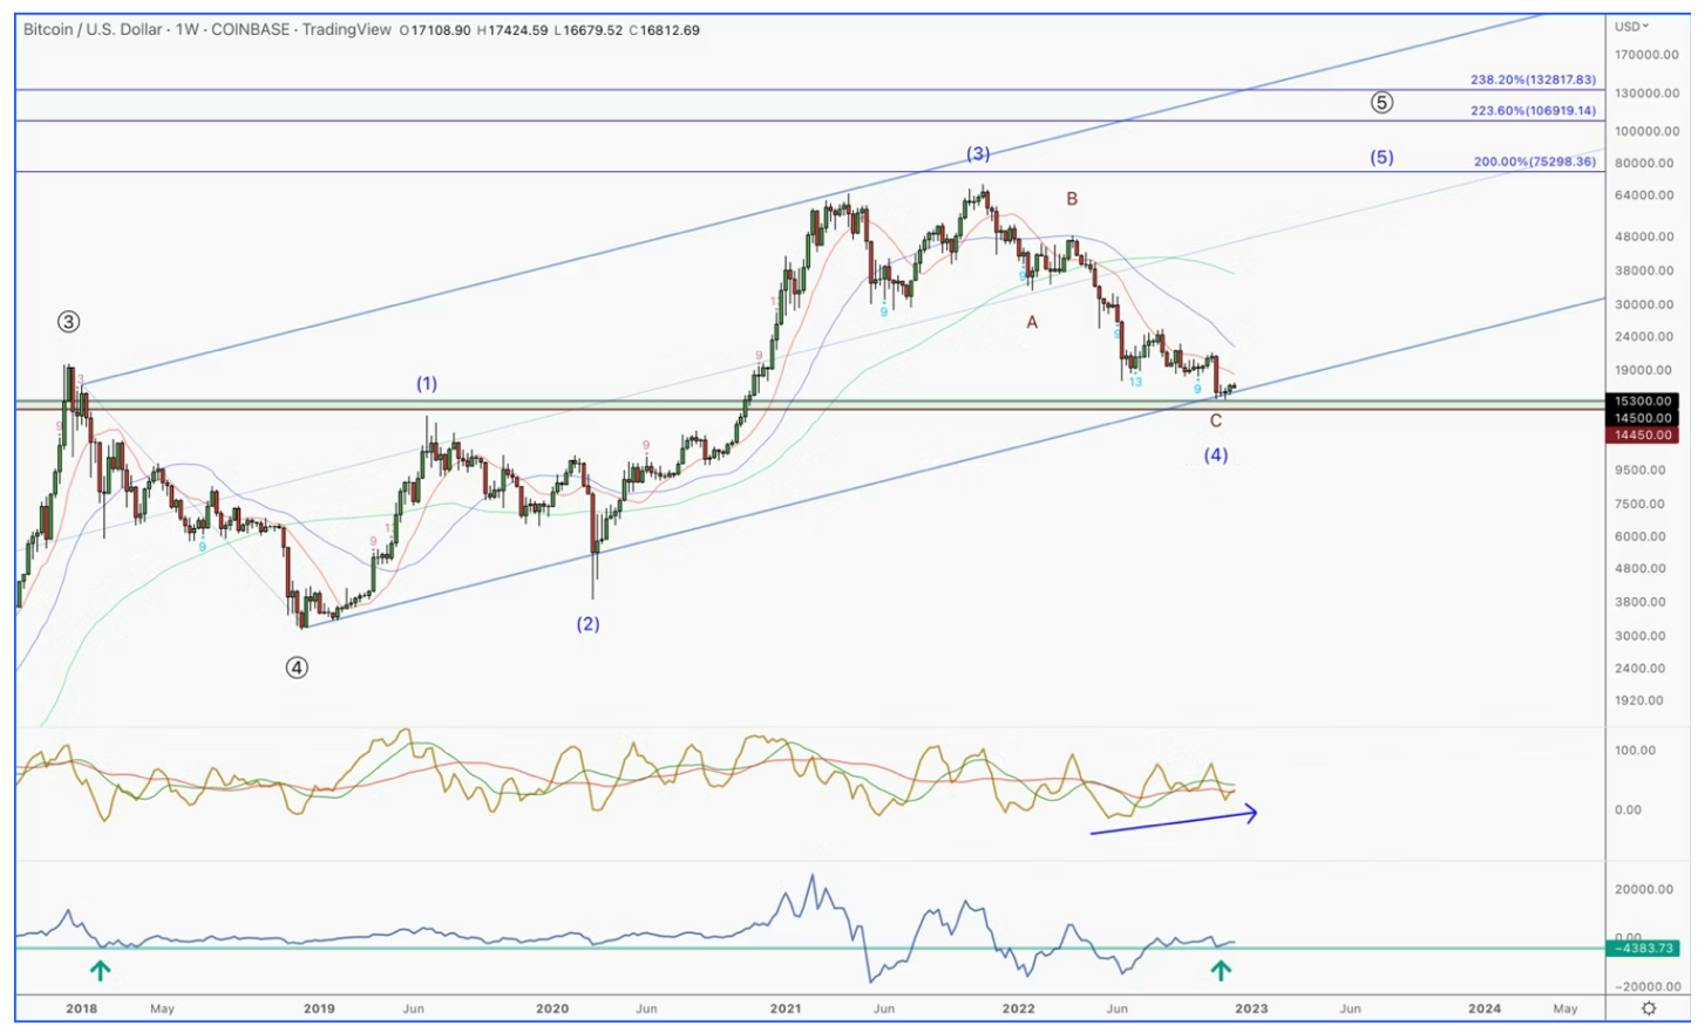
This was an unpopular report at the time, as Bitcoin was down nearly 80% from the 2021 highs, and was coming off the heels of a crypto panic following the FTX scandal. Over 1 year later in March of 2024, Bitcoin did indeed hit $73,757 — just shy of our lower target.
With tech stocks, we offer fundamental analysis to identify what to buy, and then we use technical analysis as a supplement for gauging sentiment and risk. However, with Bitcoin, there is no management team, earnings calls, and minimal news events. For this reason, we lean heavily into technical analysis and on-chain analysis to guide our position management.
These techniques are what we used to call the 2022 low as well as the accurate upper targets a year in advance. These same techniques were used when we increased our upper targets to $106,000 – $190,000 in our April of 2024 report.
We believe these targets are attainable, which is supported by the updated technical analysis as well as the on-chain analysis below. However, the correction that started in March of this year was simply too long in time, and has led to us adjusting our targets. We are also adjusting our game plan for the sake of risk management and will look to reduce our crypto exposure by ~50% on the next push to all-time highs (ATHs), locking in well-deserved gains. We will then revisit buying back once we get more information on the following consolidation.
Technical Analysis
Since 2019, we have repeatedly presented to our Premium Members that we are in a large degree uptrend that started in late 2018. This uptrend is taking the shape of a standard 5-wave pattern, which is one of the reasons we were calling for a low in 2022.
In our December 2022 report, we stated…
“As of now, since the 2018 low, we only have 4 waves in place, which implies that we have one more 5th wave push before the larger bull cycle is over.”
As bad as it felt, this made the recent bear market a correction within a larger uptrend. We simply did not have a full 5 waves in place, and until we saw a 5th wave push to new highs, the pattern remained incomplete. We are currently in that final 5th wave of this nearly 7-year uptrend. That being said, we still see the potential for another +50% – 90% move higher in the coming months.
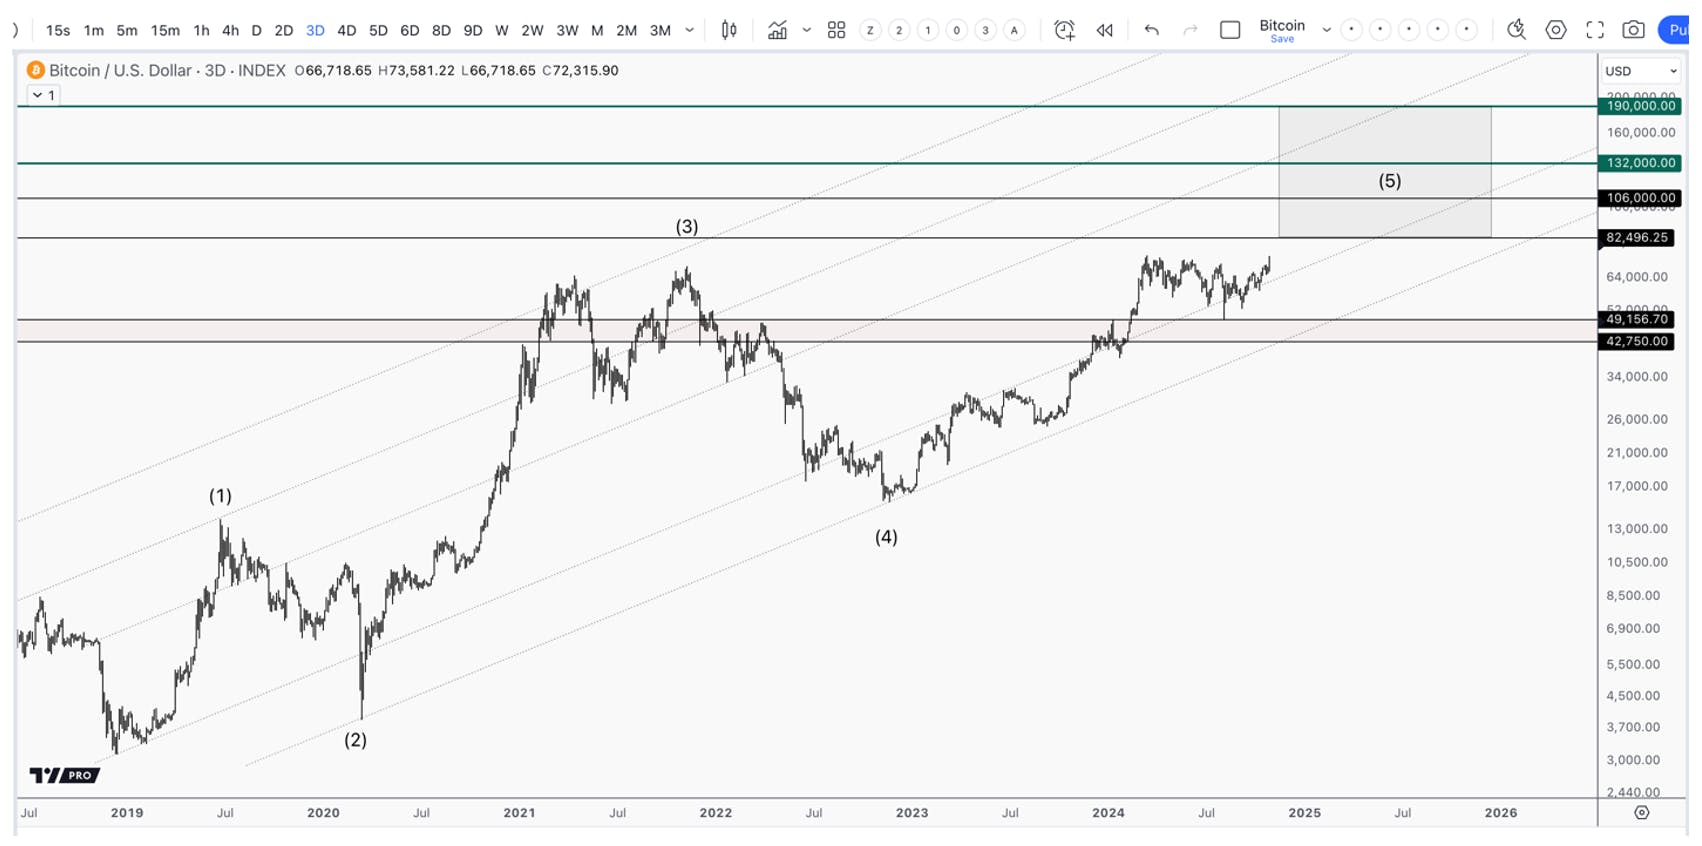
The below is our price analysis on this final 5th wave that started in November of 2022. It is also unfolding as a standard 5-wave pattern, and is incomplete until we push to new all-time highs. We stated this in our April 2024 report, which we used to buy this dip.
“We are in a large 5 wave pattern, which is targeting well above $100,000. It is an incomplete pattern, and needs 2 more large swings higher to complete the full 5 waves. Like with all 5 wave patterns, we have bought on each dip, and continue to buy as long as we stay above critical support.”
As stated earlier, the correction this year was simply too long in time to not adjust our prior price targets. While we still believe Bitcoin can go well into the $100,000 region, we will take a more active stance going forward to protect our gains.
Updated Bitcoin Targets
Our updated target for this next push higher is between $82,000 – $106,000. There are now two scenarios that we are tracking, which will determine our risk management:
- Red – We push into the $82,000 – $106,000 region, completing the minimum number of waves required within this bull cycle. This will end the large degree bull market that started in 2018.
- Green – After pushing into the $82,000 – $106,000 region, instead of topping in the 5th wave, we are topping in the 3rd wave. We then see another multi-week to multi-month correction that holds over $41,156 – $47,750, which eventually leads to the final 5th wave taking us well into the $132,000 – $190,000 region.
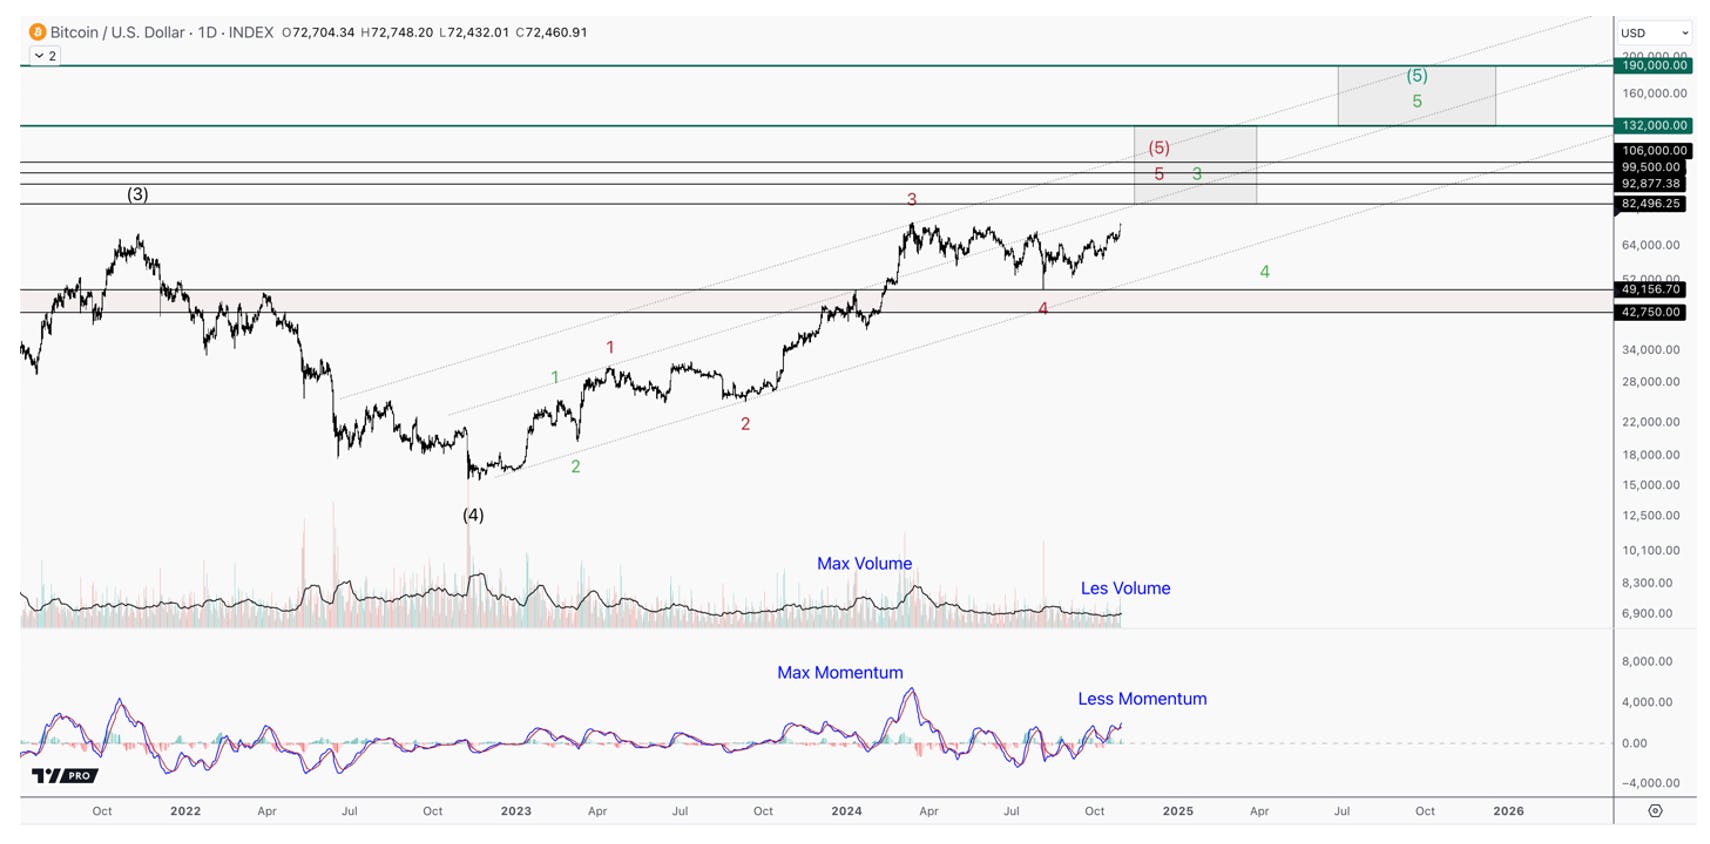
We do believe the next breakout will likely be limited, and that another correction will soon follow. To support this, note when price went vertical in February, which was met with max volume and max momentum. This is what 3rd waves look like. It is the part of the trend where everyone realizes, at once, the direction of the market. This leads to shorts covering, and longs buying more, putting everyone on the same side of the market.
The common characteristic of a 5th wave, which is the final swing in a trend, is that price makes one more high, but on less volume and lower momentum. From a sentiment perspective, the start of a 4th wave consolidation is when smart money exits. The 5th wave tends to happen when investors that are late, want to get exposure to what is believed to be a continuation of the trend. This explains why price goes higher with reduced buyers and weaker momentum.
Note these patterns in play in the chart above. We are clearly in a 5th wave, which will give way to more volatility when it completes.
Confirmation of 5th Wave Targets
To further support our new targets, the pattern of this new swing is also pointing to the same region. If we zoom in on the current bounce we are in, it is taking the shape of an ending diagonal pattern. This pattern only shows up at the end of a move, which fits with us being in some type of a 5th wave.
An ending diagonal consists of 5 waves with large overlaps. The 3rd wave is targeting $74,000 – $82,000, and the final 5th wave is targeting the $82,000 – $106,000 region. As long as any volatility stays above $60,800 – $58,800, I expect us to push into these targets.
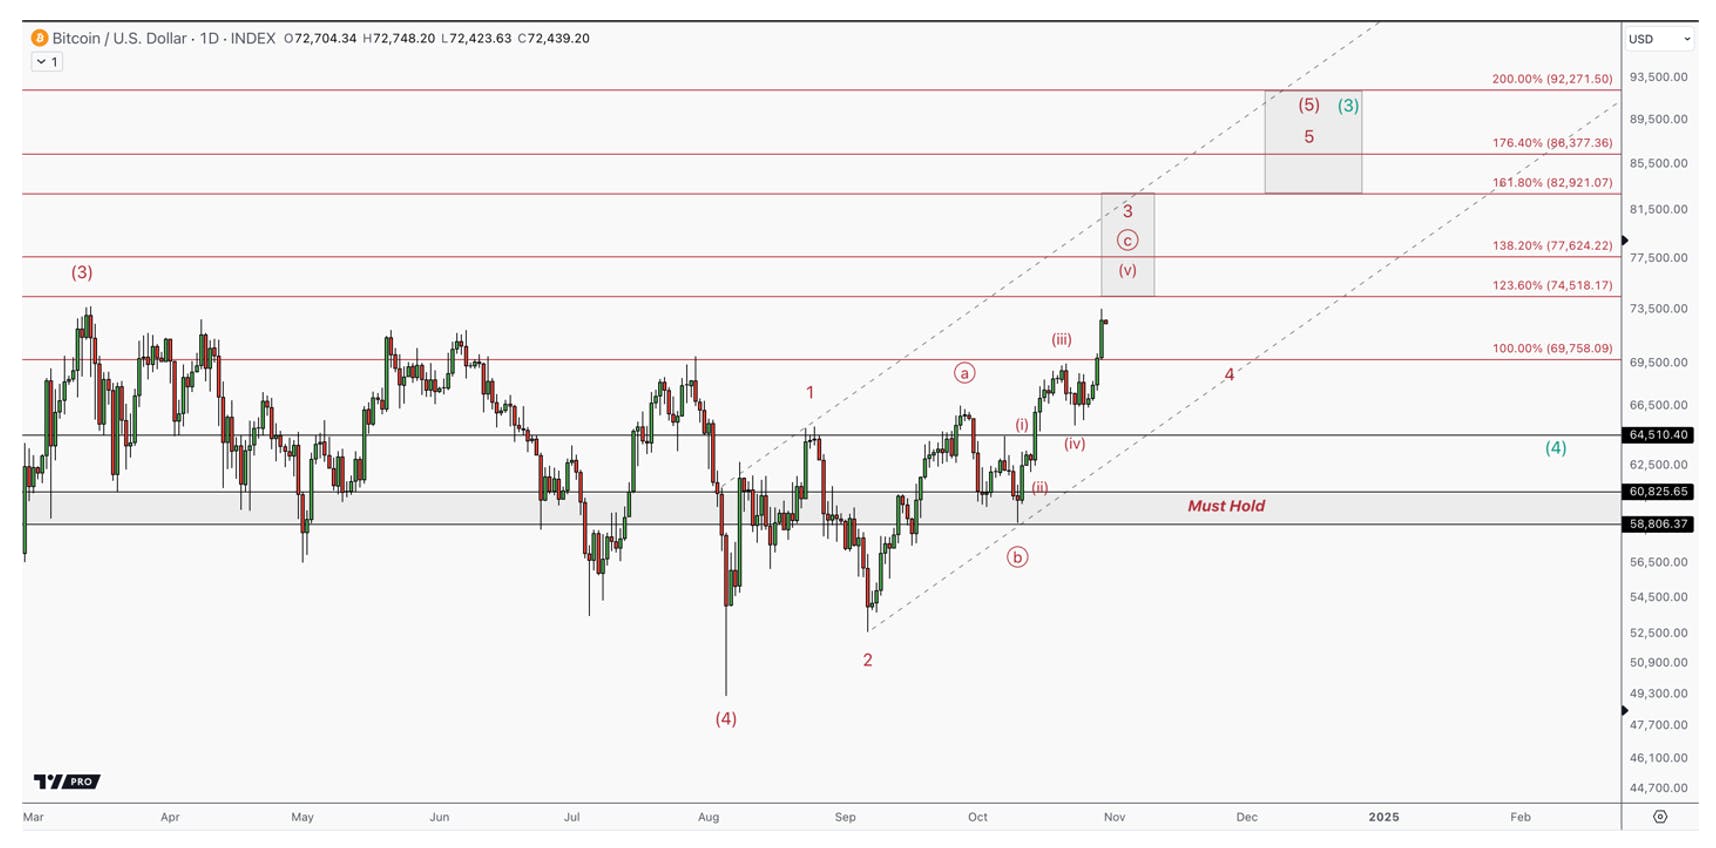
As of now, we have provided 13 buy alerts to our premium members at the $17,000, $26,000, $33,000, $40,000, $55,000 and $62,000 regions. These unrealized gains range from +300% to 15%, based on our buy alerts. Our game plan is to reduce risk, take well deserved gains on this next push higher. Once we approach these upper targets, we will enter distribution mode. We will then analyze the next pullback to determine if the more bullish scenario in green is likely to play out. If so, we will add back at levels that are lower risk.
On-Chain Analysis
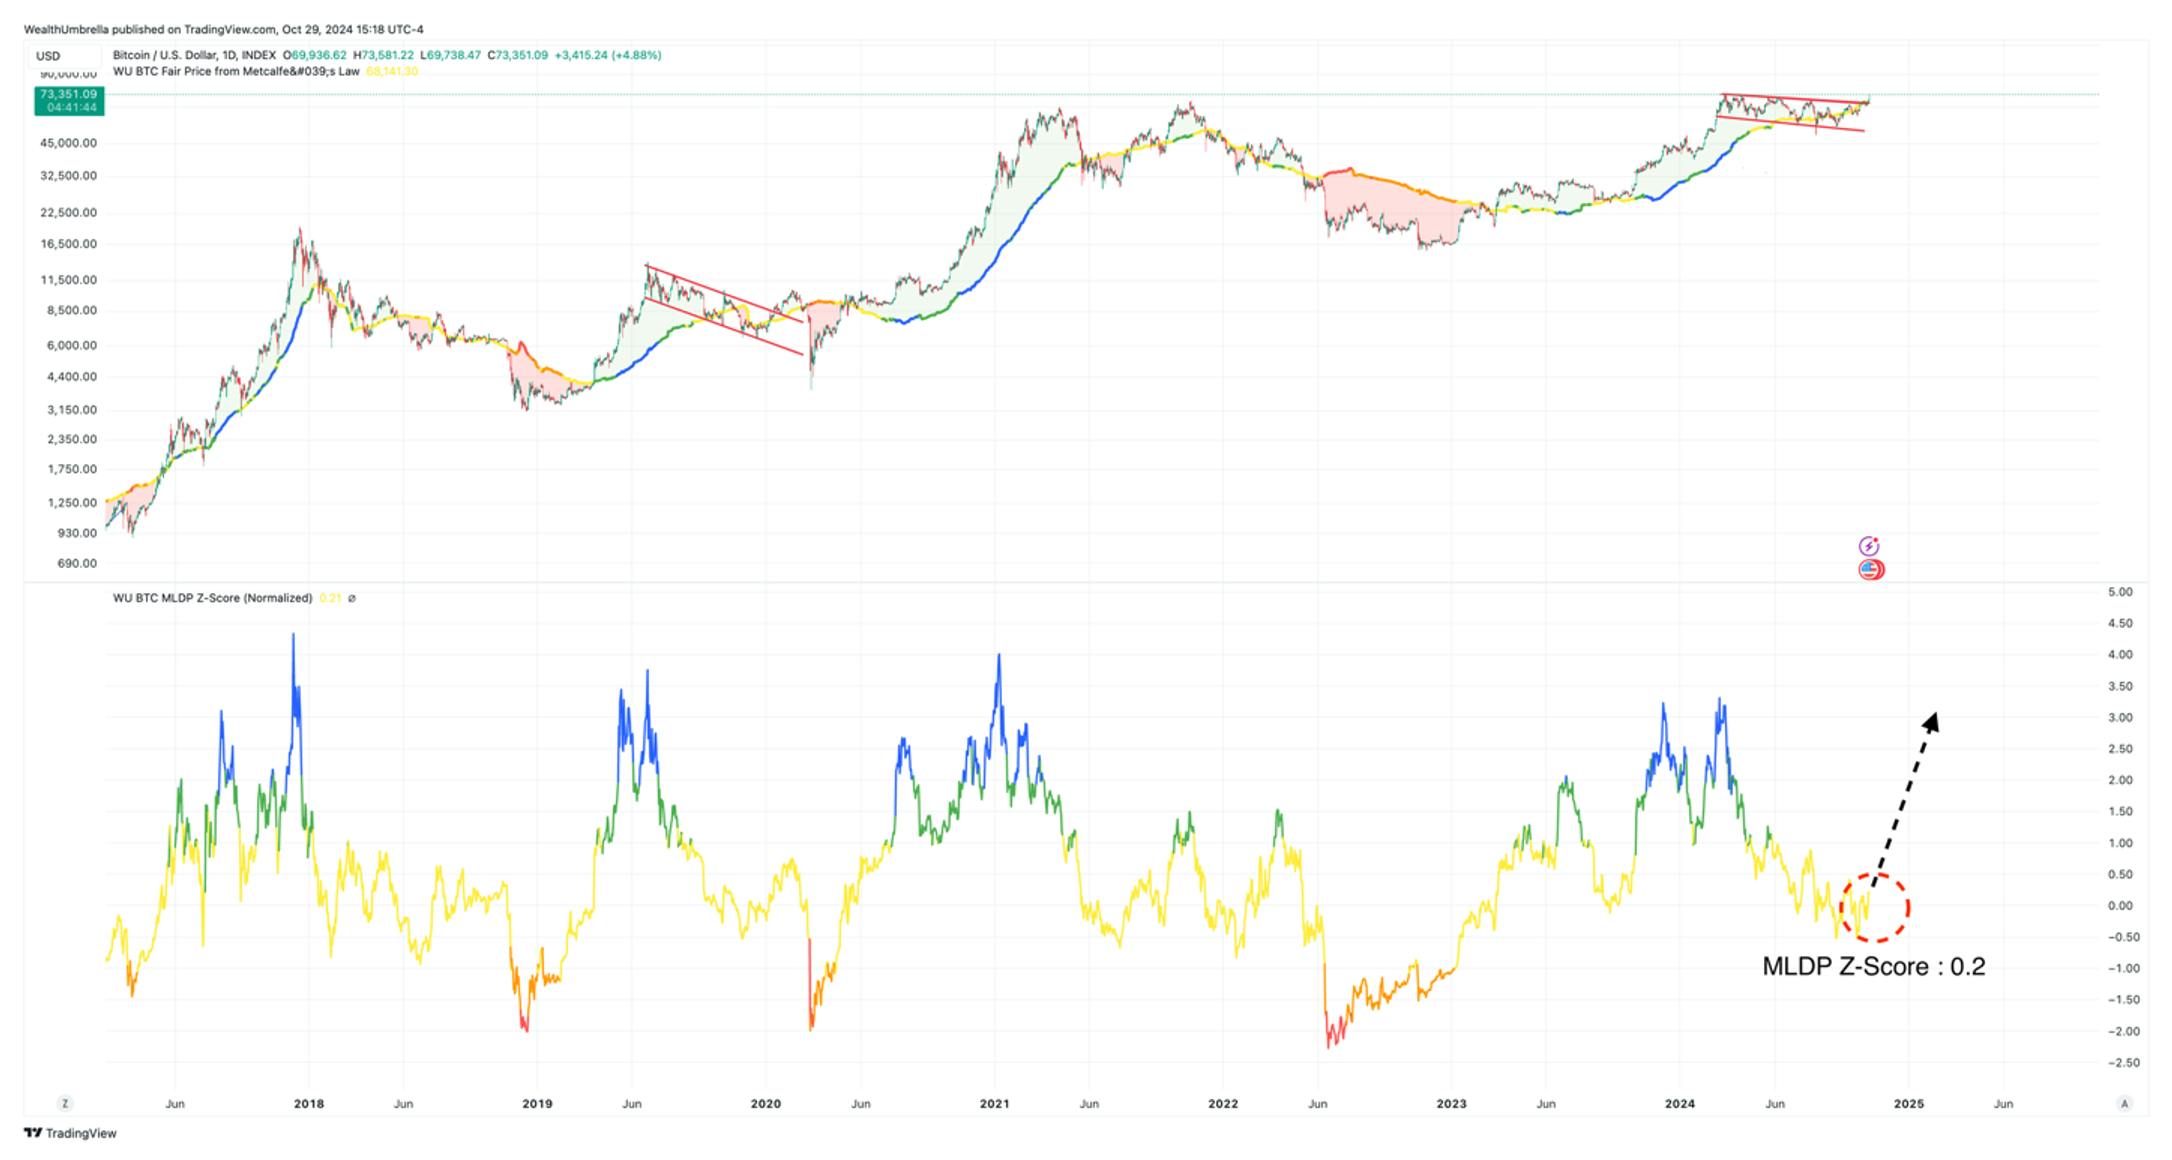
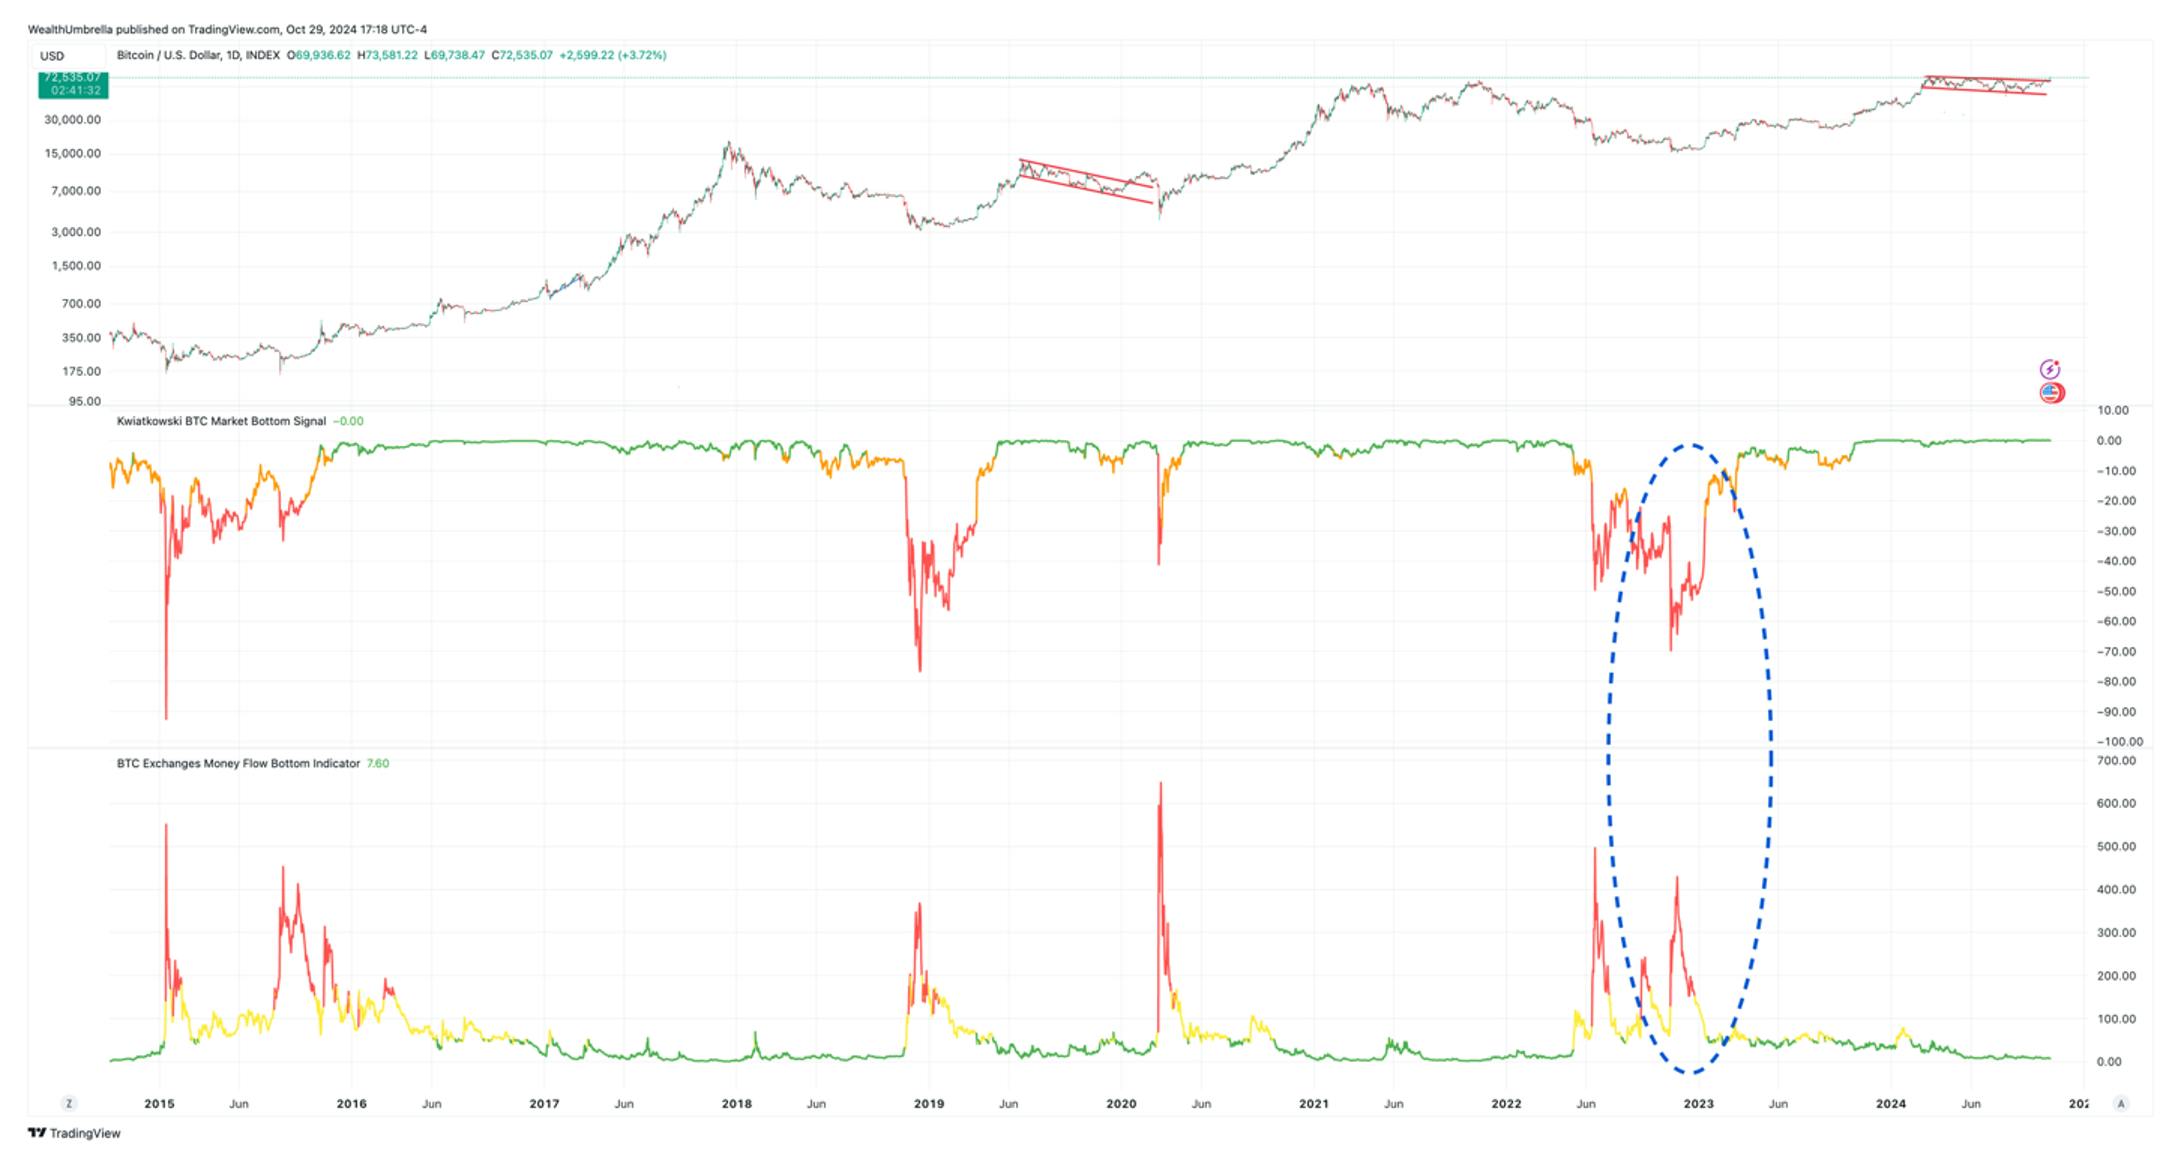
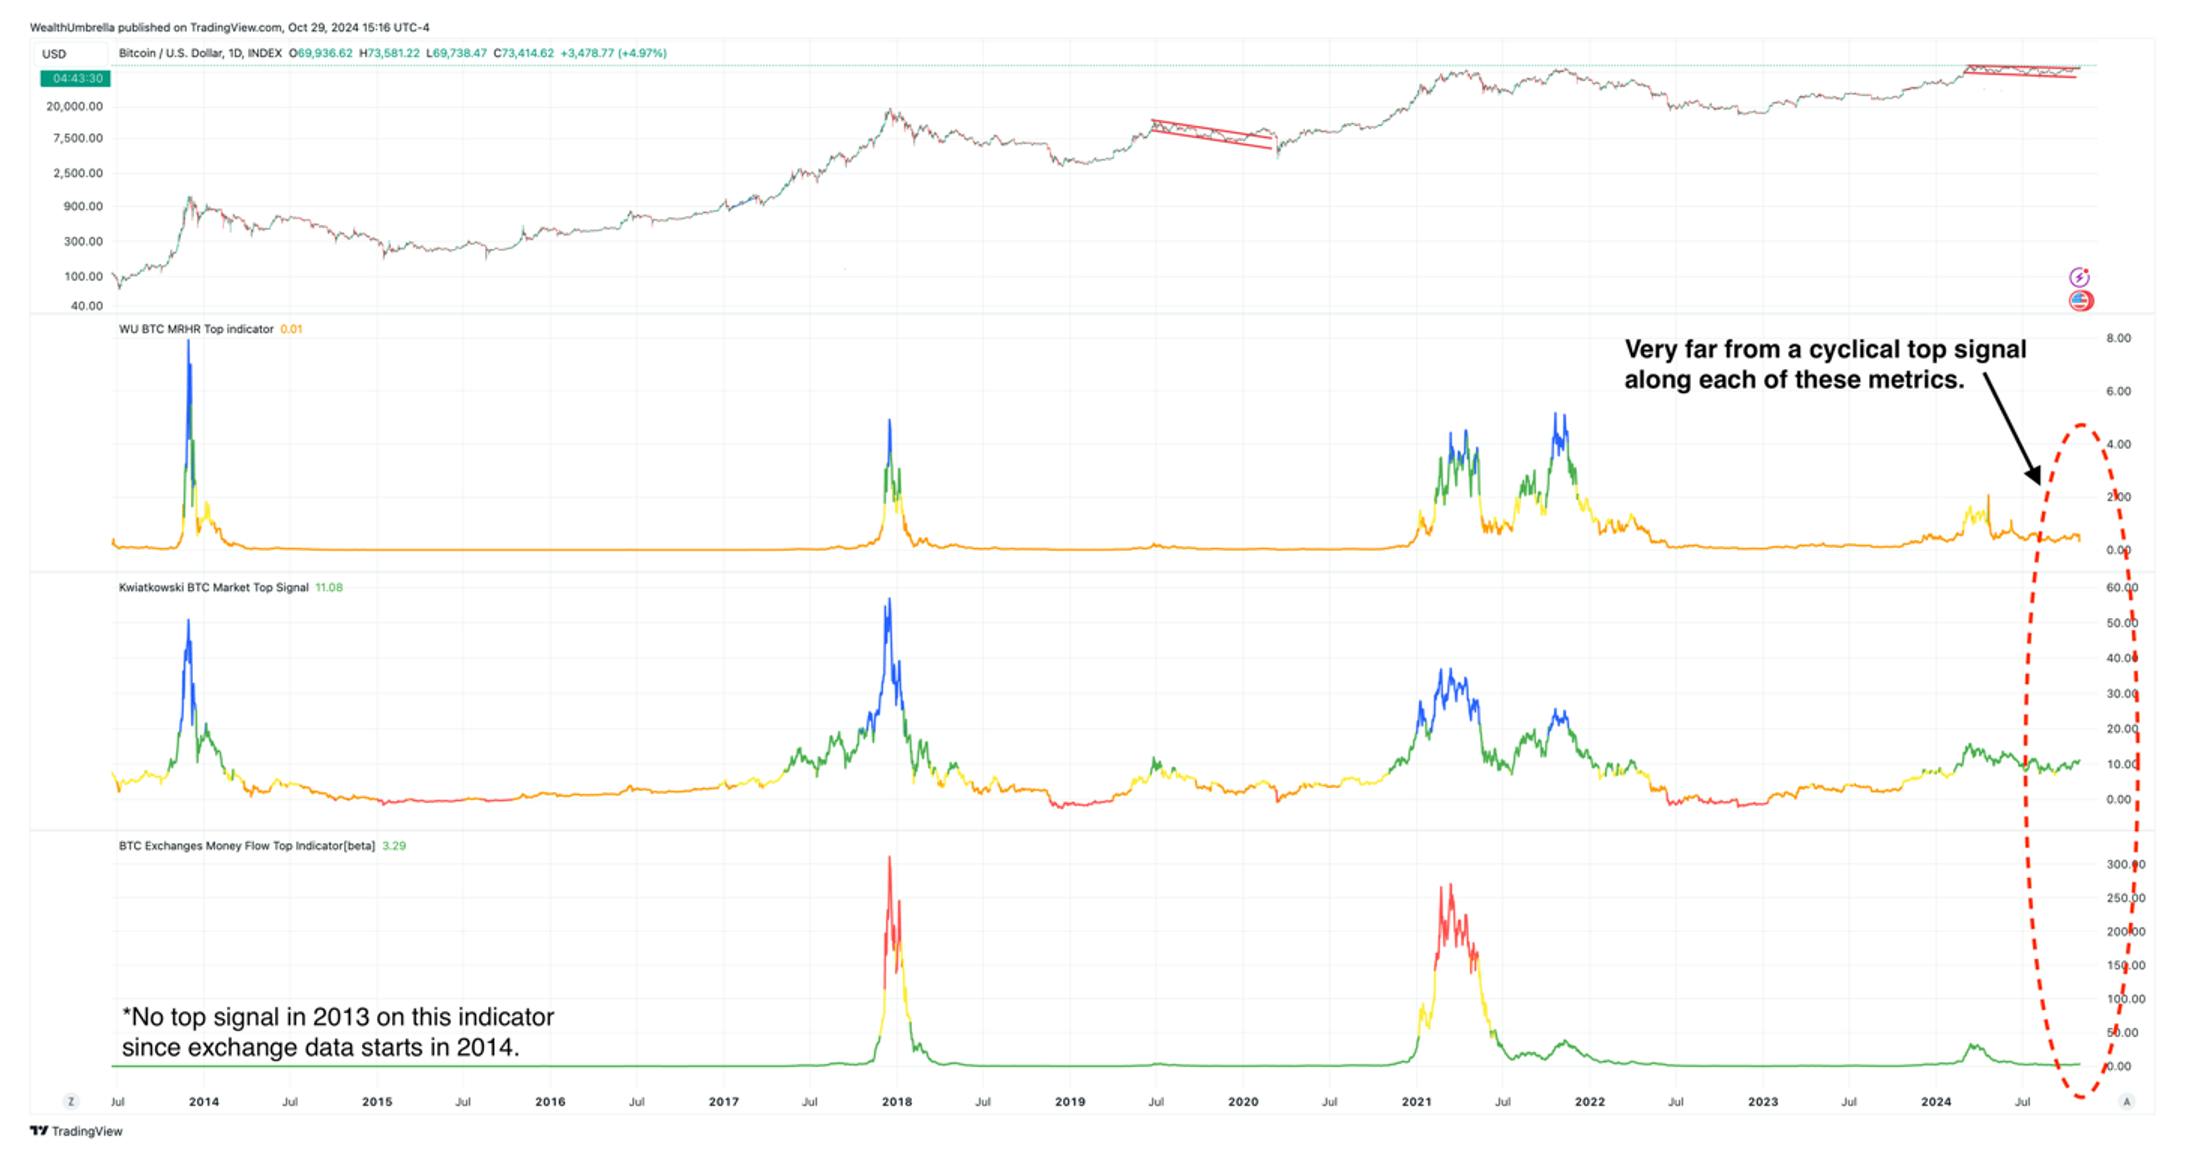
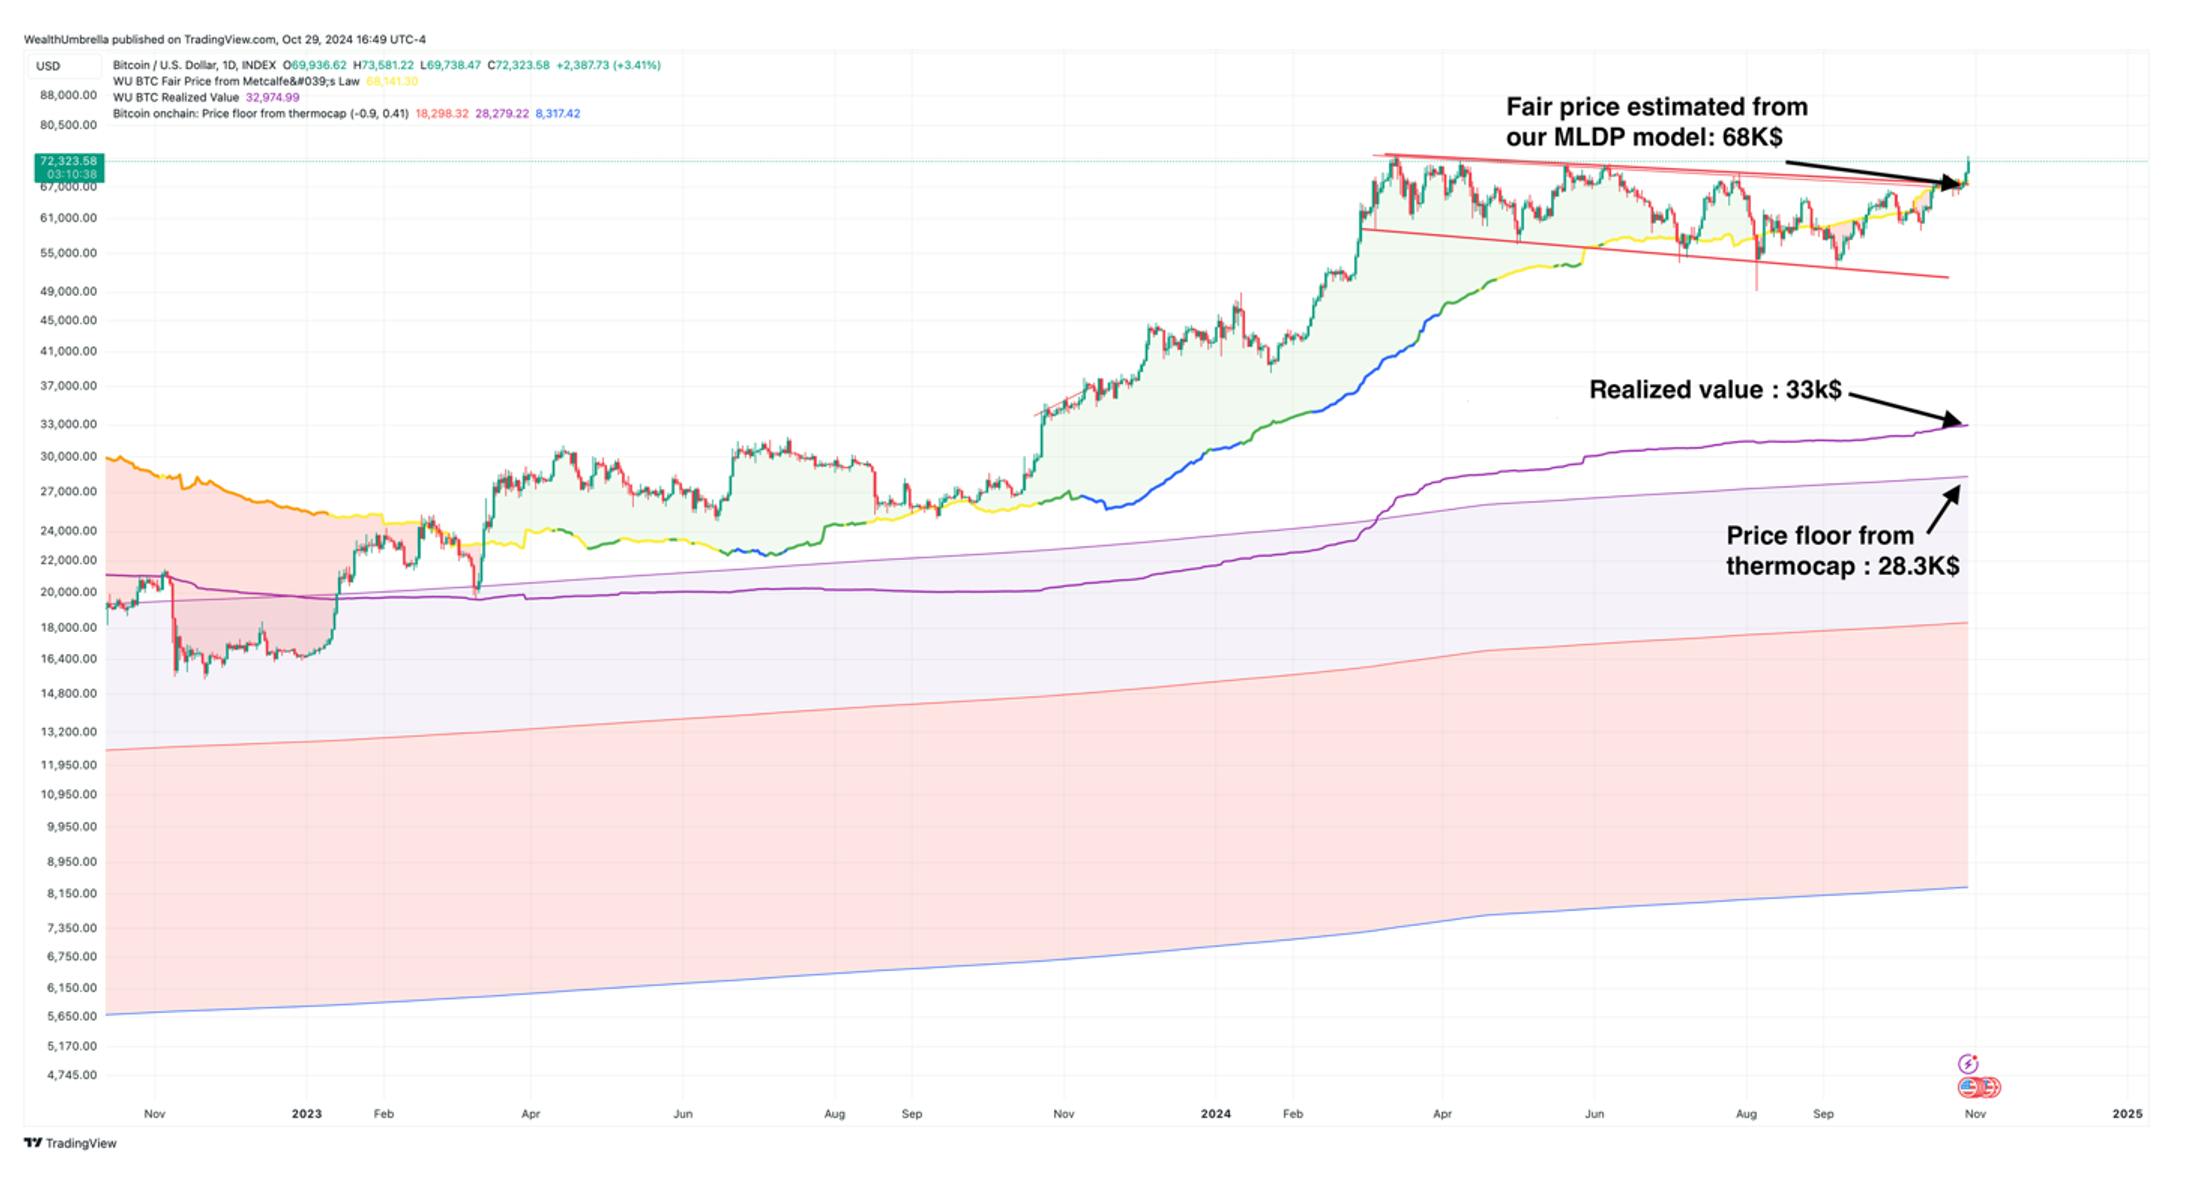
For those that are not familiar with on-chain data, it offers a unique type of fundamental analysis within crypto and is a relatively new field of study. We partnered with WealthUmbrella, a team of machine learning engineers and professors, to provide this level of analysis within the crypto space. The below was provided to us by Vincent Duchaine, the CEO of WeathUmbrella, and interestingly, they are arriving at the same general conclusions as our technical analysis.
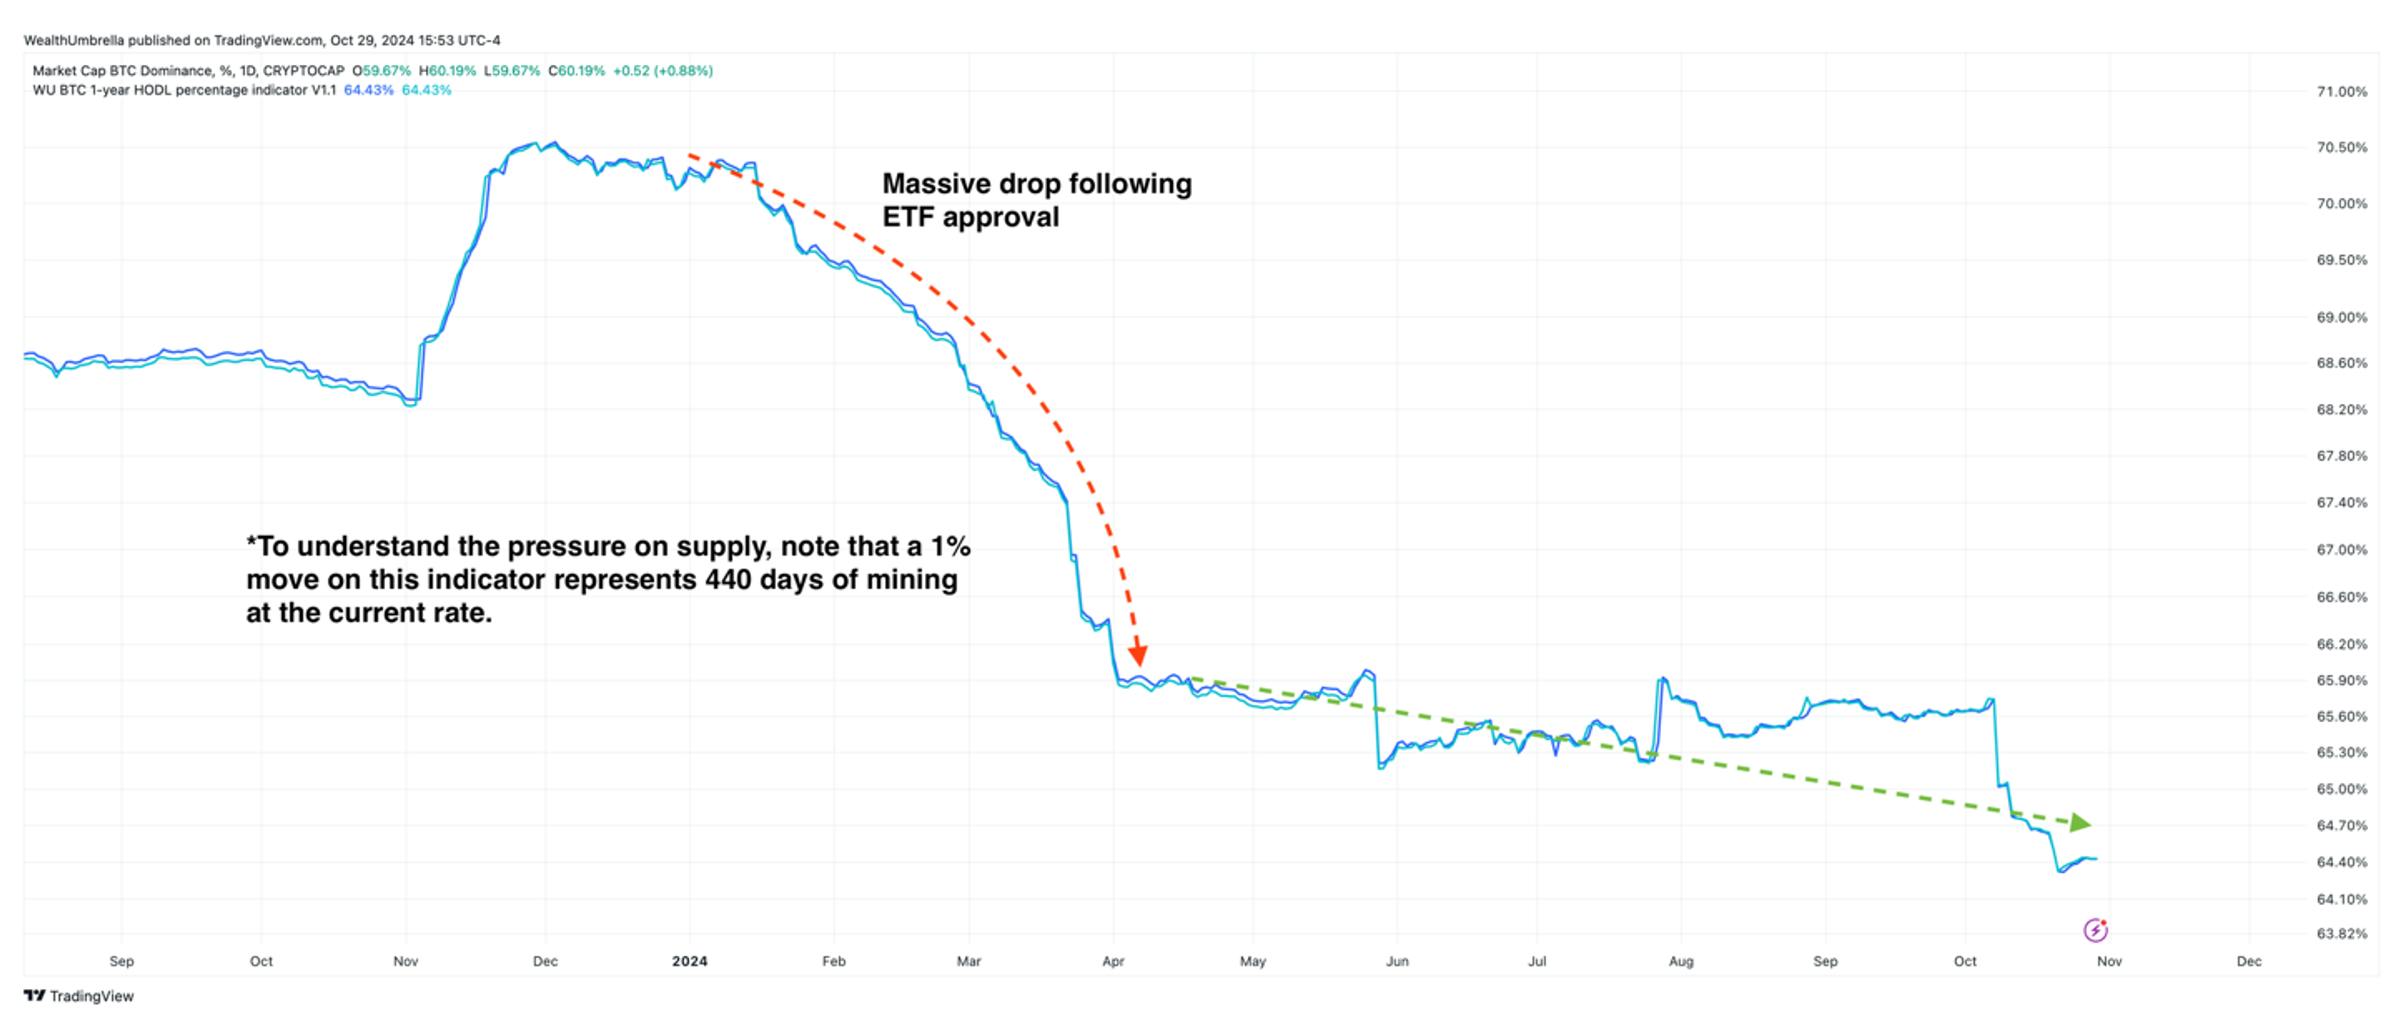
The current imbalance between supply and demand is favorable for a sustained uptrend. This was one of the thematic catalysts that we believed would propel Bitcoin over $100,000, and it is still playing out today. If you look at the ETF flows over the last several weeks, we are seeing buyers move back into the ETFs, creating positive flows.
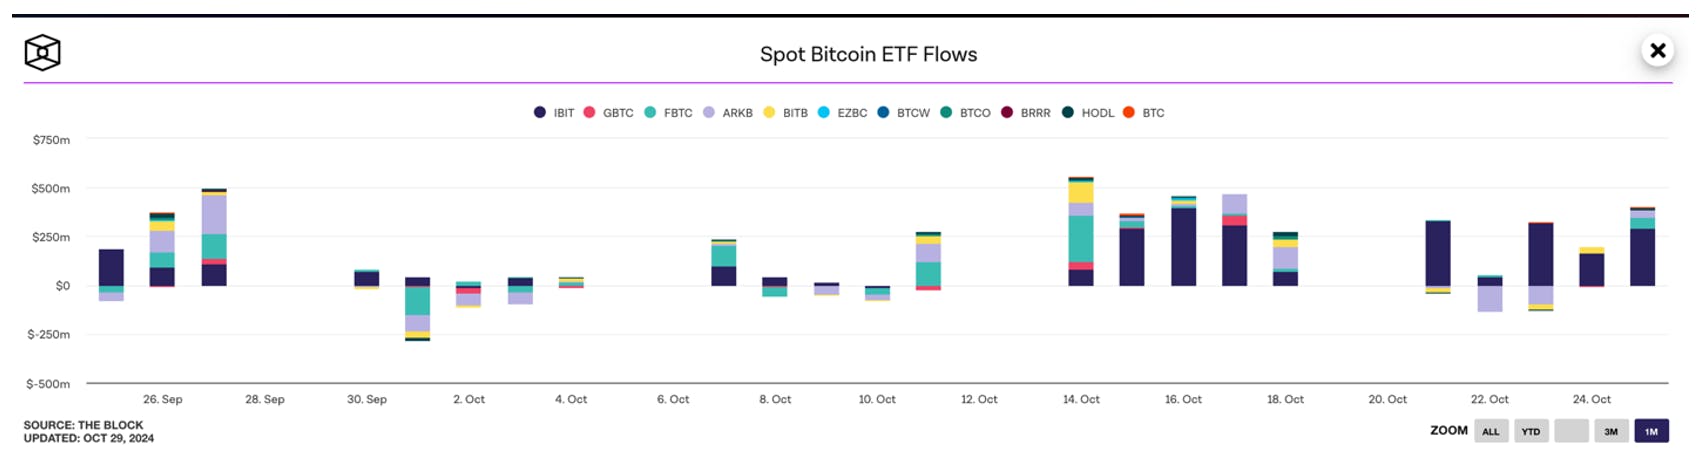
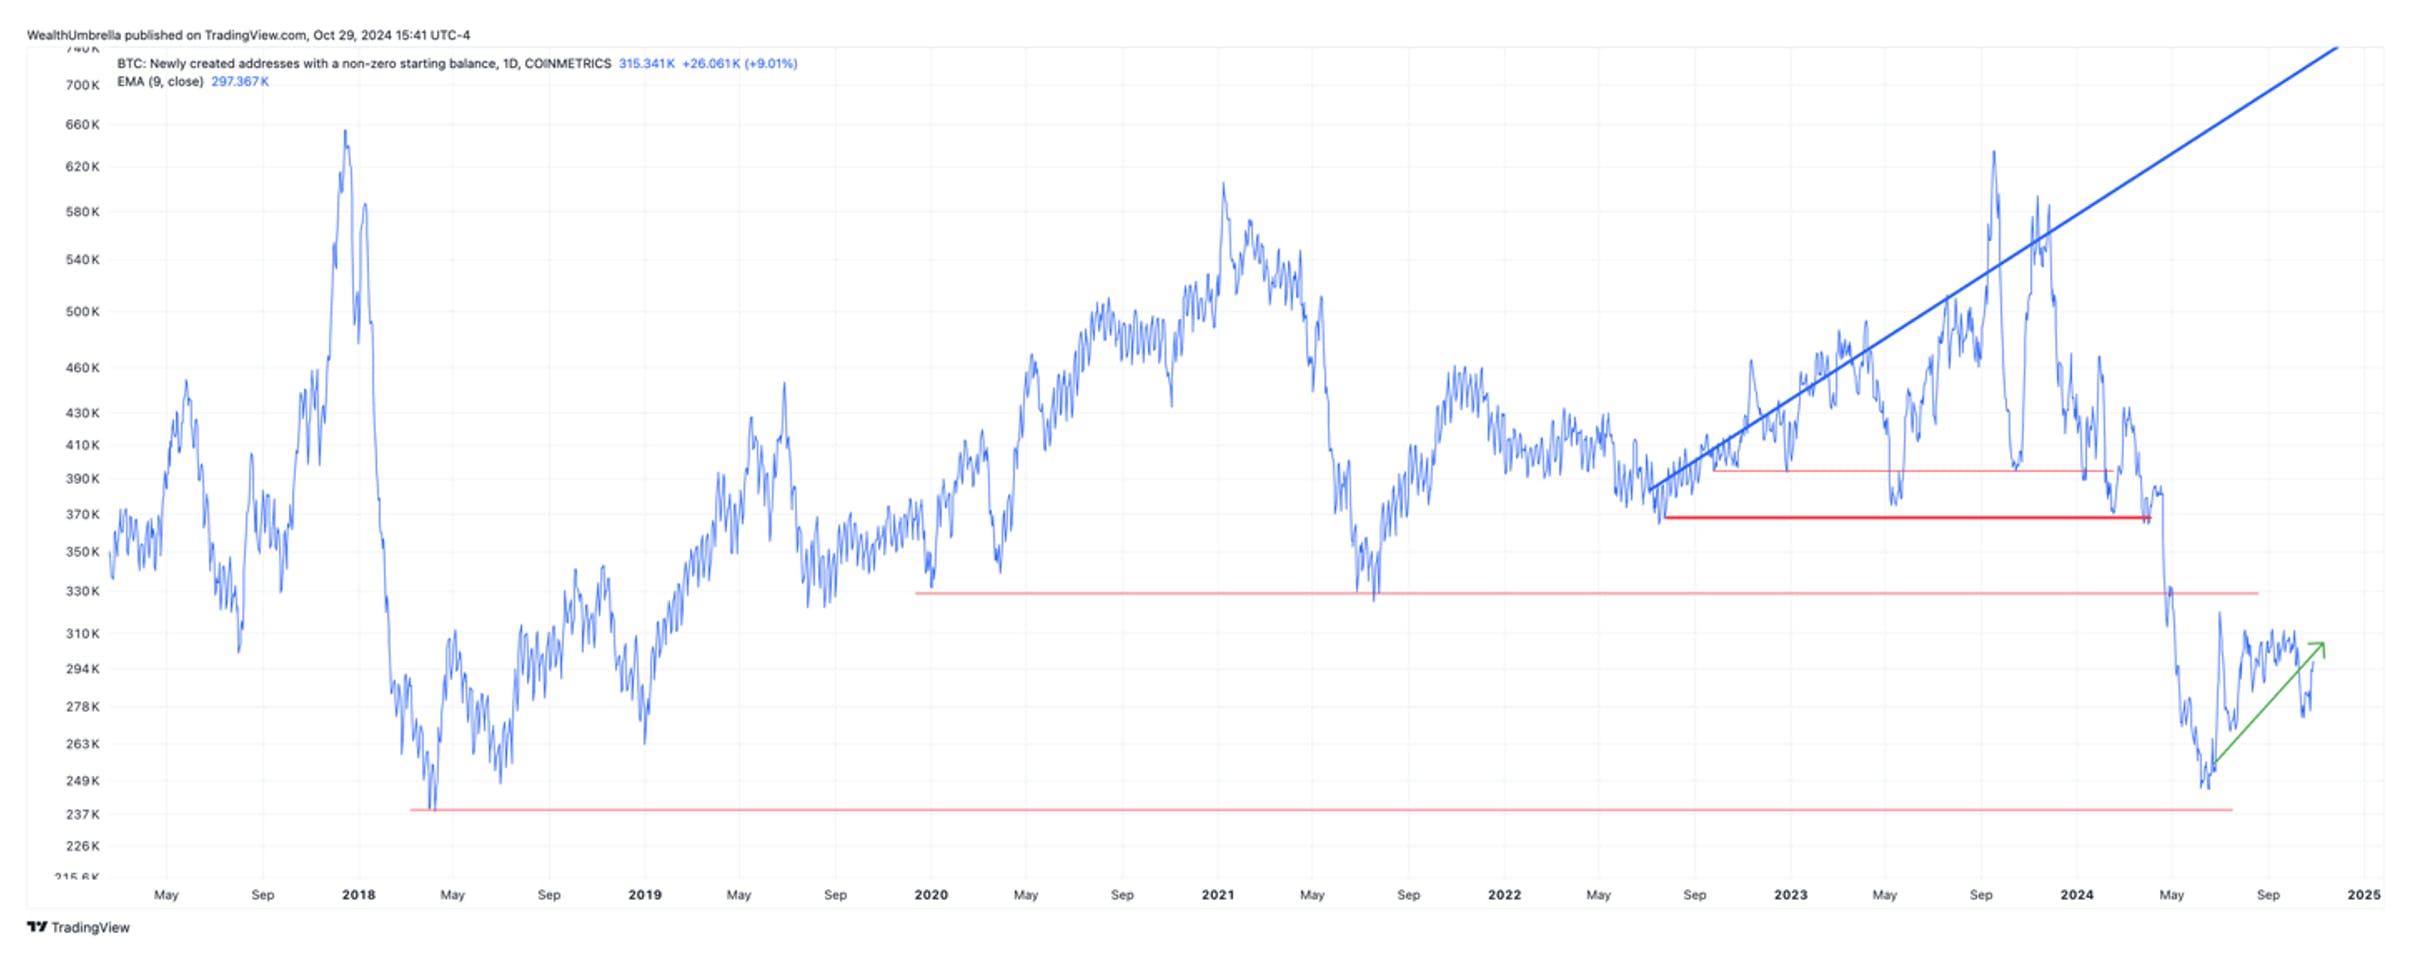
This is further backed up by the amount of newly created addresses on the blockchain with a non-zero starting balance. This metric has also been consistently on the rise over the last 2 months. It is suggesting that new investors are becoming interested in Bitcoin, which increases also demand.