Bitcoin is up 40% in 2023, Here’s Where it Goes Next
February 08, 2023

Knox Ridley
Portfolio Manager
Two months ago, we announced that we are buying Bitcoin in the analysis: “Bitcoin is Going to Rally Again, Here’s What you Need to Know.
Here is what we said on December 9th:
“Though we are in the 4th bear cycle in Bitcoin's history, the prior 3 cycles suggest where we are is a rare buying opportunity. There is ample evidence to support the $15,500 level is either a major low or very close to a major low. Both the technical and on-chain analysis support this.”
Due to technical analysis coupled with the on-chain analysis provided by WealthUmbrella, it became evident that we were at a major low and we alerted our followers to this important moment. Since then, Bitcoin is up 40%, and we view the next correction as potentially another moment when we may add to our position. When we add to our positions, we issue real-time trade alerts plus position sizing for our research members. Our firm is known to navigate Bitcoin’s volatility particularly well even in challenging markets.
Below, we update the new developments in Bitcoin’s price patterns as well as the on-chain metrics that we tend to see around historic lows. We will also take a look at the fundamental thesis surrounding Bitcoin’s utility, and why a globally indebted economy coupled with structural inflation will only benefit from Bitcoin.
Our first sign of this problem happened when the Bank of England abandoned its fight against inflation to support its currency. This was recently followed when we saw signs that the Bank of Japan could potentially lose control of its bond market, as they started bending to inflationary pressures. It appears that central banks are being boxed into a winless corner where they have to choose between fighting inflation or causing a fiscal spiral in their economies. As these problems grow, Bitcoin’s alternative to centralized fiat system will become more attractive, which I believe is showing up in the price action.
The Bank of Japan, Inflation and Bitcoin
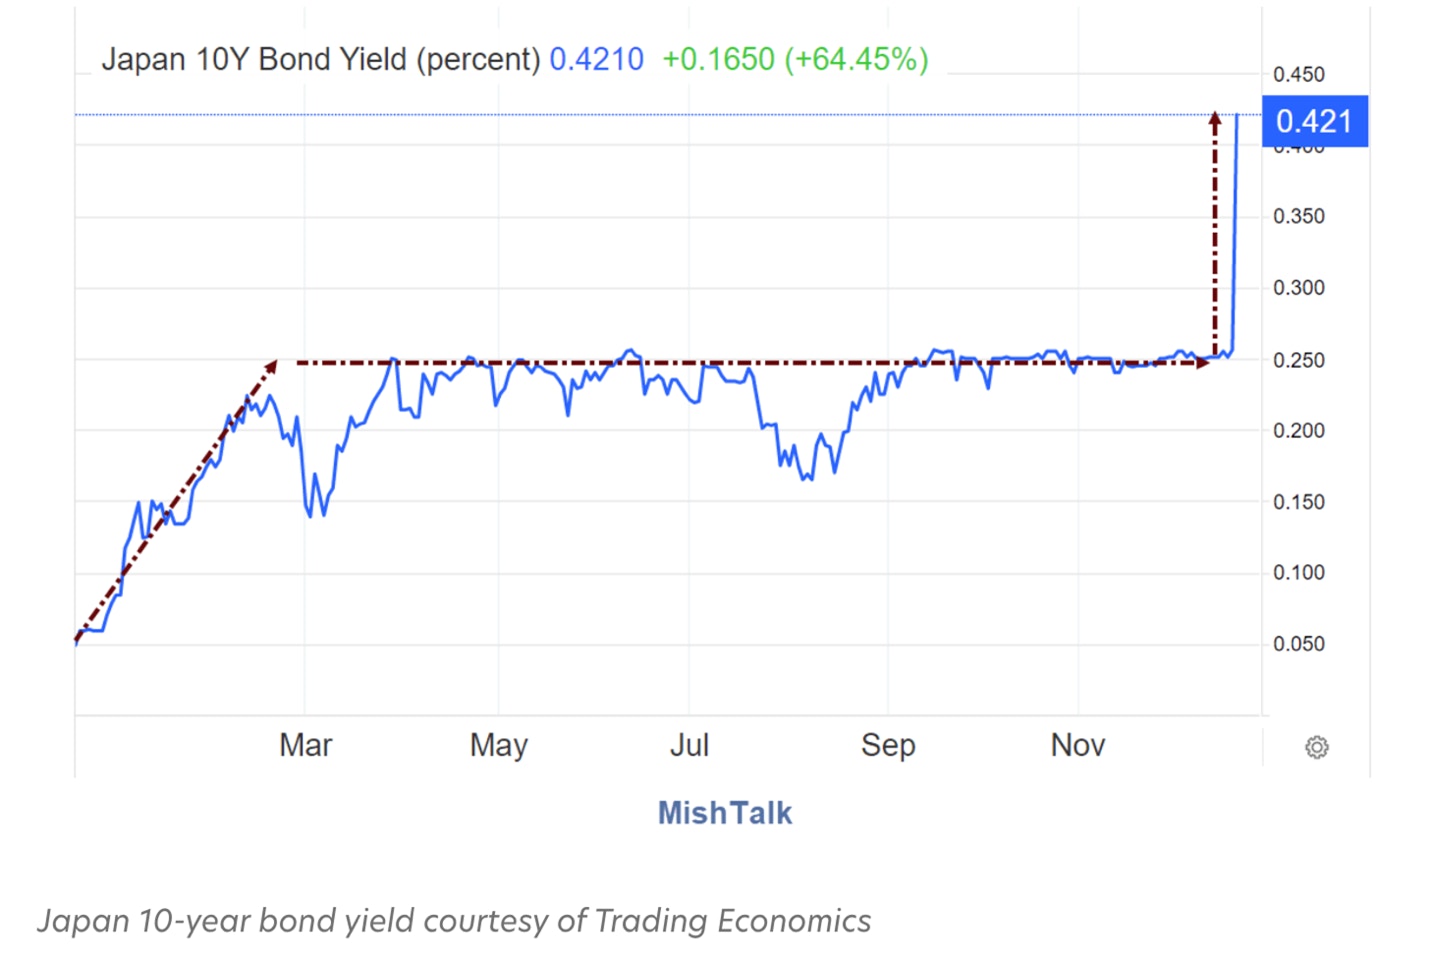
Last month, the Bank of Japan (BoJ) surprised markets by widening their 10-year treasury bond from 0.25% to 0.50%. This may seem small, but this move roiled markets and sent ripple effects across asset classes globally, The reason the change in bond yields had a strong effect is because Japan has excessive public debt, and the concern is it will cost more for Japan to now service this debt.
Most countries are dealing with high levels of debt due to a decade of negative to zero rates. However, Japan’s debt is one of the worst globally with a debt-to-GDP ratio of 262.5%. Like most central banks coming out of the Great Financial Crisis, The Bank of Japan embarked on a series of programs to combat deflationary forces. Unlike most economies, Japan’s rapidly declining population, amongst other factors, had their central banks combating deflationary forces that most of the world did not have to address.
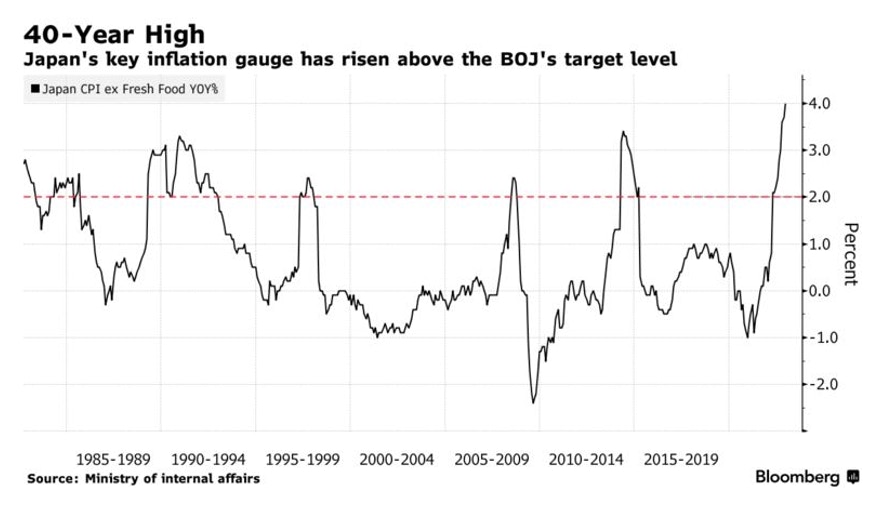
As a result, Japan decided to take central bank engineering one step farther. They set a goal of reaching a 2% CPI at any cost. So, they announced a new Yield Curve Control (YCC) policy. In order to maintain a yield below where the market would naturally price it, the BoJ had to sacrifice their balance sheet to achieve this goal. In brief, any bond that traded over their target, they bought.

One of the by-products of artificially low rates in countries that issued public debt in their own currency was a very high public debt-to-GDP ratio. With rates at a persistently low level, governments were encouraged to borrow under the assumption that inflation will likely always be under control.
What this means is that Japan, as well as other countries with high Debt-to-GDP ratios, cannot tolerate higher yields. The higher the yields, the more it will cost the Japanese government to service these debts. If they go too high, then the Japanese government runs the risk of defaulting on their loans.
This is not a problem as long as inflation is subdued. However, like the rest of the world, Japan is now dealing with a high CPI around 3.7%, which is much higher than their target.

So now, they appear to be approaching the end-game scenario. They have to combat inflation by raising rates, but if they raise too high, the bond market will lose confidence in Japanese debt. This is what happened in England last year when the new administration announced a sweeping spending bill coupled with tax credits in the face of a growing energy problem. In short, the bond market stopped playing ball. As debt got sold and yields climbed, this left the Bank of England no choice but to once again become the buyer of last resort, while having to deal with high inflation at the same time.
If the 3rd largest economy in the world, and second most important currency loses control of its bond market, the Bank of Japan could become one of the biggest stories in 2023. How does this tie into Bitcoin? Bitcoin is viewed as an alternative to the centralized fiat money system. Because it is not centralized, it is not prone to the results of monetary manipulation and corruption. Bitcoin is an easy and secure way out of a country’s fiat system, for better or worse.
Sign up for I/O Fund's free newsletter with gains of up to 221% - Click here
Whether one agrees or not is irrelevant. The perception that Bitcoin is an alternative is what matters, just as the perception that gold is an alternative is important, as well. The more problems that unfold with the inevitable crumbling of the global fiat money system in light of systemic inflation, the more a country will likely adopt it.
We see a definite correlation between corruption and crypto adoption. This is a correlation that has persisted for years.

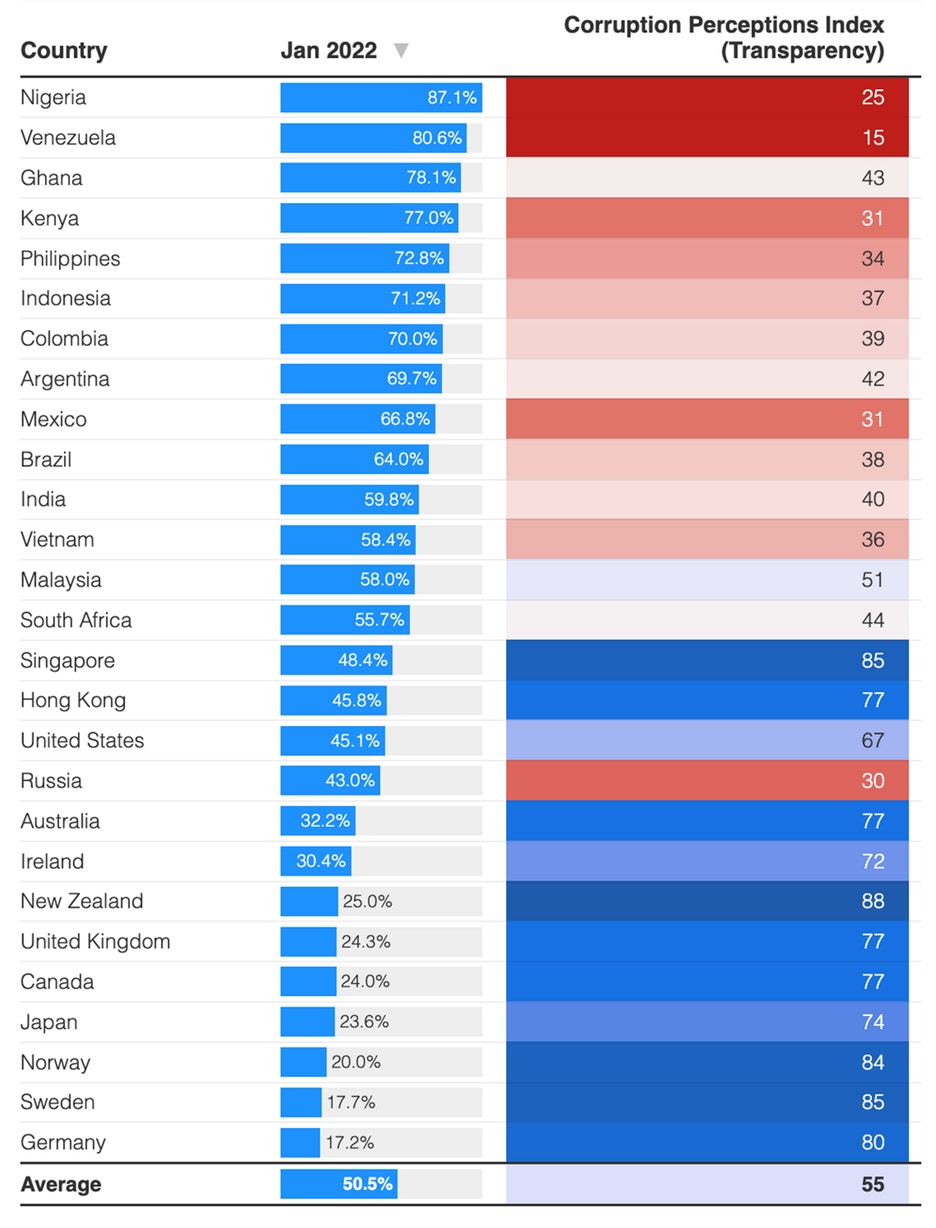
The reason for this correlation is because with systemic corruption comes economic hardship, heightened inflation, and in some instances, hyper-inflation. Prior to Bitcoin, citizens have historically had no convenient way out of their country’s currency, so they have been trapped.
Not all economic hardship is the result of corruption. We’ve seen global central banks embark on the greatest monetary experiment in human history, marked with countless policy errors and questionable decisions. In the U.S., we see a clear correlation between the strength of the U.S. Dollar and Bitcoin.

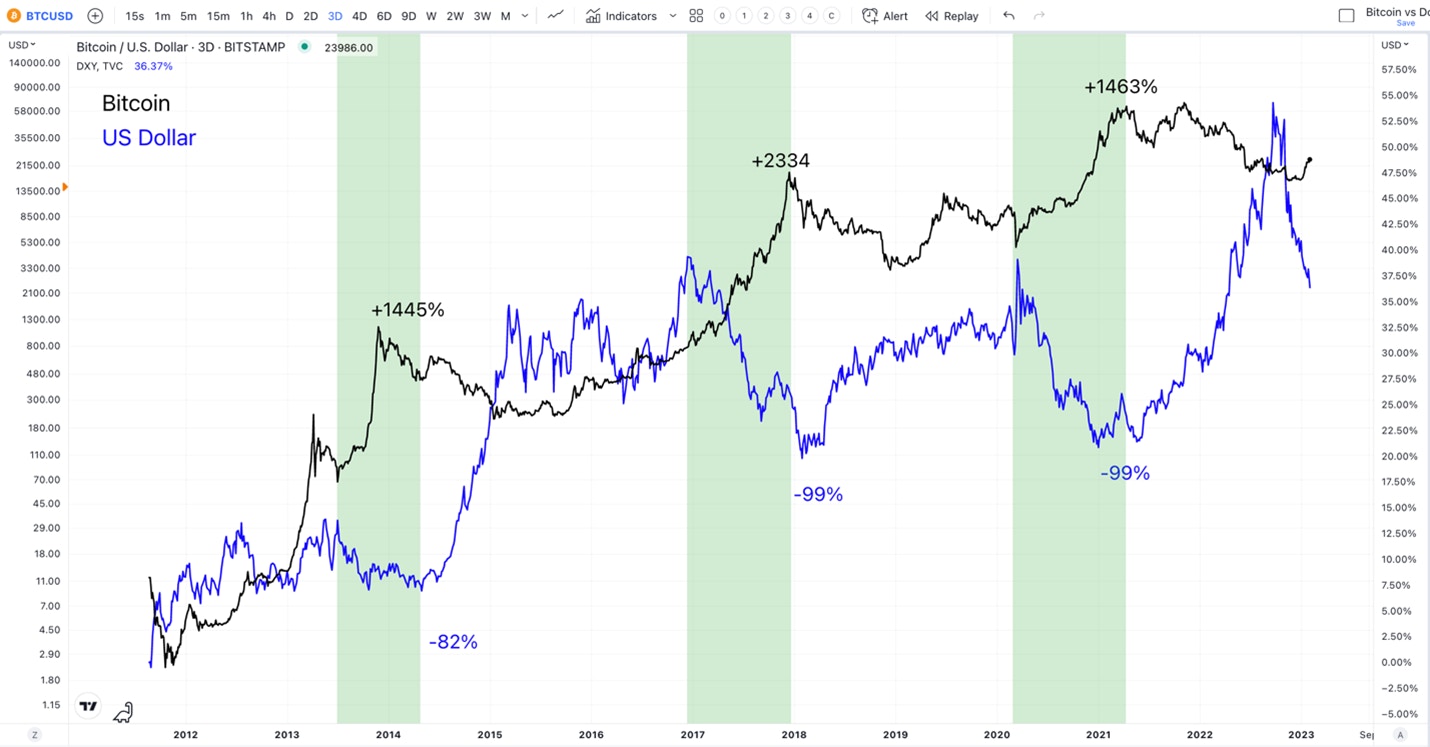
When the dollar is weak, or we see the FOMC flinch in light of needing to tighten, Bitcoin catches a bid. So, clear correlations and utilities are being developed with Bitcoin that lines up with the monetary issues unfolding. We only expect this relationship to strengthen into 2023 and beyond. Structural inflation is likely here to stay, which means that global central banks will inevitably follow Japan in Yield Curve Control programs to prevent a fiscal spiral. There is simply too much debt in the system, and not enough buyers of new issues. This will only improve Bitcoin’s attractiveness.
On-Chain Analysis
Bitcoin does not have earnings reports. You cannot do classic fundamental analysis on this asset to help determine underlying strength. For this reason, crypto has been leaning on technical analysis predominantly, until recently. Some researchers have uncovered that Bitcoin offers its own unique form of fundamental data found on the public blockchain. This data, called on-chain data, allows us to track several patterns that can provide clues to major turning points. The following data was provided by Vincent Duchaine of WealthUmbrella, whose company has developed an automated algoriths to help retail investors navigate risk-on and risk-off environments.
In the previous article, we noted that various on-chain indicators indicated that a bottom was likely.
“Overall, most on-chain metrics from any layers of the Bitcoin ecosystem is providing rare readings that tend to flash around major bottoms.”
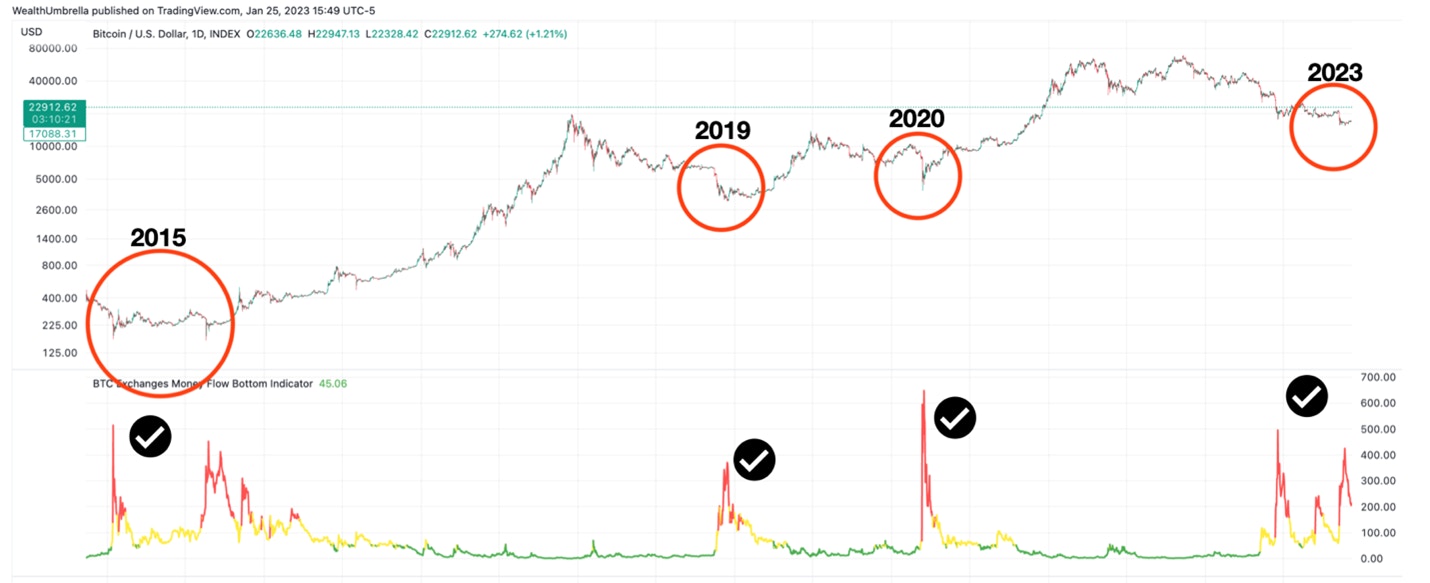
Specifically, the indicators tracking money flow into and out of exchanges saw a peak in June 2022, which was the third highest recorded in bitcoin history. Despite the FTX incident in November, this indicator was forming a lower high, which suggested that fear was fading.

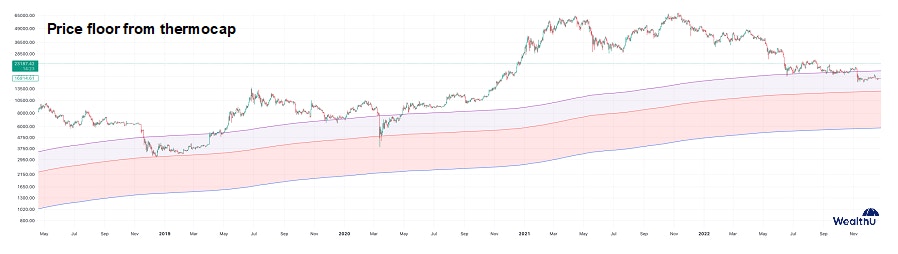
Additionally, Bitcoin’s price was within a range that we rarely see, and has historically marked major lows. What the below range is measuring is the relationship between Bitcoin’s market cap (price x the number of coins in existence) and its thermos cap (price of each coin when it was last purchased x the number of coins in existence). Bitcoin’s price was in the middle of our “value-zone” that has marked larger turning points in the past.

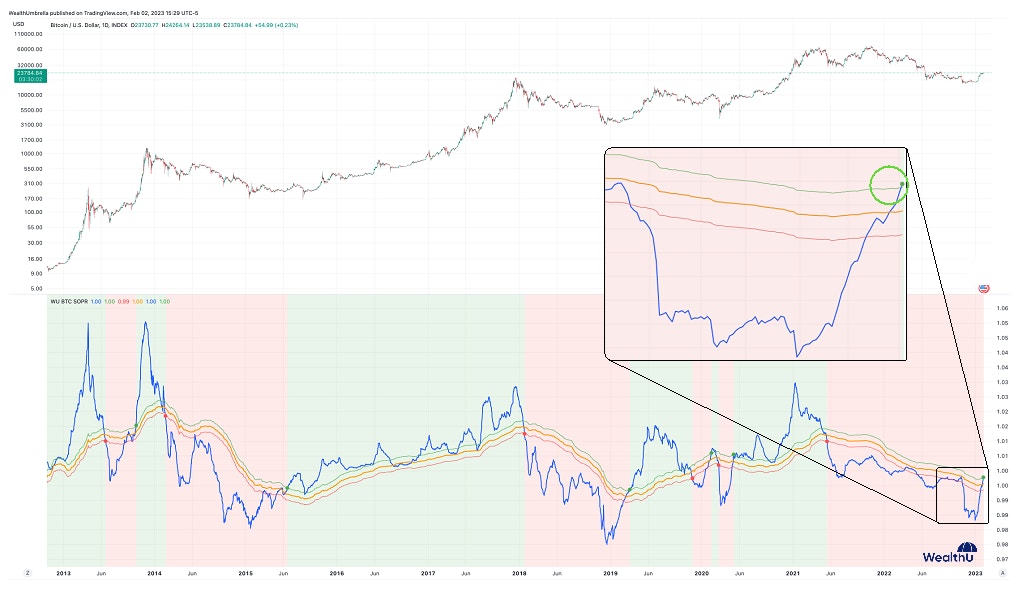
Further evidence that a new bull cycle is developing can be seen with the Spent Output Profit Ratio (SOPR). This is calculated by examining all daily transactions on the Bitcoin blockchain and determining if the coins were exchanged at a profit or loss based on the price at the last time they moved. A ratio of 1 indicates that all bitcoins moved on a given day were sold at the same price as they were bought. A ratio over 1 means that on average people sold at a profit, and under 1 means at a loss.
Sign up for I/O Fund's free newsletter with gains of up to 221% - Click here
The SOPR signal can be noisy on a day-to-day basis, but when filtered correctly, it can be a good indicator of the current market phase. It can prematurely signal a top and may lag in signaling a new uptrend. As of last week, this signal flipped positive, and it is worth noting that it has not given any false signals throughout the history of bitcoin, despite sometimes being late in calling an event.

The above analysis is only a handful of metrics used to improve our odds at catching a new bull cycle. The final piece of evidence will come from the developing price pattern from the 2022 low. As of now, we only have 3 waves up off the recent low. We need this to get to one more high to complete the much anticipated 5 wave pattern that tends to mark a bigger trend reversal. If we do get that last push higher, the following pullback will be where we add to our position.

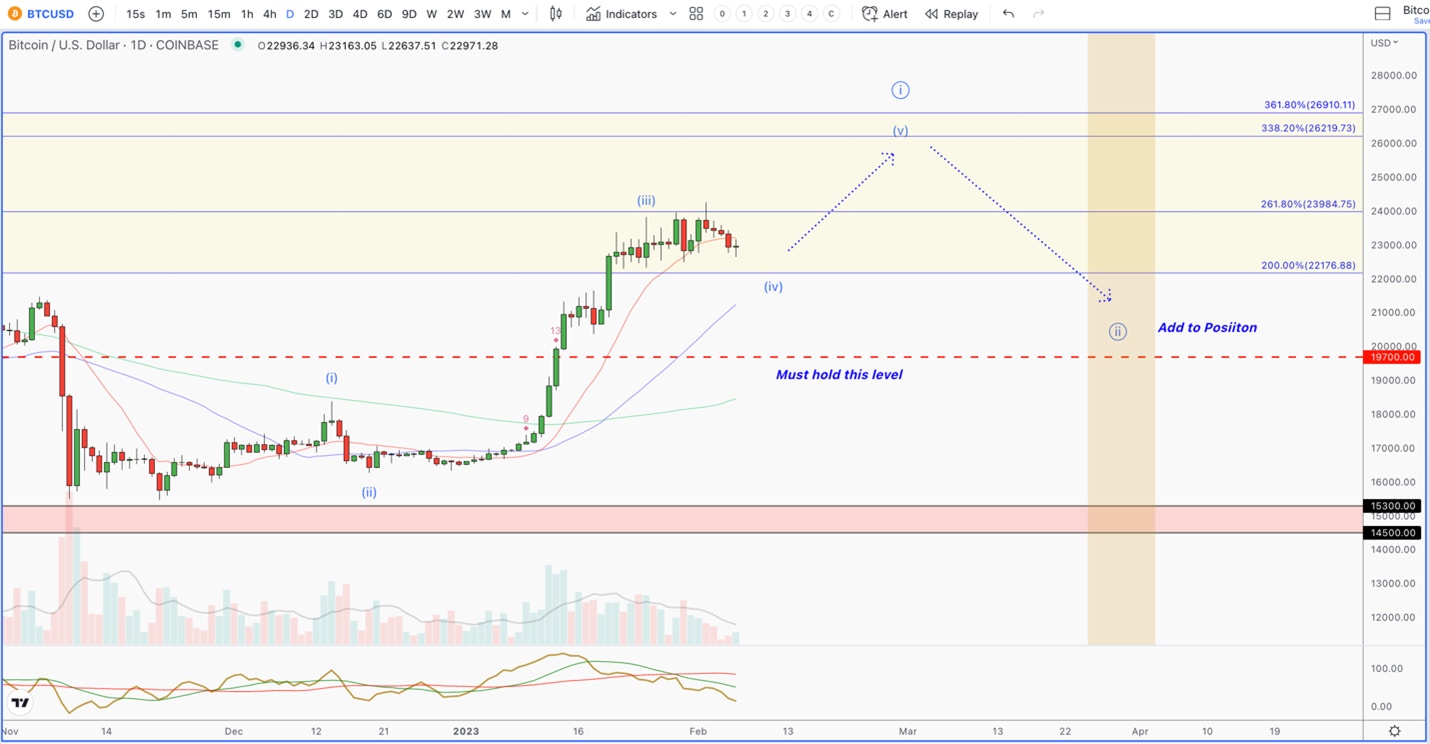
In conclusion, our multifaceted analysis into Bitcoin is supporting the likelihood of a larger trend reversal. This is not confirmed from our end until we see price make that last high in the coming weeks towards the $25,600 region. Interestingly, this new bull cycle is coinciding with a weakening US Dollar. Also, it is accompanied with more central banks being boxed into inescapable corners. Structural inflation is likely here to stay, and it will not be easy for indebted country’s to control this.
This will only lend support to Bitcoin’s original thesis that there is no need for the trusted middle man within a peer-to-peer transaction. Centralizing our monetary system allows for corruption, and policy mistakes that can, and do, lead to 2008-style events. The deeper we go into the Central Bank monetary experiment, the more apparent it is this idea has become 15 years later.
This Thursday, 2/9/23, at 4:30 pm EST we will host our weekly webinar where we go through various broad market charts, as well as individual tech stocks we are targeting for entry and exits. We also provide a weekly update into Bitcoin that will help our premium members better manage risk. An example of this is when we put out an alert to sell Bitcoin when it topped last March (behind paywall) with some discussion on social media leading up to this trade alert. I/O Fund provides real-time trade alerts and an audited, actively managed portfolio. Learn more here.


More To Explore
Newsletter

Big Tech’s Free Cash Flow is Turning Negative – Who's Next?
Big Tech’s AI revenue is accelerating, but free cash flow is moving sharply in the opposite direction. Across Google, Microsoft, Meta and Amazon, capex is rising much faster than operating cash flow a

Big Tech Earnings Preview: Is AI Monetization Finally Catching Up to Capex?
The most pronounced difference between 2026’s tech rally compared to rallies in the past is which companies have been left out of it. The names most associated with the AI trade have hardly participat

Nvidia, CXL, and the Battle to Improve AI Inference Economics
This is Part 2 of our two-part series on AI inference economics. In Part 1 — Why Nvidia's Next AI Battle Is About Tokens per Watt, we laid out why tokens per watt has become the defining metric for in
Why Nvidia’s Next AI Battle Is About Tokens per Watt
As hyperscalers move from building AI infrastructure to monetizing it, tokens per watt helps to reflect if revenue is scaling and if profitability is improving. Offload engines can increase tokens per
Micron Is Up 900%. Here’s Why the AI Memory Trade May Still Have Room to Run
Over the past 10 months, memory chip stocks have gone from being solid beneficiaries of the AI boom to capturing a massively outsized piece of the return pie. The inflection in Micron’s performance de
Why the S&P 500 Shrugged Off the Iran War — and What Could Finally Break the Rally
On February 28th, the U.S. went to war with Iran, and the market was handed the kind of shock it hasn't contended with for years. The conflict set off a chain reaction across the region: an ongoing su

Nvidia, CoreWeave, and Nebius: Inside the Circular Financing of the GPU Boom
Neoclouds are one of the more hotly debated AI business models, with CoreWeave and Nebius being the two most widely recognized names. These companies have seen their sales, backlog, and share prices s

AMD, Nvidia, Arm, Intel: Inside the $120 Billion CPU Gold Rush
CPUs have gone from an afterthought to becoming the AI trade’s next great bottleneck – and with AMD, Nvidia, Arm and Intel circling a market that is doubling nearly overnight, the only question left i

Google TPU v8 vs Nvidia: How Inference Is Rewriting the AI Market
In April, Google announced it would begin selling its TPUs to select third-party data center operators, which is something the market has anticipated for nearly a decade. The TPU-versus-Nvidia-GPU deb

The AI Networking Stock That Beat Nvidia by 7X YTD for Returns of 135% YTD
AI networking stock Lumentum is among the key I/O Fund winners in 2026. We allocated heavily to LITE in January—a month before Nvidia backed the company. While most investors couldn’t stomach taking a
