I/O Fund’s Current View on Bitcoin
July 08, 2022

Knox Ridley
Portfolio Manager

In August of 2019 we released our first premium report on Bitcoin. At the time, Bitcoin was trading between $10,000-$11,000, following a bounce greater than 200% in less than a year.
We believed Bitcoin had provided strong evidence that a meaningful low was put in, and that a new bull cycle was starting. In our premium report, we stated that we expect a drawdown to at least the $7800 region, and that we would wait for this to happen before starting a position. More importantly, we were targeting the $65,000-$75,000 region in the coming year.
Here’s a snapshot of our 2019 report:

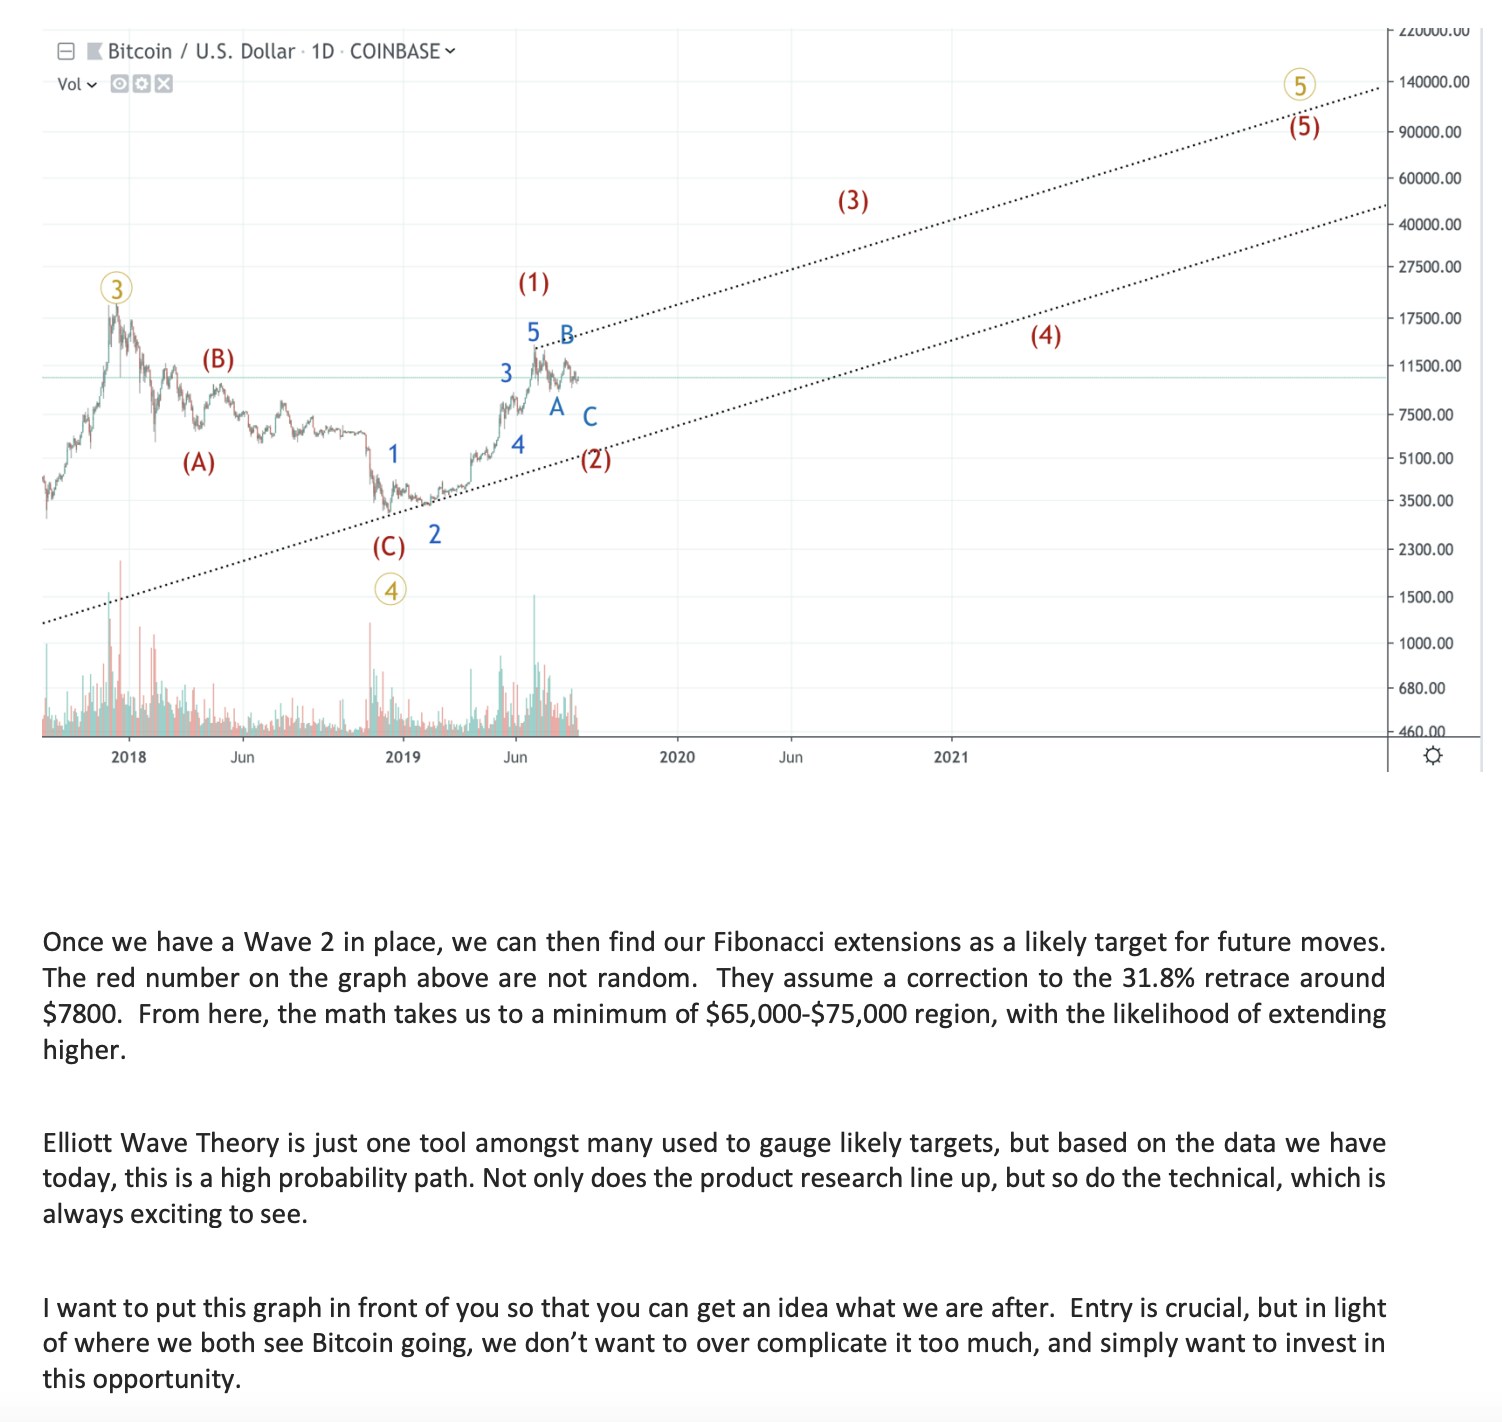
This was a bold call at the time, -- and yet the call materialized. The same system we used to target the $65,000 region in 2019 is the same system we are using to target the $88,000 - $110,000 region in the next uptrend.
We work in probabilities, and therefore manage risk accordingly. As long as any additional weakness in Bitcoin holds the $14,650 level, we believe that the volatility that we have been experiencing since November 2021 is part of a larger uptrend, with the stated targets currently in place.
Technical Analysis and Bitcoin
Bitcoin has no earnings reports, management overhauls, or supply chain disruptions that can affect its price. In other words, there isn’t a lot of news that moves the crypto market, yet this particular market moves all day and all night. It’s human nature to assume that a news event is the cause, yet this is simply not the case with crypto. Human sentiment is the primary driver of the crypto space, which is why technical analysis works particularly well.
Anytime humans come together in a codified arena and begin trading an asset with their instinct for security as the primary driver, patterns develop across price history. This is what we are measuring. One of the simplest patterns to measure is that an uptrend moves in 5 waves up, then corrects in a 3 waves pattern down. Once we get 5 waves up and 3 down, we then repeat this pattern. As of now, since the 2018 low, we only have 4 waves in place, which implies that we have one more 5th wave push before the larger bull cycle is over.

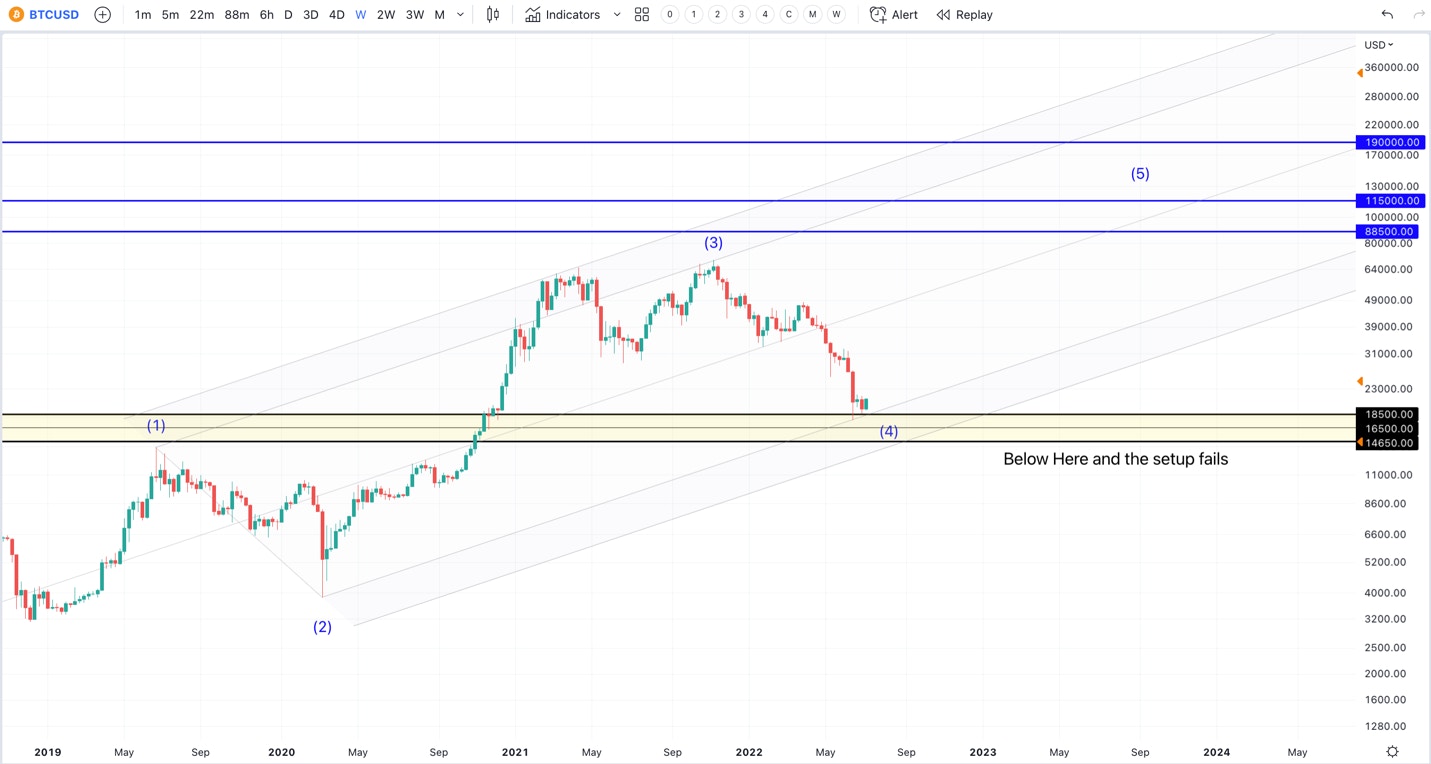
As long as any additional weakness holds the $14,650 level, then the above setup is still intact, which is targeting the $88,000 region at a minimum. However, below $14,650 and the probabilities shift that the current bull cycle is over. This means that the above 5 wave structure would fail, and we would need to see a larger reset at lower levels to start a new bull cycle. This is a crucial caveat to risk manage the potential of a renewed uptrend, and also sets up an attractive risk/reward at current prices.
Sign up for I/O Fund's free newsletter with gains of up to 403% - Click here
Steps to Confirming a Low
When confirming a low, there’s a specific criterion I am looking for. The first of which is do we have a complete corrective structure in place? Corrections tend to move in 3 waves, where the final wave down unfolds into a 5 wave structure, tends to be relatively dramatic, and is met with very negative sentiment.

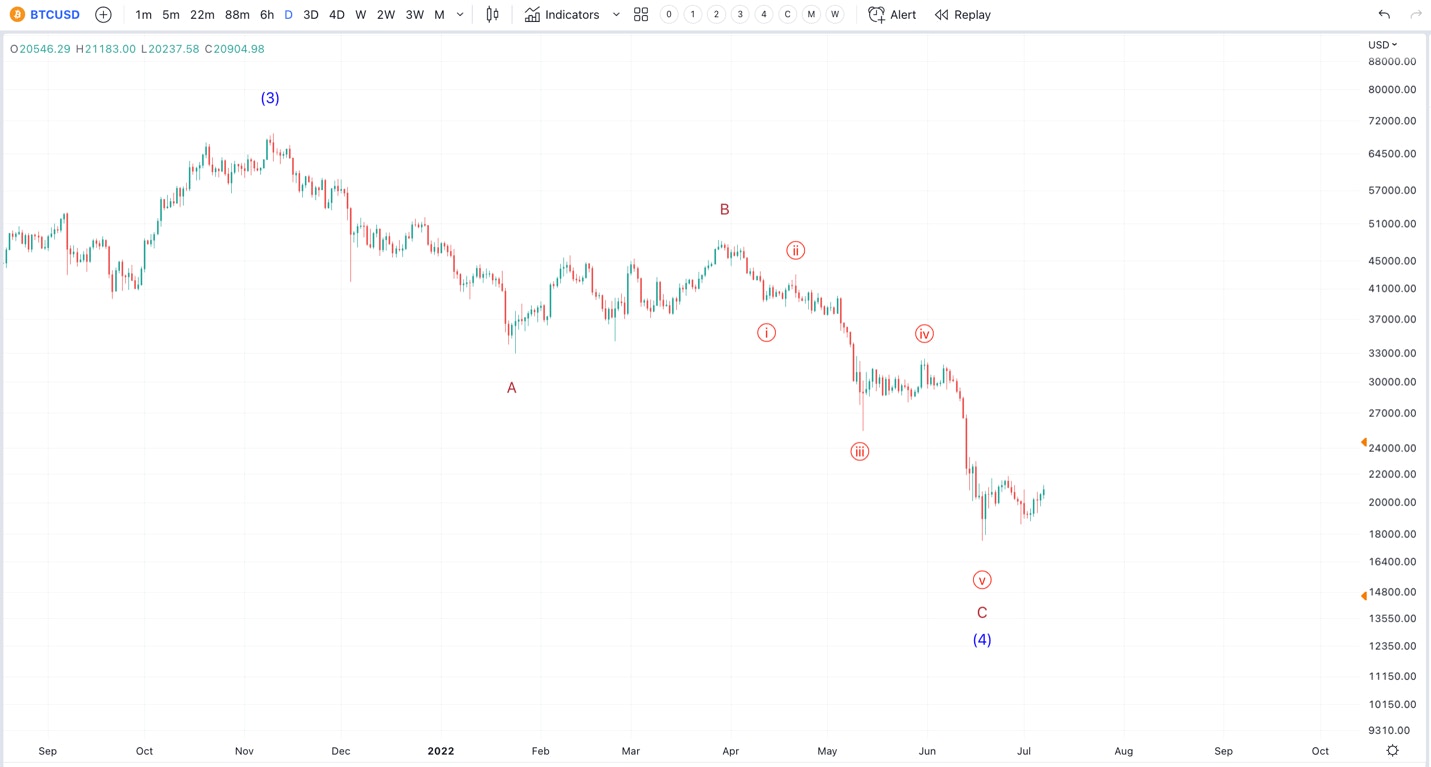
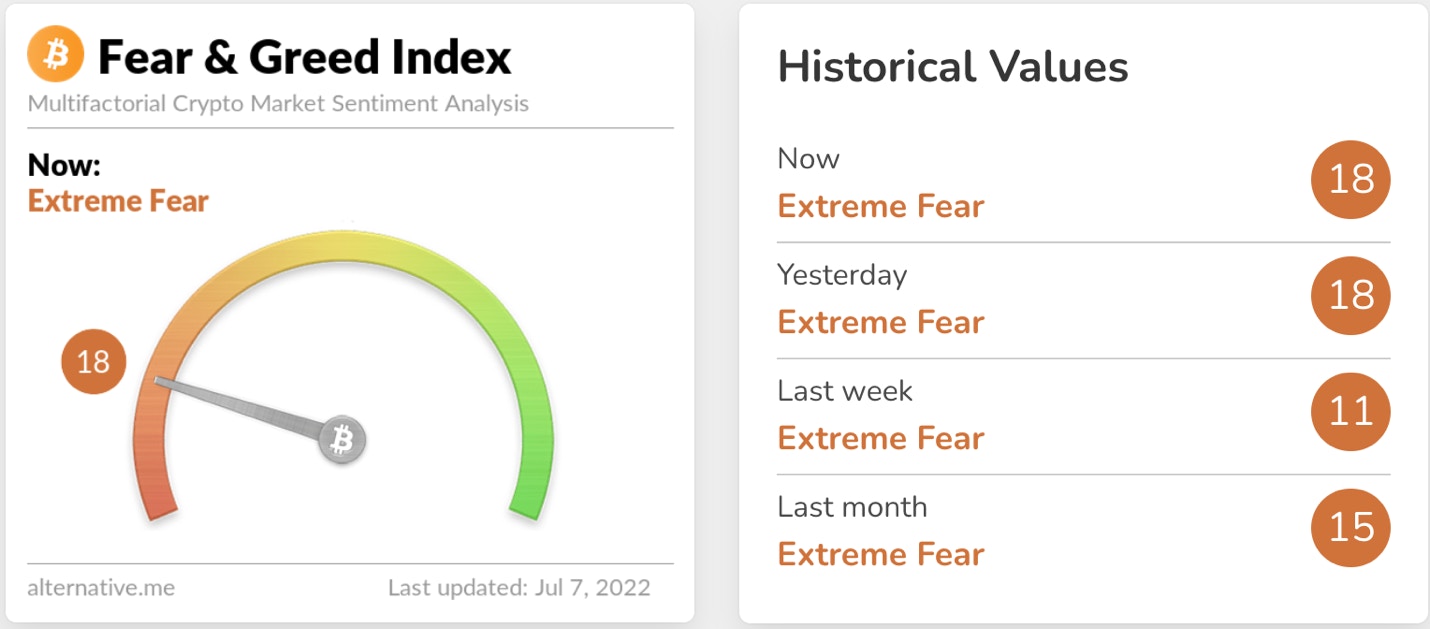
As you can see above, we have a 3 wave correction where the final C wave is a clean 5 wave structure that unfolded in a waterfall-style event. Furthermore, regarding sentiment, the crypto fear/greed index has been in extreme fear for well over a month. In fact, on June 19th the reading was at a 6, which is one of the lowest readings in its history.

So, the first step is in place. Can we extend lower? Of course, but the structure is already quite stretched. Next, I want to see a clean 5 wave bounce off the low. The reason for this is that uptrends move in 5 wave patterns. This is also fractal, so a small 5 wave pattern builds into a larger one, and so on until you have reached your target. So, a micro 5 waves off a low suggests that we are starting a new uptrend.

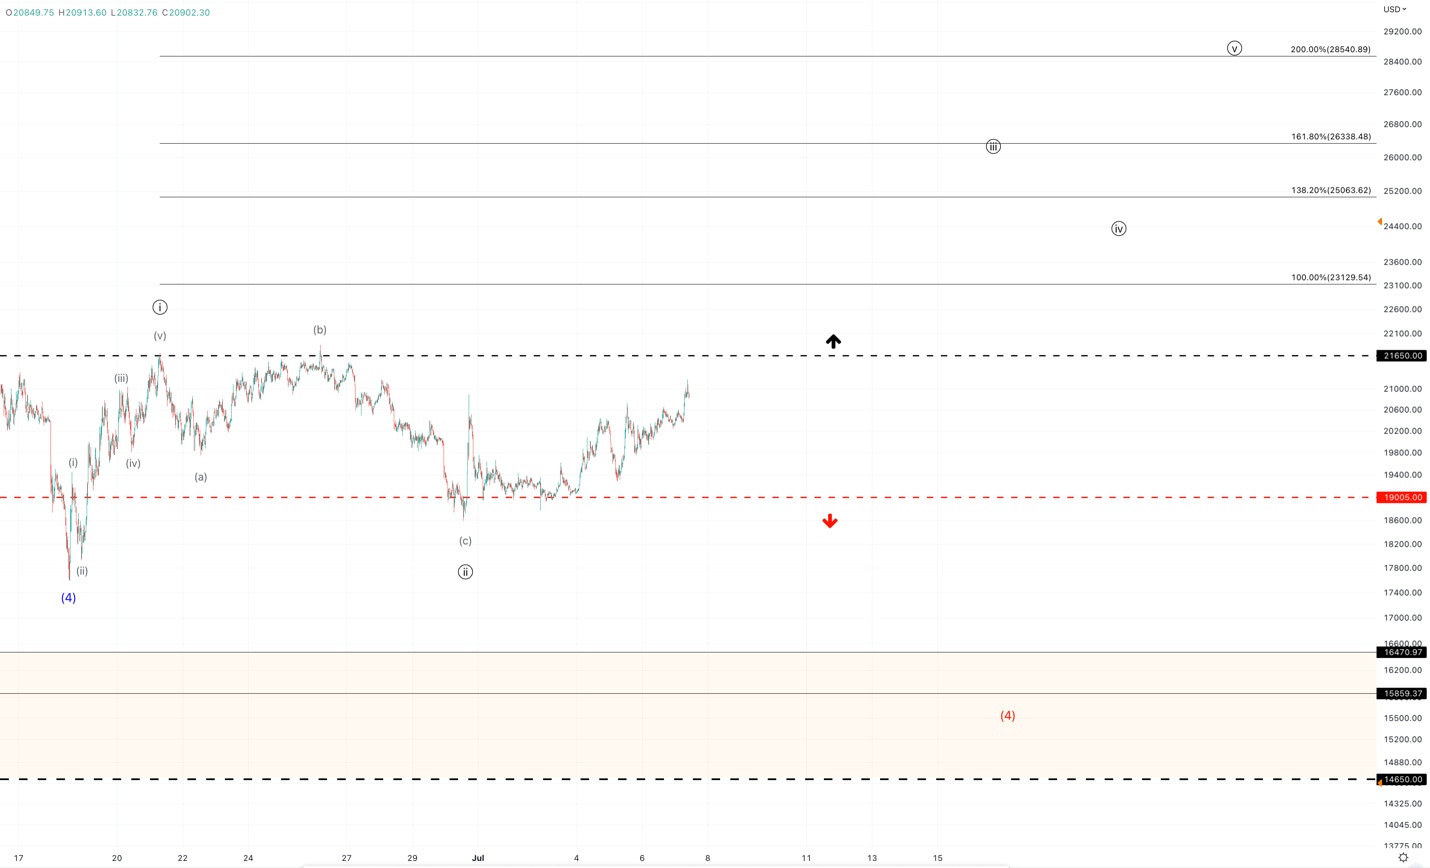
As you can see above, we do have 5 waves off the low in black, followed by a 3 wave retrace that holds the low. As long as any retrace holds the $19,000 support, the micro 5 waves off the low remain intact. Below $19,000 and it opens the door to lower lows, and will also take us closer to the critical $14,650 support.
So, we have 5 waves up and 3 down, and this is now building into a larger 5 wave structure. If correct we have our first larger wave in place as well as our 2nd. The final step is that I want to see a breakout above the top of the larger first wave, which is at $21,650. This typically looks like a cup and handle pattern, and we will need to see a sustained break above this region. A push above this level, and the odds begin to increase substantially that we are beginning the final 5th wave in the larger uptrend.
As a premium member, you gain access to our library of institutional-level research and analysis, weekly webinars, real-time trade alerts, new automated hedge, and more. Learn more about our premium membership.
The US Dollar and Bitcoin
Another interesting correlation is between the Dollar Index (DXY) and Bitcoin. Many will argue that DXY is not a true representation of the USD, and that a trade weighted index is more appropriate. However, the correlation is not far off, and there is much more price history in DXY to analyze than in the trade weighted dollar. For this reason, DXY provides a meaningful correlation comparison to monitor because when the dollar is strong, Bitcoin is weak and vice versa.

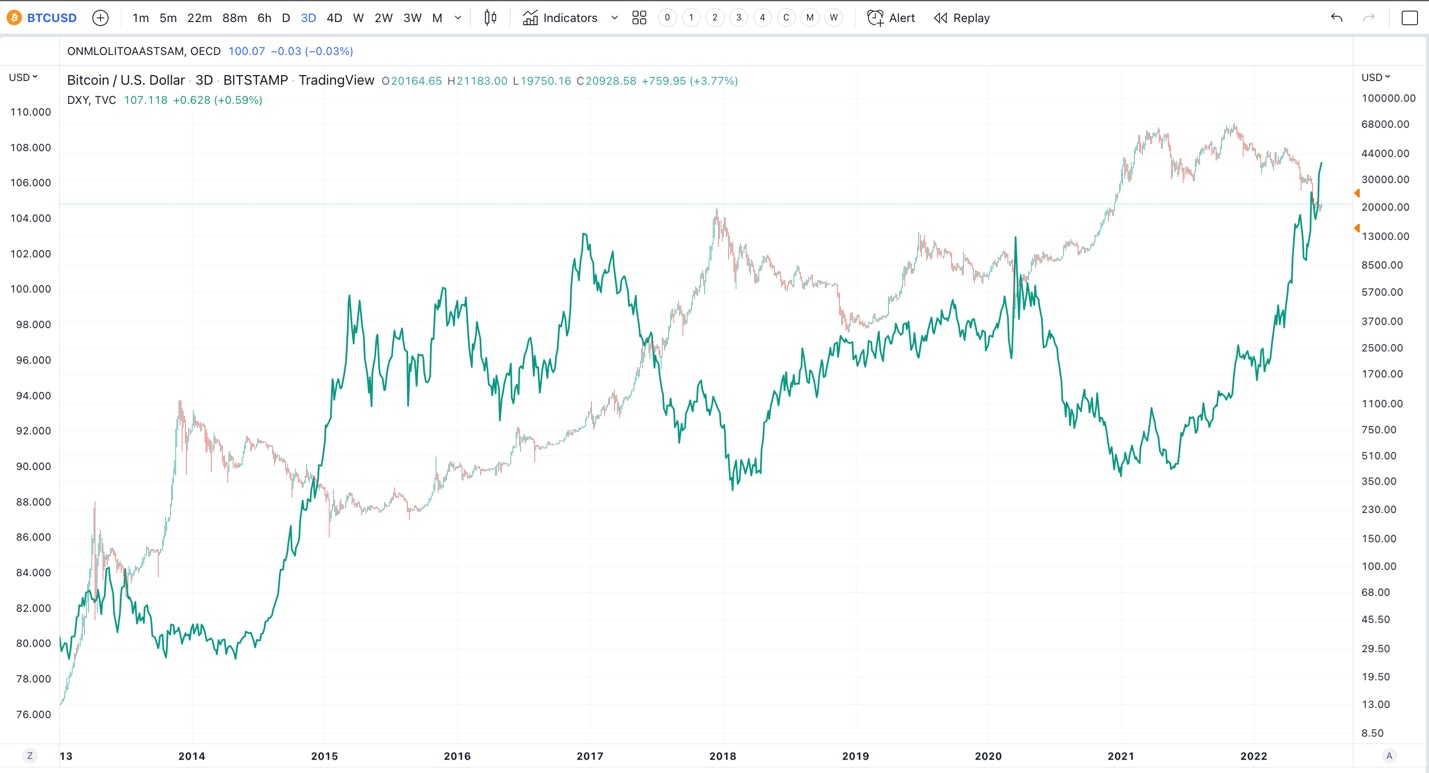
The above chart is comparing the US Dollar Index in green to Bitcoin. Note the inverse correlation. As the USD strengthens, Bitcoin weakens, and vice versa. As of now, DXY is in a complex topping process, and I believe is lining up with the renewed uptrend in Bitcoin.

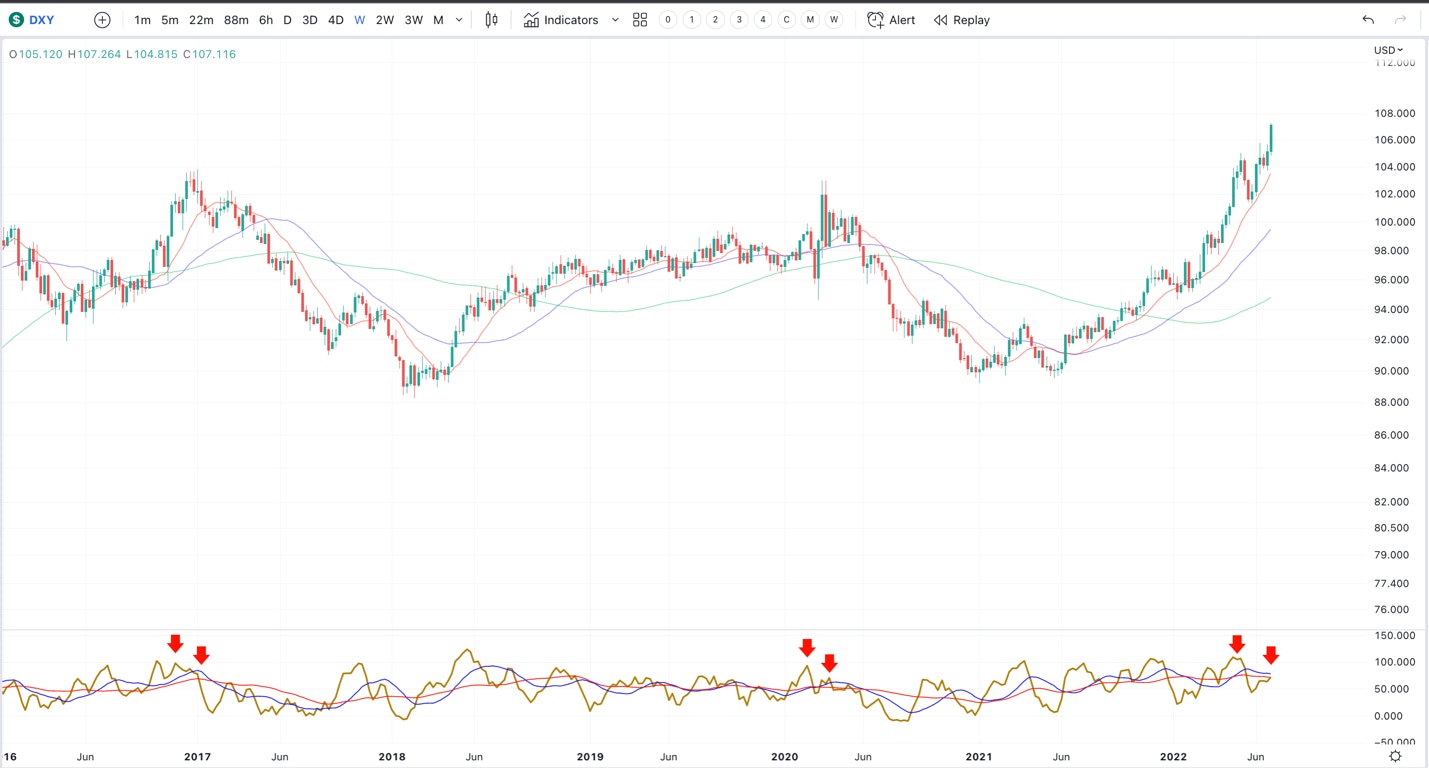
The above chart shows DXY signaling its first weekly divergence since its last top. When you see price make a higher high, while the momentum indicator below makes a lower high, it tends to signal that momentum is fading. This tends to proceed tops, which is showing up now.
Relative Strength Index (RSI)
The Relative Strength Index (RSI) is a way to measure the buying/selling pressure within a trend. In other words, it’s a way to measure the health of a trend and can provide early warning signs of a reversal.
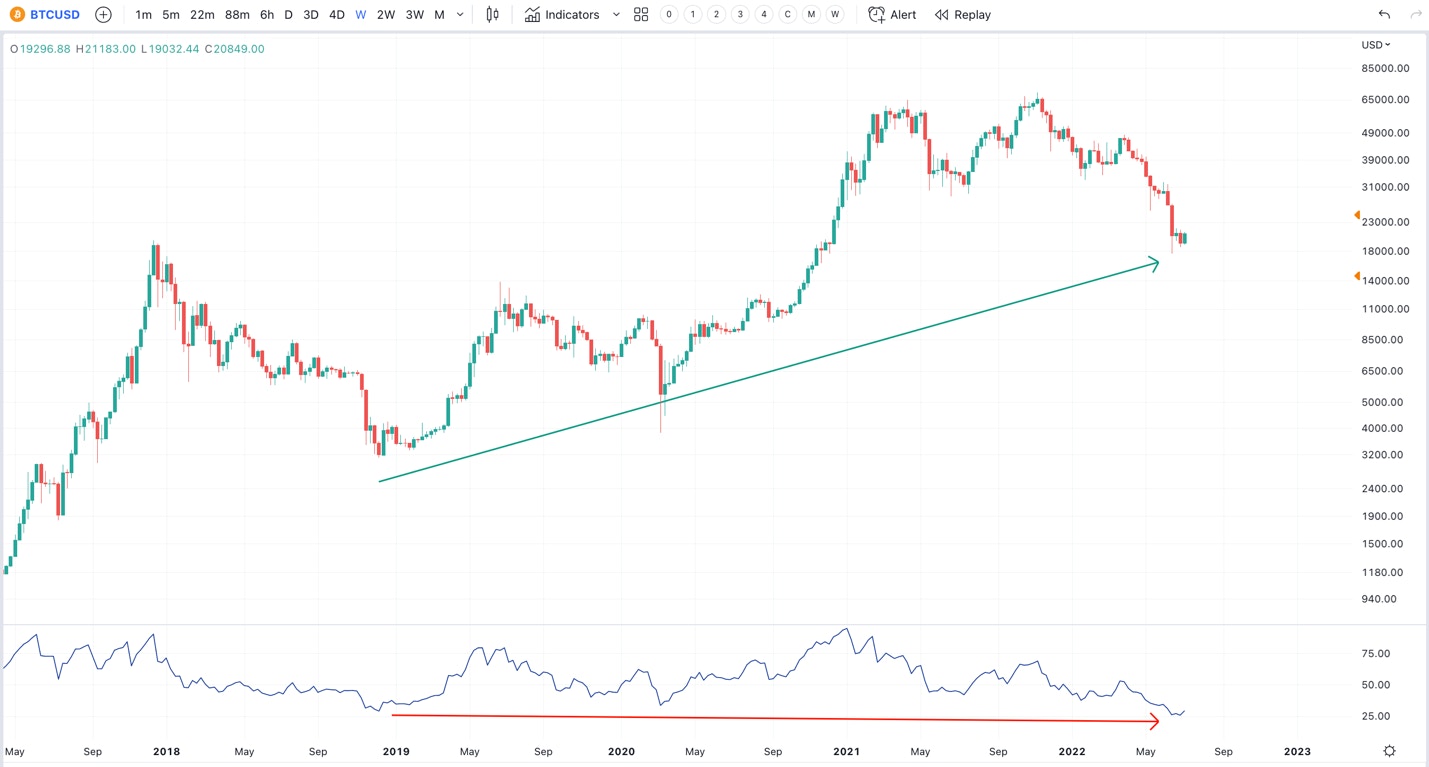
On a weekly chart, Bitcoin recently hit the most oversold conditions since 2011. Historically, when bitcoin’s RSI moves below 30, it tends to mark a larger low is being put in place. In June, Bitcoin’s weekly RSI hit 25, which is lower than the 2017 bubble popping and subsequent 84% drawdown that followed.
This is significant because what we have is a Negative RSI Reversal pattern happening on a large scale. This is when the RSI makes a lower low, while price makes a higher low. This pattern tends to occur in uptrends, which I believe Bitcoin is in an uptrend on a large degree.

These are all positive signals, but Bitcoin still has a lot of work to do in order to signal a meaningful low is in place. For example, price has history and so does the RSI. The weekly RSI tends to revolve around the 54 region. Most uptrends will hold this region and turn back up, while the opposite is true in downtrends.

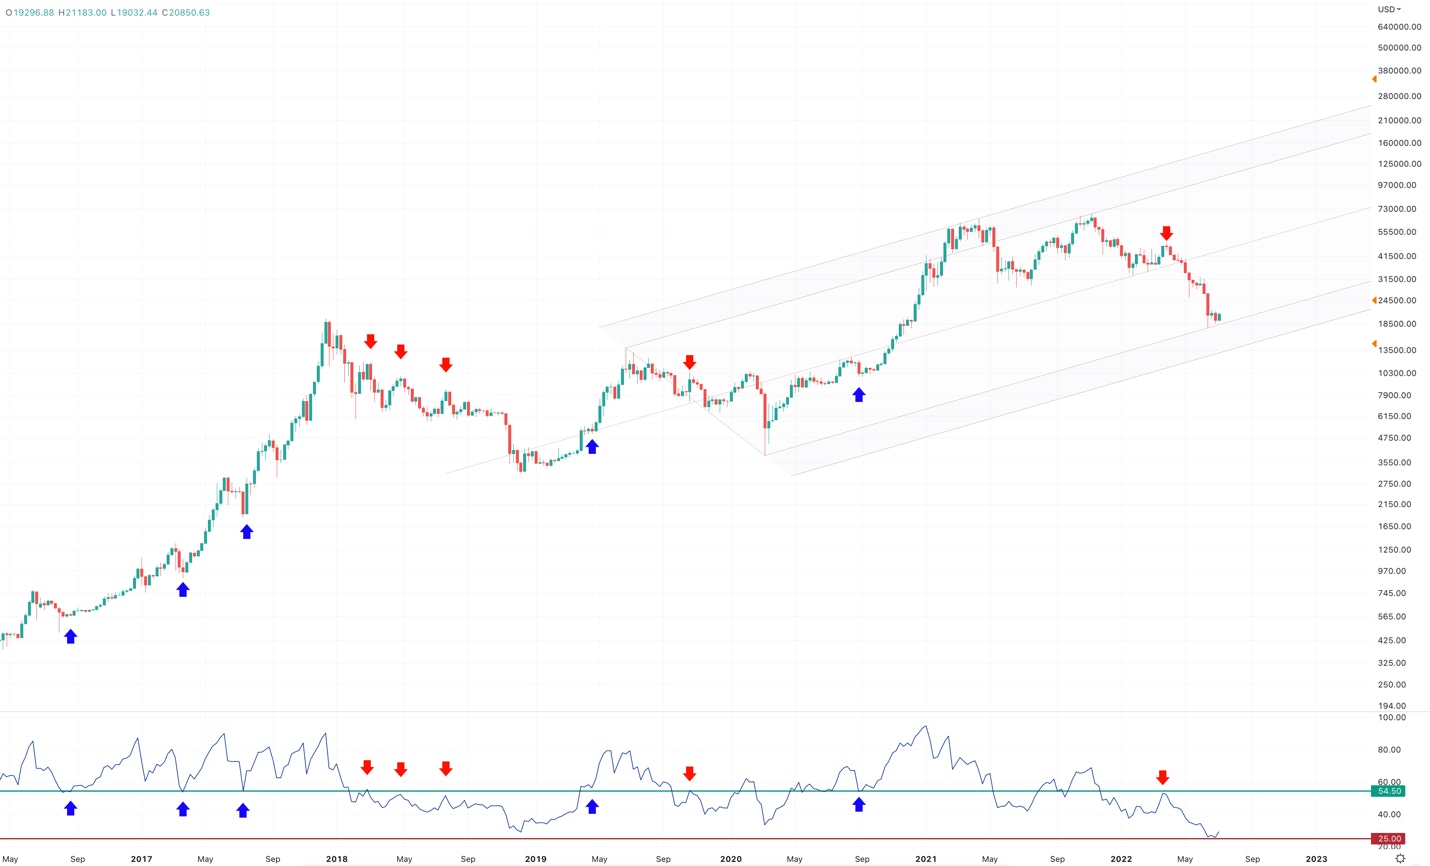
Note the blue arrows above. These are instances where dips within a larger uptrend hold the 54 region on the RSI, and then turn back up. These are the best regions to Buy the Dip. On the other hand, in periods of significant weakness, that 54 region acts as resistance. The 54 region would flip to be areas where you would sell the rip.
Note how the last red arrow marketed the resistance just before the larger waterfall event happened in Bitcoin’s recent drawdown. This level will need to be reclaimed before any renewed strength can be shrugged off as just a bear market bounce. Right now, bitcoin’s weekly RSI is just over 30, so it has a lot of work to do.
Sign up for I/O Fund's free newsletter with gains of up to 403% - Click here
In conclusion, as long as we maintain over $14,650, the larger structure suggests that Bitcoin has one more push higher in the current bull cycle. With the USD starting to show signs of topping out, this lines up with the technical signals we are seeing in Bitcoin, which is suggesting a tend reversal is underway.
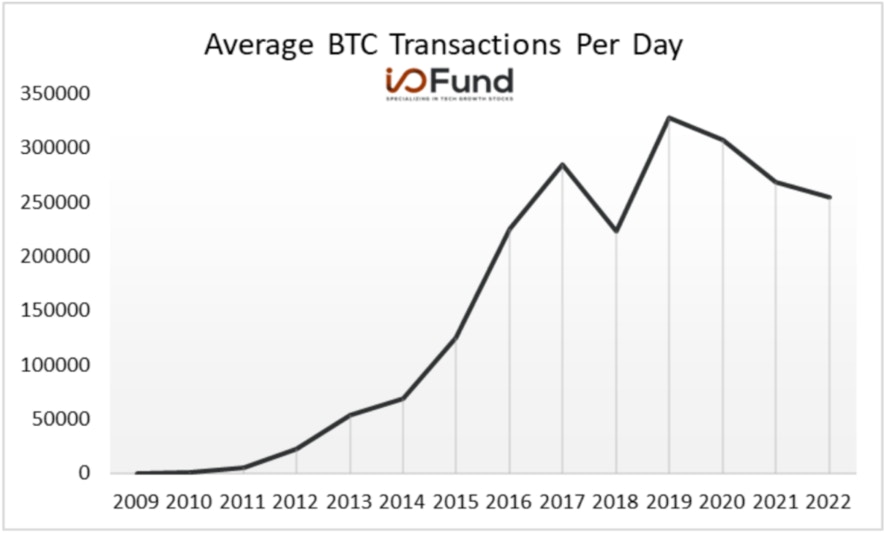
Furthermore, it’s important to recognize how much Bitcoin has scaled in late 2020 - 2022. Bitcoin last traded in the $19,000 region in December of 2020 as well as December of 2017. While the focus recently has been on BTC’s price decline, it’s important to keep in perspective that over the last 10+ years, BTC transactions and adoption has been on a steady upward trend with minor pullbacks along the way.

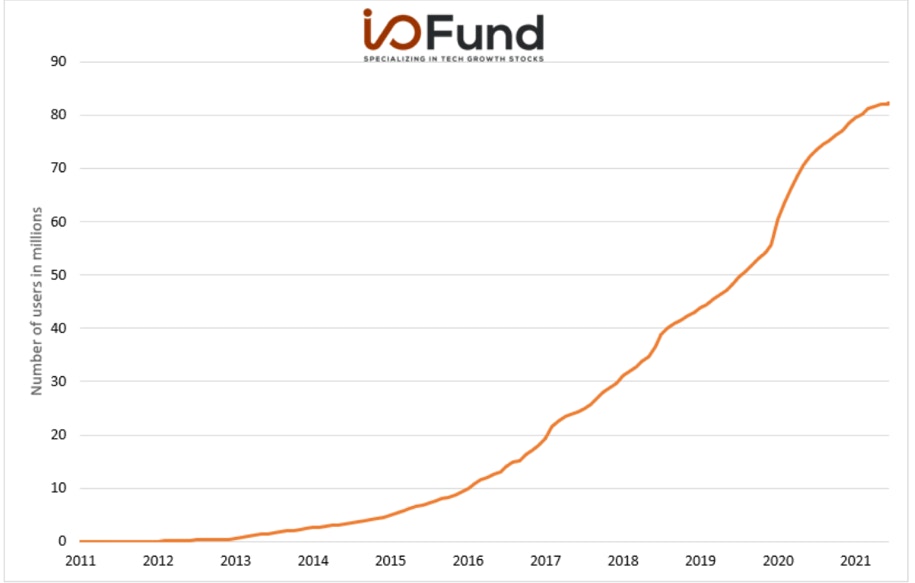
We can also see user adoption is increasing by monitoring the number of Bitcoin wallets in circulation.

Therefore, despite the immense fear in the marketplace, we believe Bitcoin can sustain a higher price than its previous all-time high if the technicals we outlined above remain intact. As stated, it’s important to recognize that the probabilities favor a 5th wave push higher. This is coming off the heels of a very stretched and complete corrective structure and sentiment that is notably worse than the 2018 low. If Bitcoin can break above the $21,650 level, and sustain a push above this region, the odds will further favor the start of a final 5th wave push higher.


More To Explore
Newsletter

Nvidia and Google Are Crowding TSMC’s N3 Node - Can Intel Fill the Gap?
Nvidia is moving its next-generation Rubin GPUs from 4nm to 3nm, yet Google’s latest TPUs are already on N3 and are expected to remain there. Meanwhile, a growing number of AI CPUs from Nvidia, Amazon

Intel vs TSMC: How CoWoS Packaging Constraints Could Create an Opportunity for Intel Foundry
Taiwan Semiconductor (TSMC) is the single, most important company to the AI industry. However, to compete with the incumbent, Intel does not need to beat TSMC at leading-edge manufacturing. It only ne

Big Tech’s Free Cash Flow is Turning Negative – Who's Next?
Big Tech’s AI revenue is accelerating, but free cash flow is moving sharply in the opposite direction. Across Google, Microsoft, Meta and Amazon, capex is rising much faster than operating cash flow a
Big Tech Earnings Preview: Is AI Monetization Finally Catching Up to Capex?
The most pronounced difference between 2026’s tech rally compared to rallies in the past is which companies have been left out of it. The names most associated with the AI trade have hardly participat
Nvidia, CXL, and the Battle to Improve AI Inference Economics
This is Part 2 of our two-part series on AI inference economics. In Part 1 — Why Nvidia's Next AI Battle Is About Tokens per Watt, we laid out why tokens per watt has become the defining metric for in
Why Nvidia’s Next AI Battle Is About Tokens per Watt
As hyperscalers move from building AI infrastructure to monetizing it, tokens per watt helps to reflect if revenue is scaling and if profitability is improving. Offload engines can increase tokens per

Micron Is Up 900%. Here’s Why the AI Memory Trade May Still Have Room to Run
Over the past 10 months, memory chip stocks have gone from being solid beneficiaries of the AI boom to capturing a massively outsized piece of the return pie. The inflection in Micron’s performance de

Why the S&P 500 Shrugged Off the Iran War — and What Could Finally Break the Rally
On February 28th, the U.S. went to war with Iran, and the market was handed the kind of shock it hasn't contended with for years. The conflict set off a chain reaction across the region: an ongoing su

Nvidia, CoreWeave, and Nebius: Inside the Circular Financing of the GPU Boom
Neoclouds are one of the more hotly debated AI business models, with CoreWeave and Nebius being the two most widely recognized names. These companies have seen their sales, backlog, and share prices s

AMD, Nvidia, Arm, Intel: Inside the $120 Billion CPU Gold Rush
CPUs have gone from an afterthought to becoming the AI trade’s next great bottleneck – and with AMD, Nvidia, Arm and Intel circling a market that is doubling nearly overnight, the only question left i
