3 Different Ways Companies Can Game Their Topline Growth Rates
September 10, 2021

I/O Fund
Team

Fast-growing, publicly traded companies often desire to report positive news and impressive growth that will please investors and support a higher share price. Due to the embedded flexibility within generally accepted accounting principles (GAAP), some companies take advantage of gray areas in the rules (some just ignore them all!) to showcase their recent performance in a deceptively positive way.
While most companies report honest results, there are bad apples that use accounting tricks to hide the truth and embellish their growth. Because of these bad apples, it is wise to have a healthy dose of skepticism when doing due diligence on fast growing companies. Furthermore, since many early-stage growth companies are not profitable and have negative cashflows, investors often rely on sales to calculate comparable valuation metrics such as Price-to-sales and EV-to-sales multiples.
So how can we gain confidence that a company’s topline growth is genuine? In the discussion that follows, I highlight three key metrics that investors can utilize to quickly uncover common tricks that companies use to cosmetically boost their topline growth rates. I also give an example of how investors can use this information to find high-quality companies to invest in.
3 Accounting Tricks to Boost Sales Growth
1) Pulling forward sales:
One of the most common tricks that companies use to juice their topline growth rates is to pull forward future sales. This is done by recognizing sales that would have occurred in future quarters in the current quarter. While a pull forward in sales increases current quarter revenues (and current quarter growth), it lowers future sales (and future growth). Being able to identify a pull forward in sales can protect you from investing in companies with unsustainable growth rates, which protects your downside.
A recent SEC order against Under Armour helps illustrate how a pull forward in sales can mislead investors and cost them dearly. In May 2021, the SEC fined popular sports apparel maker Under Armour for pulling forward sales between 2015 and 2017 and not disclosing this to investors. According to the SEC's order, “by the second half of 2015, Under Armour's internal revenue and revenue growth forecasts for the third and fourth quarters of 2015 began to indicate shortfalls from analysts' revenue estimates .. for six consecutive quarters beginning in the third quarter of 2015, Under Armour accelerated, or "pulled forward," a total of $408 million in existing orders that customers had requested be shipped in future quarters.” While it is great that the SEC brought this issue to light, it happened years after the fact, and long after investors had suffered steep loses (pictured below).

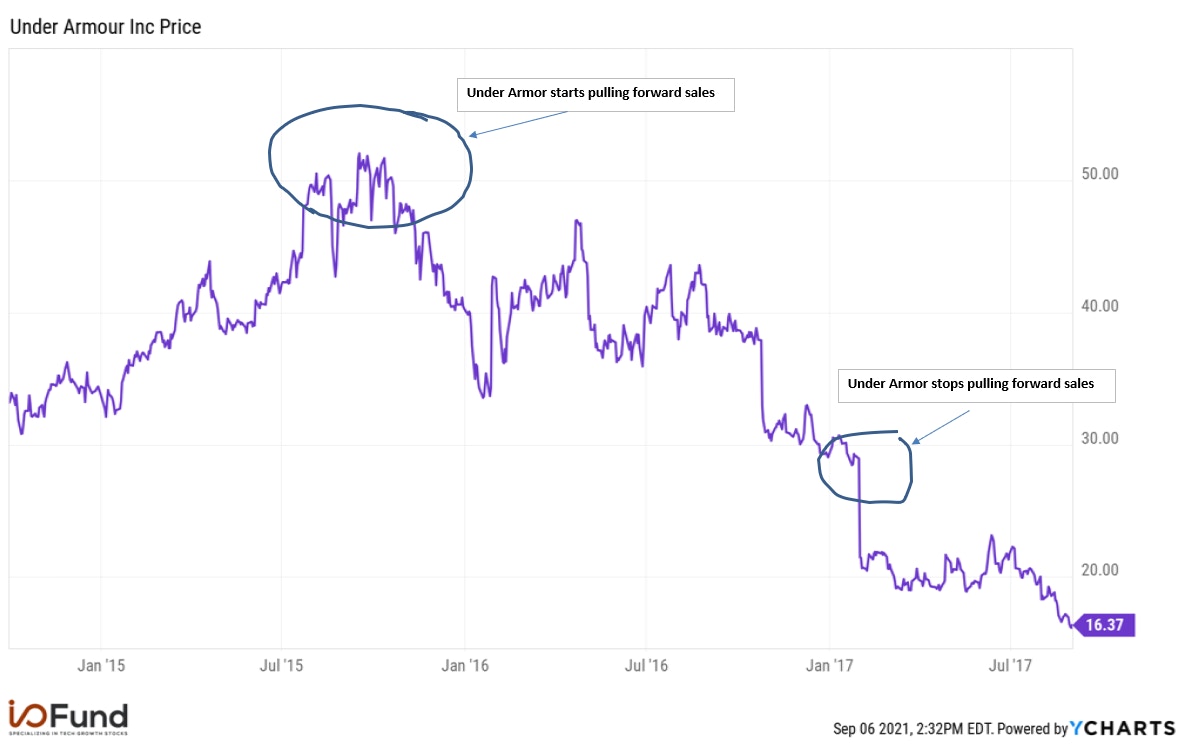
Unfortunately, waiting for the SEC to uncover management’s tricks would have resulted in losses for investors, as the stock price topped around the time Under Armour started pulling forward sales. In the next section, I discuss a way that investors could have been alerted to Under Armour’s pull forward of sales well before the SEC’s order.
How to spot a pull forward of sales:
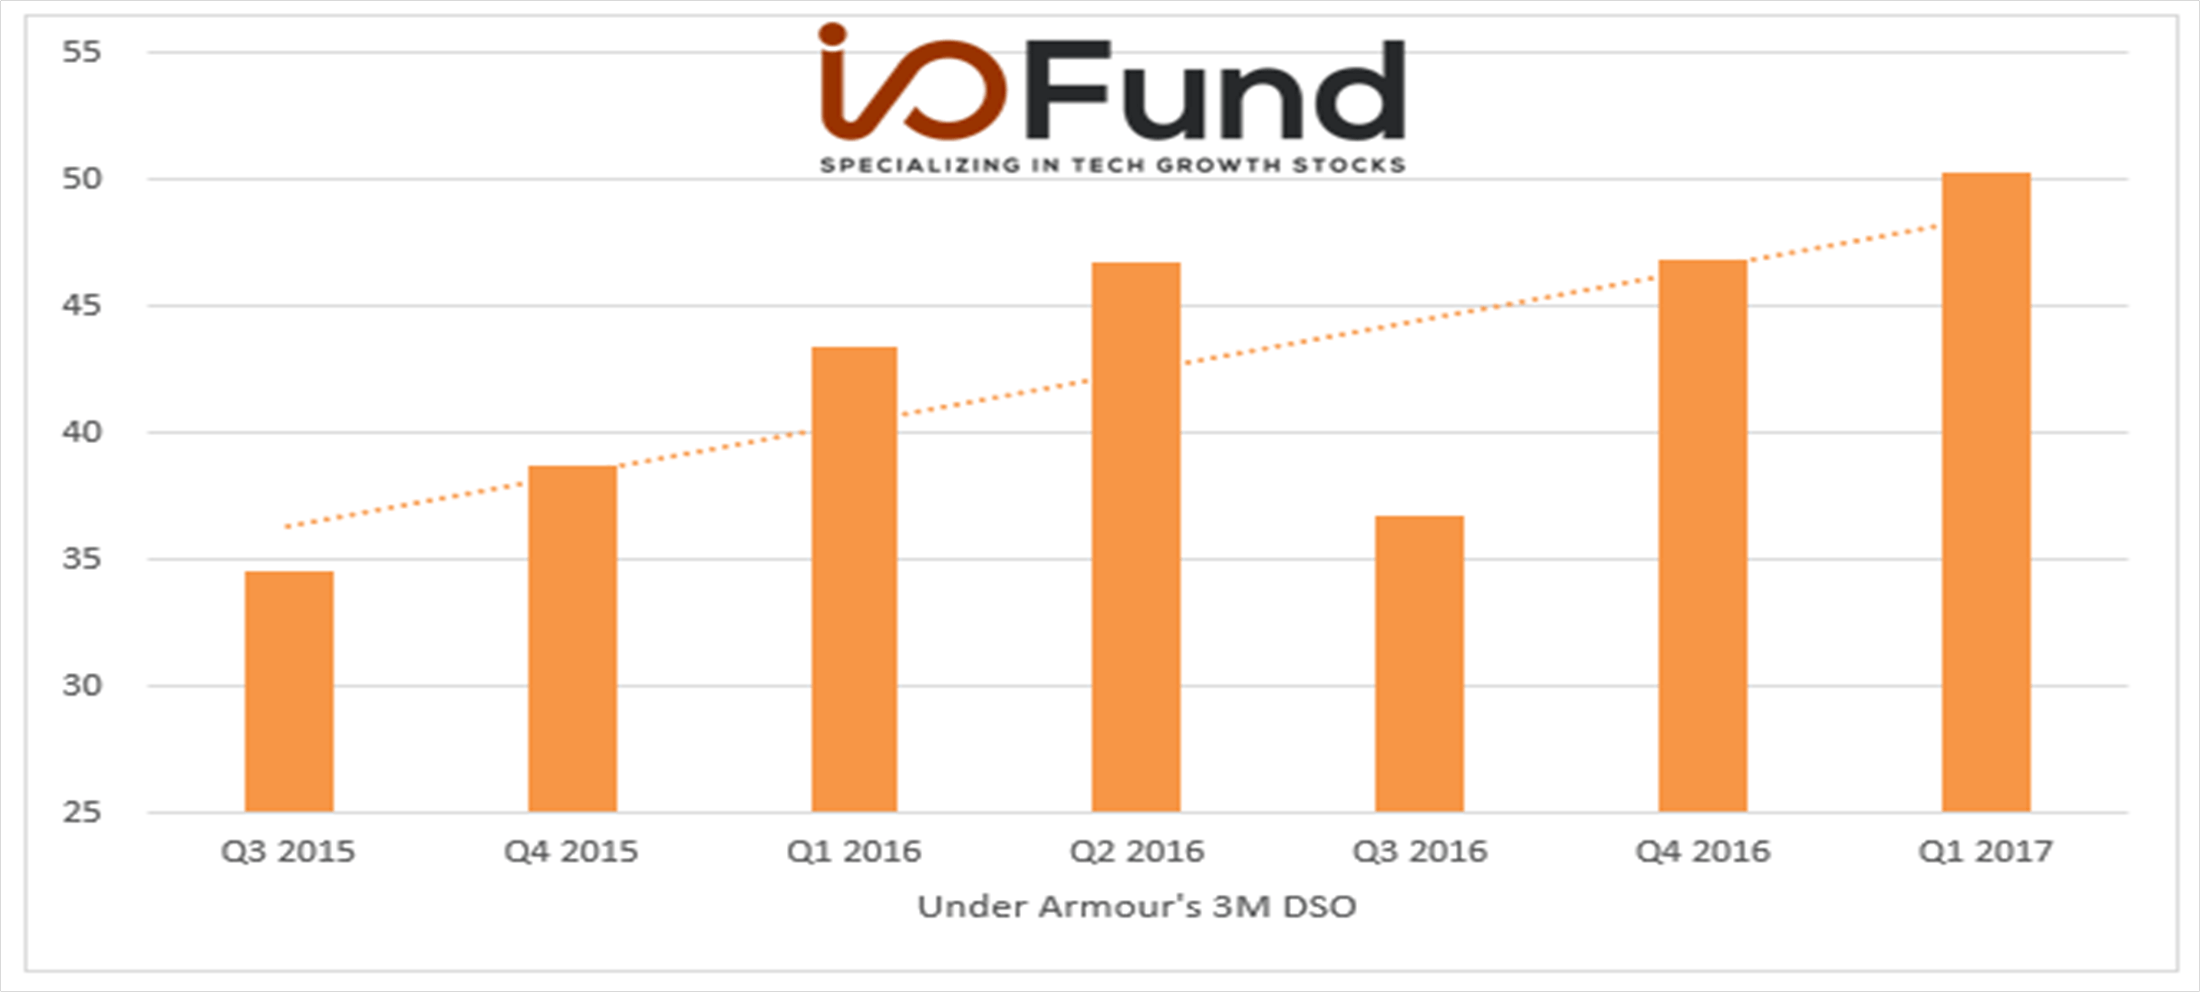
Management is not going to tell you that they have pulled forward sales. Rather, they will likely try to disguise the issue. While there is no foolproof way of detecting a pull forward of sales, monitoring the amount of time it takes to collect cash from customers can help investors spot a pull forward in sales. We can proxy customer payment terms by calculating days sales outstanding (DSOs), which is calculated by dividing receivables by quarterly sales and multiplying by the number of days in the quarter. An unexplained rise in DSOs can signal that future sales, which will be repaid in future quarters, were pulled into the current quarter.
Continuing with the Under Armor example, the company’s DSO metric increased nearly 50% between Q3 2015 and Q1 2017 (pictured below). In Q3 2015, customers were paying, on average, 35 days after purchase. Just six quarters later, the company’s DSO metric had increased to 50 days, meaning that customers were taking nearly 50% longer to pay. With the benefit of hindsight, we know that the 50% rise in payment terms was because Under Armour had pulled forward future sales. Two quarter after Under Armour had stopped pulling forward sales, the company’s revenues dropped 4% YOY, and its stock price had more than halved by then.

2) Liquidating deferred revenue:
Another important metric to monitor with growth stocks is deferred revenue. Deferred revenue is a key balance sheet account that a significant amount of fast-growing tech companies report, especially subscription-as-a-service (SaaS) companies. While growth investors often monitor the rate of growth of deferred revenue, few pay attention to the pace of liquidation. Being cognizant of both the growth in deferred revenue and its liquidation rate can improve your understanding of a company’s true growth rate.
For instance, SaaS companies sell software contracts and often get paid upfront but recognize revenue on a ratable basis. The upfront payment of cash but deferral of revenue results in deferred revenue. As the name implies, deferred revenue turns into sales over time. However, investors need to be mindful if deferred revenue is being recognized as sales at an accelerated rate. If deferred revenue is turning into sales faster than prior years, it may signal that recently reported sales growth is unsustainably high.
Ways to identify a liquidation of deferred revenue:
If the balance of deferred revenue is significant, companies will provide information about the balance in the notes to their 10Q and 10K filings. Here is an example of a deferred revenue disclosure from Splunk’s most recent 10K:

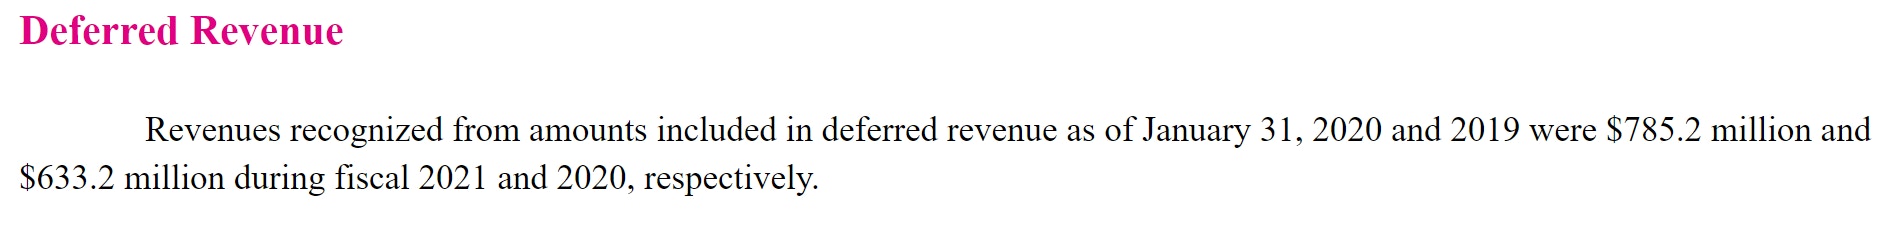
In order to measure if deferred revenue is turning into sales faster than last year, we need to divide sales from deferred revenue by beginning deferred revenue. Splunk had a $1 billion and $878 million beginning deferred revenue balance on January 31, 2020 and 2019, respectively. By dividing the $786 million of revenue recognized from deferred revenue by Splunk’s beginning $1 billion deferred revenue balance, we can see that the company recognized 78% of its beginning deferred revenue balance during FY2021, up from 72% in FY2020. The 600bps acceleration in deferred revenue recognition during FY2021 suggests that Splunk had recognized deferred revenue faster than usual. Taking this one step further, Splunk’s FY2021 topline growth rate was somewhat skewed by the acceleration in deferred revenue recognition during the year.
While not all companies report deferred revenue, it is important that investors stay aware of the pace of deferred revenue liquidation for companies that do. There are many different reasons that can cause the pace of deferred revenue recognition to accelerate, such as shorter contract lengths or customer cancellations. Nonetheless, the acceleration in the rate of deferred revenue recognition is ultimately an unsustainable topline benefit. However, the pace of revenue recognition varies per quarter, so it is up to the investor to determine if the change of pace is a concern or not.
3) Excessive unbilled sales:
The final trend I will be discussing is the unique ability for some management teams to report unbilled sales. It may come as a surprise to some investors that companies can accrue sales without ever having to bill or invoice the customer. These types of sales are referred to as “unbilled sales” and are high risk. Since it is easy to grow sales if you don’t have to invoice (and haggle) with customers, unbilled sales can easily be gamed by management to meet near term expectations.
Unbilled sales are usually the result of long-term projects, where sales need to be accrued as work is completed but invoicing is withheld until project milestones. While unbilled sales are GAAP compliant and prevalent throughout the tech industry, they should nonetheless draw a skeptical eye when they suddenly start to surge. Since unbilled sales are driven by management’s judgement of project completion, they can easily be accrued to meet near term expectations.
Ways to identify excessive unbilled sales:
Unbilled sales are not directly disclosed by companies, rather investors must look for its sister account called unbilled receivables. Moreover, not all companies use the same terminology: some companies label unbilled receivables as “contract assets” while others call them “contracts in progress” or “expenditures billable to clients”.
Regardless of the naming convention, it is important to determine if the rise in unbilled sales was excessive. Generally, a sudden change in the level of unbilled sales should make an investor skeptical. For example, Veritone Inc (VERI), a small but fast growing tech company, disclosed that it had $3 million of unbilled receivables in Q2 2020, and then one quarter later, reported $20 million in unbilled receivables as of Q3 2020. Since rising unbilled receivables means that there was a rise in unbilled sales, we can estimate that Veritone accrued ~$17 million in unbilled sales during Q3 2020. We can tell that this was excessive because Veritone only reported $16 million in sales during the quarter. Stated differently, most (if not all) of Veritone’s sales during Q3 2020 were from sales that had yet to be billed to the customer. This is a concerning trend, and suggests that Veritone’s Q3 2020 growth rate may have been inflated from excessive unbilled sales.
There are a plethora of ways that companies can disguise and cosmetically boosts their topline growth rates. While not all companies engage in such tactics, it is wise to remain a bit skeptical when reviewing a company’s strong growth rate, especially if peers are struggling. While I only discussed three different ways that management can temporarily juice sales, these are often the most common and easiest ways to temporarily grow sales. Importantly, these three techniques are allowed under GAAP, due to the inherent flexibility in accounting rules, so investors need to come to their own conclusions if growth is sustainable or not.
How to Use This Information to Buy Better Stocks
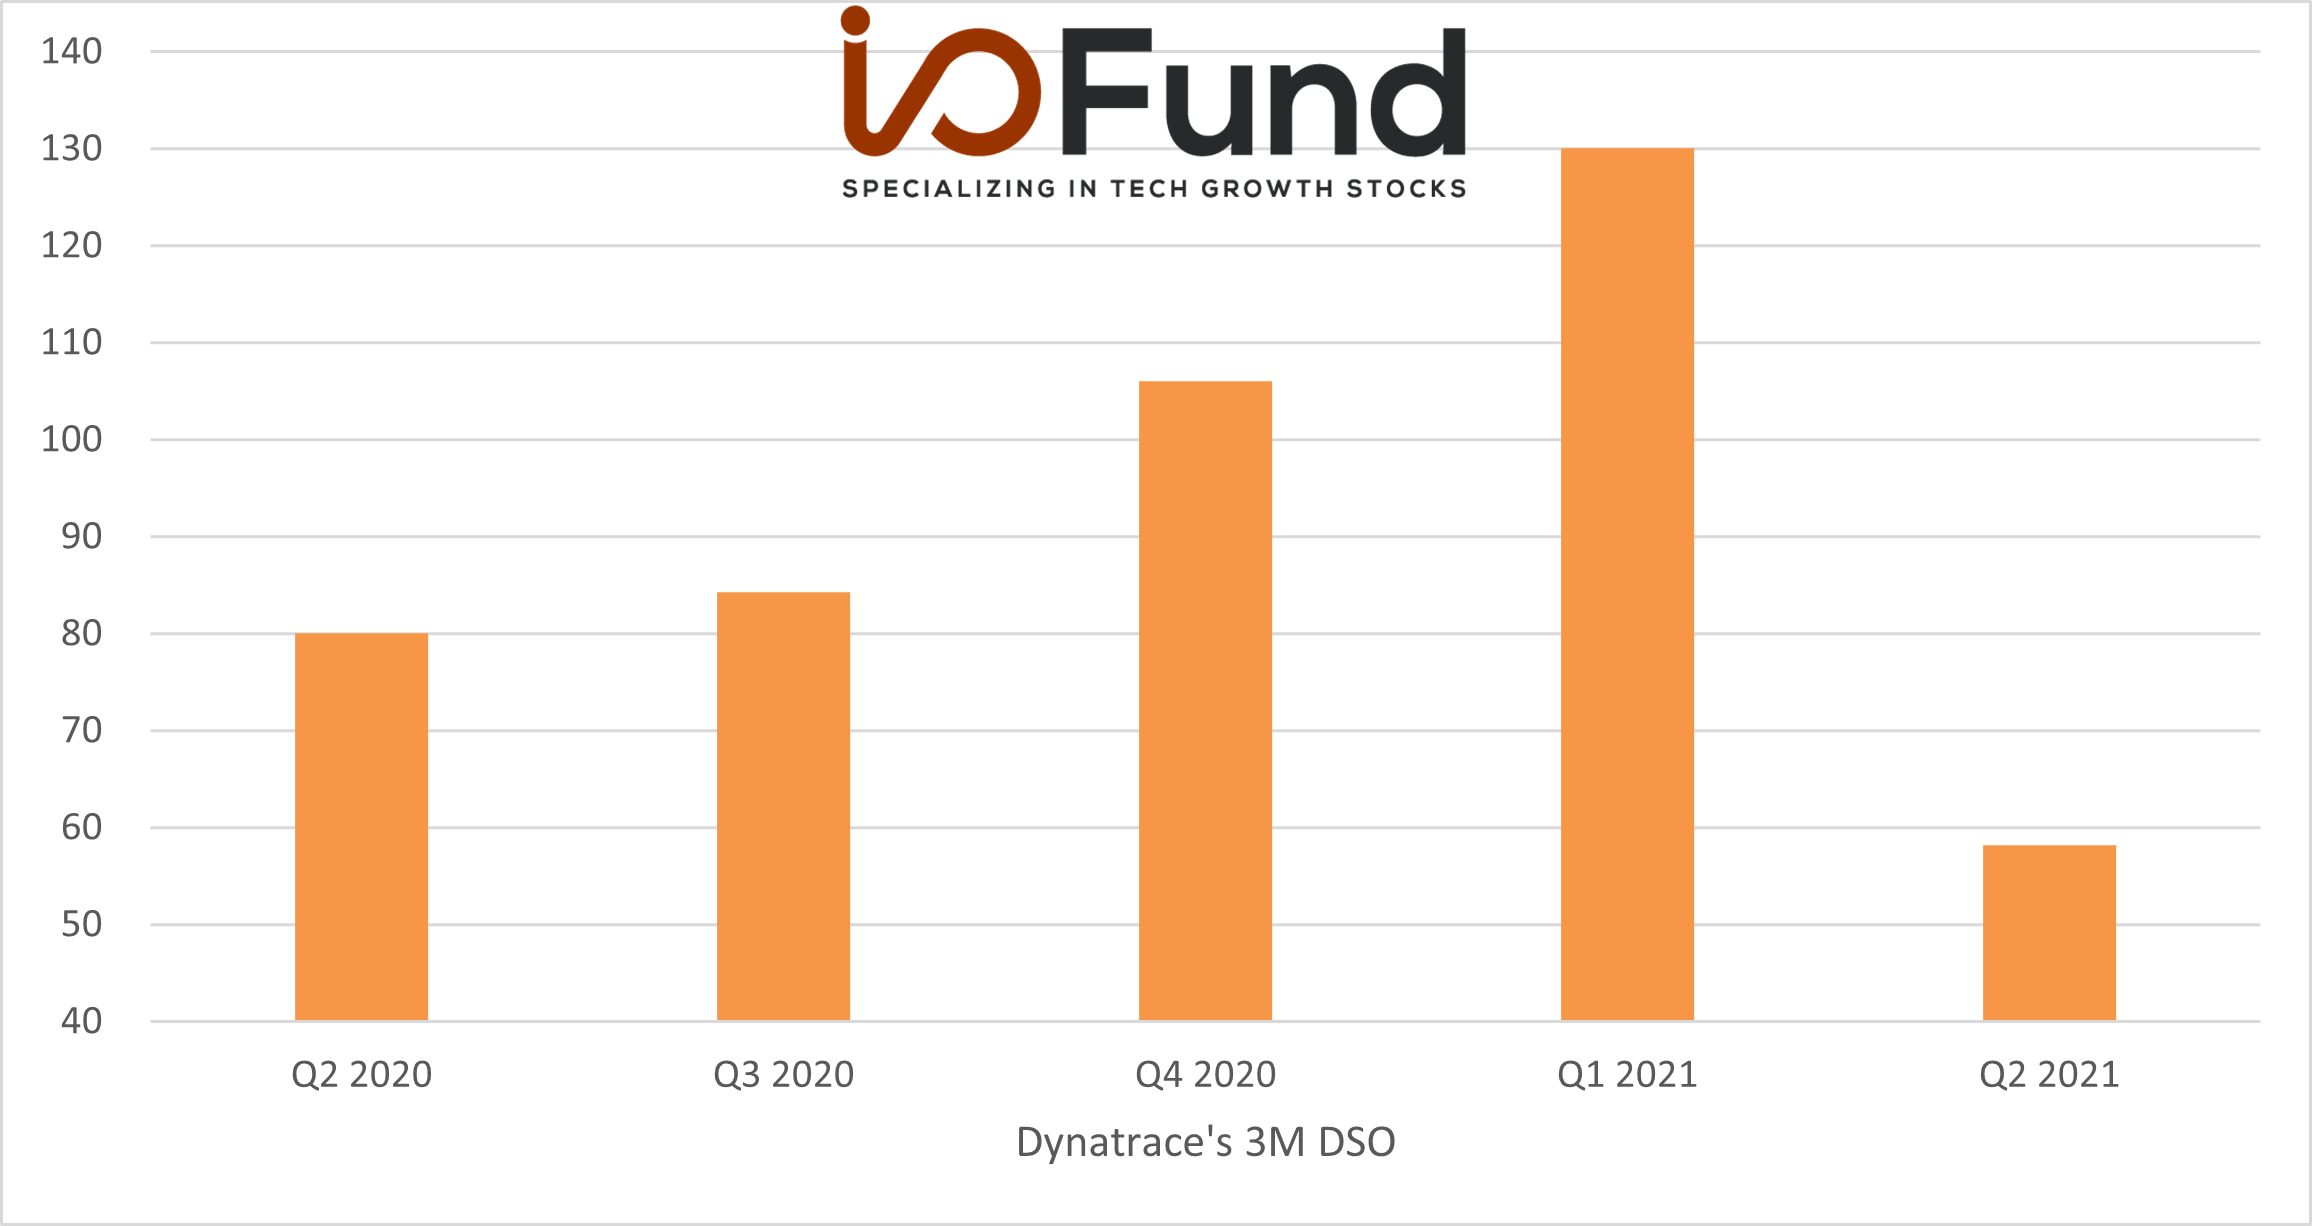
We can use the above information to increase our understanding of recently reported growth. A better understanding of how a company is growing sales can improve your batting average by picking higher quality companies. If, for example, DSOs are declining and deferred revenue is growing, then revenue quality is improving. An example of this would be Dynatrace (DT), a software provider that monitors and optimizes multi-cloud environments.
As shown below, Dynatrace recently reported a strong improvement in its cash collections, as three-month DSO dropped from 130 days in calendar-year Q1 2021 to 58 days in Q2 2021. Dynatrace is collecting on its sales 72 days faster than the prior quarter, and 22 days faster than last year. Faster cash collections are a sign of strength, which improves the quality of sales and likely indicates that demand for Dynatrace’s products has been increasing.

On top of the faster collection times, Dynatrace reported an acceleration in sales, which grew 35% YOY in Q2 2021, the fastest YOY growth rate since going public. It is great to see that while the quality of sales has improved, so has the rate of topline growth. An acceleration in sales coupled with an improvement in the quality of sales growth is a bullish signal for Dynatrace and helps support a premium multiple.
Adding to the positives, Dynatrace reported an acceleration in current deferred revenue, which grew 38% YoY to $486 million. Since deferred revenue will turn into sales going forward, the acceleration in deferred revenue implies that Dynatrace’s sales will continue to grow strongly in the near term. It is also great that deferred revenue is growing faster than sales, suggesting that sales may continue to accelerate going forward as deferred revenue turns into sales.
Finally, to be complete, I also looked at Dynatrace’s pace of deferred revenue recognition. Dynatrace has the following disclosure in its most recent 10Q:


By dividing sales from deferred revenue by beginning deferred revenue, I calculated that Dynatrace’s rate of deferred revenue recognition had slightly accelerated from 33% in the prior-year quarter to 36% in the current quarter. This means that Dynatrace is recognizing sales from deferred revenue slightly faster than last year. Had Dynatrace recognized deferred revenue at a similar pace as last year, its quarterly sales would have been ~$16 million lower (~8%). This is slightly unfavorable but needs to be weighed against a significant reduction in DSOs and an acceleration in sales growth. Furthermore, despite the increase in the pace of recognition, deferred revenue growth still outpaced sales growth during the quarter.
In my opinion, the reduction in DSOs and acceleration in deferred revenue growth outweighs the unfavorable acceleration in deferred revenue recognition. The improvement in Dynatrace’s results suggest that the company is outperforming the competition and that demand for its products and services is strong.
In conclusion, monitoring the quality of revenue growth can help investors avoid companies temporarily propping up sales and can also help investors find high-performing companies. Since GAAP is flexible and allows management to utilize the tricks outlined above, it is up to the investor to determine if growth is sustainable or not. Investors who are cognizant of these trends will likely increase their batting average by picking high quality companies, which should lead to better returns in the long run.
Disclosure: Bradley Cipriano owns shares in Dynatrace. Bradley Cipriano and the I/O Fund have no plans to change their respective positions in any of the above mentioned companies within the next 72 hours. The above article expresses the opinions of the author, and the author did not receive compensation from any of the discussed companies. This is not financial advice. Please consult with your financial advisor in regards to any stocks you buy.
Please note: The I/O Fund conducts research and draws conclusions for the Fund’s positions. We then share that information with our readers. This is not a guarantee of a stock’s performance. Please consult your personal financial advisor before buying any stock in the companies mentioned in this analysis.


More To Explore
Newsletter

AI Token Demand is Shattering Forecasts
Total annual token processing is no longer measured in billions or trillions of tokens, but in the quadrillions and beyond. As annual token processing is now tracked in units with 15 trailing zeros, i

Nvidia and Google Are Crowding TSMC’s N3 Node - Can Intel Fill the Gap?
Nvidia is moving its next-generation Rubin GPUs from 4nm to 3nm, yet Google’s latest TPUs are already on N3 and are expected to remain there. Meanwhile, a growing number of AI CPUs from Nvidia, Amazon

Intel vs TSMC: How CoWoS Packaging Constraints Could Create an Opportunity for Intel Foundry
Taiwan Semiconductor (TSMC) is the single, most important company to the AI industry. However, to compete with the incumbent, Intel does not need to beat TSMC at leading-edge manufacturing. It only ne
Big Tech’s Free Cash Flow is Turning Negative – Who's Next?
Big Tech’s AI revenue is accelerating, but free cash flow is moving sharply in the opposite direction. Across Google, Microsoft, Meta and Amazon, capex is rising much faster than operating cash flow a
Big Tech Earnings Preview: Is AI Monetization Finally Catching Up to Capex?
The most pronounced difference between 2026’s tech rally compared to rallies in the past is which companies have been left out of it. The names most associated with the AI trade have hardly participat
Nvidia, CXL, and the Battle to Improve AI Inference Economics
This is Part 2 of our two-part series on AI inference economics. In Part 1 — Why Nvidia's Next AI Battle Is About Tokens per Watt, we laid out why tokens per watt has become the defining metric for in

Why Nvidia’s Next AI Battle Is About Tokens per Watt
As hyperscalers move from building AI infrastructure to monetizing it, tokens per watt helps to reflect if revenue is scaling and if profitability is improving. Offload engines can increase tokens per

Micron Is Up 900%. Here’s Why the AI Memory Trade May Still Have Room to Run
Over the past 10 months, memory chip stocks have gone from being solid beneficiaries of the AI boom to capturing a massively outsized piece of the return pie. The inflection in Micron’s performance de

Why the S&P 500 Shrugged Off the Iran War — and What Could Finally Break the Rally
On February 28th, the U.S. went to war with Iran, and the market was handed the kind of shock it hasn't contended with for years. The conflict set off a chain reaction across the region: an ongoing su

Nvidia, CoreWeave, and Nebius: Inside the Circular Financing of the GPU Boom
Neoclouds are one of the more hotly debated AI business models, with CoreWeave and Nebius being the two most widely recognized names. These companies have seen their sales, backlog, and share prices s
