The Teflon Market: Why the 12-Year Bull Will Bounce Back
March 25, 2022

Knox Ridley
Portfolio Manager

Last week, we discussed how negative sentiment is often the catalyst that takes a market to new highs even in light of an ongoing negative news cycle. In fact, we are beginning to see broad indexes and key stocks make their first series of higher highs after going through the longest correction we’ve seen since 2018.

The S&P 500 (SPX) corrected more than 14% from the recent top, while the NASDAQ100 corrected more than 20%. Regarding the S&P 500, this depth of a correction has only happened four other times since 2009, so it's quite rare to see a drawdown of this size.
Each time we've seen this type of cyclical bear/deep correction (2011, 2016, 2019, 2020) the belief of a secular bear market starting up (again) is usually quite high. Maybe this time is different, but secular bears historically coincide with recessions and are not led by the equity markets.
If we are not heading towards a recession in 2022, the unwinding of this bearish sentiment would be what drives this next move higher, and I believe we are starting to see evidence of this. In fact, since Russia invaded Ukraine, the SPX is up over 450 points, the 10-year yield is up +70 bps, crude oil is comfortably over $100, and many high beta tech names are leading the current move up in equities.
The reason the news cycle is rarely in line with the market is because markets are always forward-looking, and news is always a lagging report. Below, I review some important factors for tech investors to consider and also statistics around bear markets that are conveniently forgotten when bear market warnings are issued.
The two single most important factors a tech investor needs to know:
- What is my risk tolerance? Or, what level of risk am I willing to take and still be able to sleep at night? Most investors play lip service to this until they experience a large drawdown.
- “What is my time horizon” is an essential question. Again, most investors will say +3-5 years; however, when they see their portfolio decrease with the markets, emotions tend to force bad decisions and they will suddenly sell right now.
- Notably, many financial advisors will advise their clients to not buy stocks (at all) if the money is needed in a 1-2 year time frame, and yet a four-month drawdown is enough to cause many with “long-term horizons” to fold their hands, which defeats the purpose of buying a stock, which is to not be in a position to where one must sell.
A Famous study led by mathematical psychologist Amos Tversky and Nobel Prize winner Daniel Kahneman discovered that “Investors feel the pain of a loss twice as much as the joy of an equivalent gain”

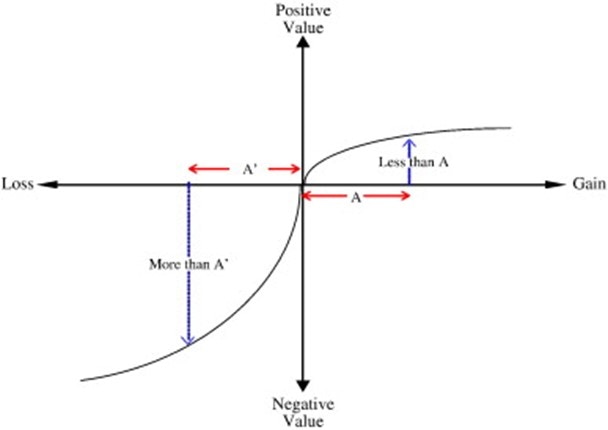
In fact, they found that the feeling from a win tends to flatten after a certain percentage gain. In other words, the feeling an investor gets from a 100% gain is roughly the same as an investor gets from a 200% gain. However, the study found that there is no limit to the feeling that we experience as humans from an ongoing loss. What makes this even more interesting is that losses are capped at 100% while wins can extend to +1,000% or even +10,000%. Therefore, wins should be exponentially celebrated and yet the human psyche does not allow positive emotions to compound. Instead, investors feel negative emotions more deeply and the fear of unrealistic outcomes (such as a stock going to $0) catalyzes selling at the low.
Without a plan to rationally counter the emotional side of investing, investors are prone to buy at the top, and sell at the bottom, and/or forget their time horizon.
Considering that right now the market is registering extreme levels of fear, we thought it would be good to provide more context as to how previous markets have performed following this level of negative emotion.

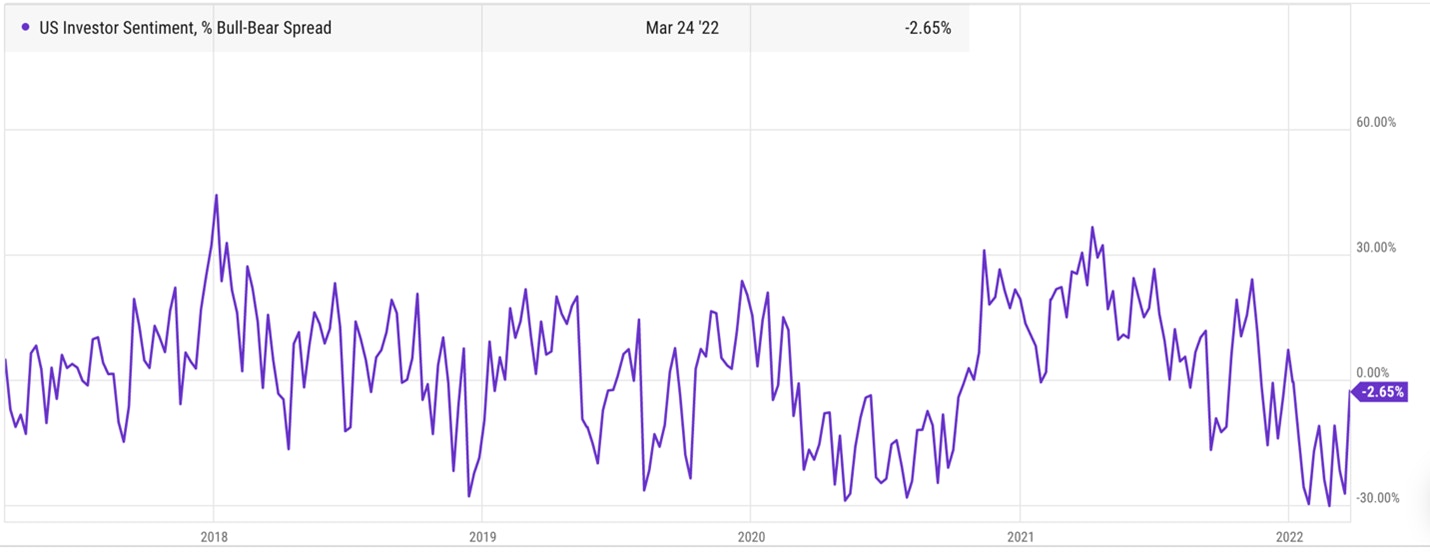
Pictured above: The AAII Sentiment Survey which shows the spread between bulls and bears. Recently, the spread was more bearish than at the Covid low of March 2020. Source: Ycharts
S&P 500 below its 50/200 Simple Moving Average
One of the arguments I frequently see is that the S&P 500 has closed for multiple days below the 50-day moving average (MA) and the 200-day MA. However, it’s important to look back at what happened every time SPX closed three days below these moving averages.
Since 1980, the S&P 500 has closed 3 days below its 50-day and 200-day MA a total of 25 times. Only four of these times resulted in a secular bear market.
- Regarding the other 21 times, from the moment the index broke the 50/200 day MA, we saw new highs within 3.5 months, on average.
- The four times that resulted in a secular bear market, we saw ATHs, on average, within 3.6 years from the moment that we broke the 50/200 day MA.
Daily RSI 22
The relative strength index (RSI) is a popular way to measure momentum in an advancing trend. If the RSI is making lower highs while price is making higher highs, it can signal that the trend is getting weaker.
The RSI is also used to measure oversold and overbought conditions, considering it is an oscillator that moves between 100 and 0.
Since 2002, the daily RSI on the S&P 500 has only gone below a reading of 23 a total of seven times. Six months after this reading of <23, the market was positive every time, ranging between +3% after the October 2008 reading, and as high as 25% after the 2011 low.
Interestingly, six out of the seven times this reading happened, we saw another low in the market before a bottom was struck. On Jan. 27 we saw a reading of 23 on the S&P 500 daily RSI, followed by a new low.
Apple in 2000
We continuously hear the current bull market being compared to 2000. This argument has been made too-often and especially since 2015. Yet, from the start of 2015, the NASDAQ100 is up +220%, including the current drawdown in 2022. Investors had to weather an average annual drawdown of 17.8% in order to capture this return. It is no surprise that volatility goes hand-in-hand with tech investing, as most accept this reality. But, what about during a secular bear market.
The big fear is walking into a secular bear market that is led by tech, just like in 2000. We hear examples of QCOM and CSCO going down over 80%, and how it took QCOM 20 years to reclaim its highs and CSCO has never reclaimed its high. These are catastrophic losses that can destroy a portfolio without an exit strategy and position sizing strategy.
Yet, few talk about Apple reclaiming its 2000 high in just over 4.5 years, or how Apple reclaimed it 2007 high in under 2 years. The same can be said about Google, Amazon and Salesforce. Google reclaimed its 2007 high in just under 5 years, AMZN made new highs just over 2 years from its high, while Salesforce made new highs in less than 2 years. Keep in mind, these were devastating secular bear markets. The 2008 bear market was so harsh that it has been dubbed the Great Recession.
It's unlikely most would hold these high beta stocks in a clear secular bear market. However, if one did have a +5 year time horizon, a buy and hold on the right tech stocks would have been quite rewarding.
Sign up for I/O Fund's free newsletter with gains of up to 403% - Click here
So, what’s the difference between Apple, Google, Amazon, Salesforce and Cisco and Qualcomm? In one word – microtrends. Apple was right in the middle of the personal computer microtrend in the early 2000s, and beginning to disrupt the music industry with its iPod, while releasing the first iPhone in 2007. Google and Amazon were setting themselves up to capture the internet/mobile microtrend and Amazon was trailblazing a path for the e-commerce microtrend while quietly building cloud IaaS in the background. Salesforce was also growing rapidly as one of the first software-as-a-service companies on the market that helped enterprises organize their sales and marketing departments.
We are invested in companies that are in the middle of powerful tech microtrends. These are companies that have superior products, and are growing revenues by mid to high double digits and raising guidance, mostly. If the company has a miss, we closely track the macro headwinds and make strategic bets on when those headwinds will clear (supply chains, for example).
These are companies that we thoroughly vet on product, fundamentals and technical. Our time horizon is TRULY +5 years, and behind our various and robust risk management protocols, there are specific stocks that we do not plan to sell based on our research and the magnitude of microtrends just starting.
This doesn’t mean we are inflexible. When Zoom Video guided for one of the lowest growth rates across cloud – and subsequently missed this guide, we closed the position. We will gladly revisit Zoom as the product grows and the management team decides which market and TAM it wants to tackle next. Meanwhile, in contrast to closing Zoom, we believe ad-tech is seeing temporary headwinds and have been building positions here.
The Path we are Following
The only way that I know how to truly measure sentiment in a robust and mechanical way is through technical analysis. We see the exact same technical patterns and Fibonacci ratios in play in the mid-late 19th century in the Dow Jones Industrial Average, long before anyone knew to map price patterns. Human sentiment is quantifiable, and measurable, which is why I use technical analysis.
It is true, this time is different, just like every other event that caused a fear driven drawdown. What has not changed is human emotion, and how the measurement of this force manifests when funneled into a market.

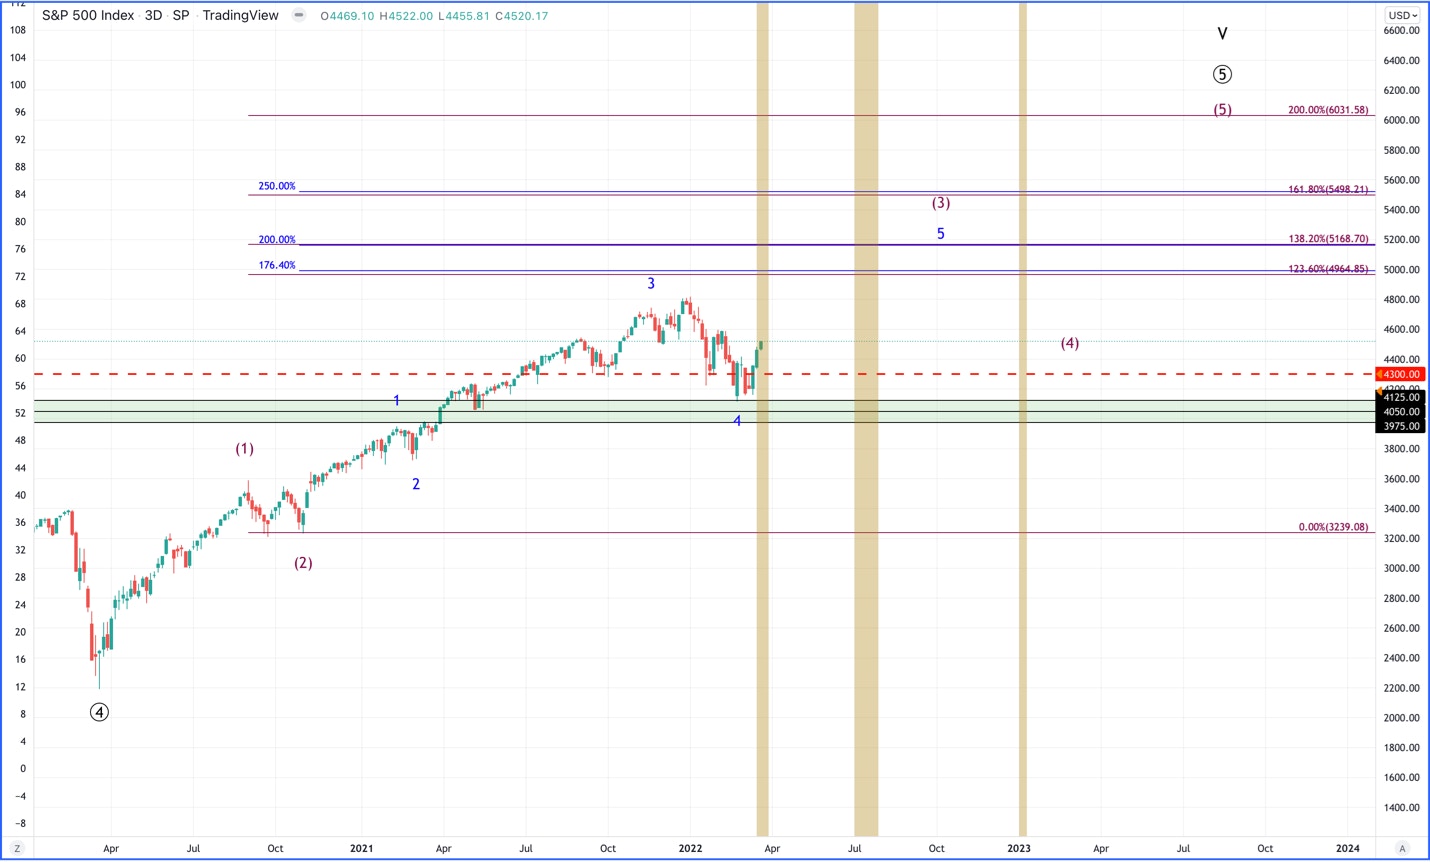
I’ve showed our Premium Members a variation of this chart since late 2020. As of now, the current correction falls directly into the minor 4th wave targets outlined in blue, with room to go, if a bottom hasn’t been struck. As long as we can hold the 4300 break out, the odds will start to build towards a low being in.
I believe that with sentiment as low as it is, the level of bearish bets as well as the economy not being as abysmal as most think, we are setting up for a multi-month uptrend that should take us +5000 SPX.
In conclusion, the same Teflon market that shrugged off countless bear market events over the last 12 years, appears to be alive and well today.
Can it let go and crash? Of course; no one knows for certain. However, if we let history, market patterns and sentiment guide us, giving this bull market the benefit of the doubt has paid off for 12 years. We remain flexible at all times, yet we side with the bulls that this market could give us at least one more all-time high.
The I/O Fund is a team of analysts who share their research publicly as they build a portfolio of 20 stocks. Our team has record results for a retail Fund and we also have four-digit gains on some of our free newsletter coverage. You can learn more about our premium service by clicking here or sign up for our free newsletter here.
Disclaimer: This is not financial advice. Please consult with your financial advisor in regards to any stocks you buy.


More To Explore
Newsletter

Big Tech’s Free Cash Flow is Turning Negative – Who's Next?
Big Tech’s AI revenue is accelerating, but free cash flow is moving sharply in the opposite direction. Across Google, Microsoft, Meta and Amazon, capex is rising much faster than operating cash flow a

Big Tech Earnings Preview: Is AI Monetization Finally Catching Up to Capex?
The most pronounced difference between 2026’s tech rally compared to rallies in the past is which companies have been left out of it. The names most associated with the AI trade have hardly participat

Nvidia, CXL, and the Battle to Improve AI Inference Economics
This is Part 2 of our two-part series on AI inference economics. In Part 1 — Why Nvidia's Next AI Battle Is About Tokens per Watt, we laid out why tokens per watt has become the defining metric for in
Why Nvidia’s Next AI Battle Is About Tokens per Watt
As hyperscalers move from building AI infrastructure to monetizing it, tokens per watt helps to reflect if revenue is scaling and if profitability is improving. Offload engines can increase tokens per
Micron Is Up 900%. Here’s Why the AI Memory Trade May Still Have Room to Run
Over the past 10 months, memory chip stocks have gone from being solid beneficiaries of the AI boom to capturing a massively outsized piece of the return pie. The inflection in Micron’s performance de
Why the S&P 500 Shrugged Off the Iran War — and What Could Finally Break the Rally
On February 28th, the U.S. went to war with Iran, and the market was handed the kind of shock it hasn't contended with for years. The conflict set off a chain reaction across the region: an ongoing su

Nvidia, CoreWeave, and Nebius: Inside the Circular Financing of the GPU Boom
Neoclouds are one of the more hotly debated AI business models, with CoreWeave and Nebius being the two most widely recognized names. These companies have seen their sales, backlog, and share prices s

AMD, Nvidia, Arm, Intel: Inside the $120 Billion CPU Gold Rush
CPUs have gone from an afterthought to becoming the AI trade’s next great bottleneck – and with AMD, Nvidia, Arm and Intel circling a market that is doubling nearly overnight, the only question left i

Google TPU v8 vs Nvidia: How Inference Is Rewriting the AI Market
In April, Google announced it would begin selling its TPUs to select third-party data center operators, which is something the market has anticipated for nearly a decade. The TPU-versus-Nvidia-GPU deb

The AI Networking Stock That Beat Nvidia by 7X YTD for Returns of 135% YTD
AI networking stock Lumentum is among the key I/O Fund winners in 2026. We allocated heavily to LITE in January—a month before Nvidia backed the company. While most investors couldn’t stomach taking a
