Bonds Are Breaking, the Fed Is Boxed In: Why Stocks Can Keep Rising
Knox Ridley·OCT 16, 2026·16 min read
On this page
In last week’s report, we laid out the case for a continuation of the secular bull market for months to years, which would be led by AI. From our analysis, we believe the best gains are yet to come; however, we will have to contend with a brief period of volatility, which we warned our readers about.
“On a shorter timeframe, the S&P 500 appears to be setting up for a high of some kind into this cycle window…At minimum, we would then expect a pullback to the 7,300–7,265 area. If 7,265 breaks, the next target is 7,000–6,683.”
Since that report, Semiconductors dropped ~10%, signaling this period of volatility has likely begun. How long and deep this correction runs depends largely on the deteriorating macro backdrop, which is forcing a readjustment to risk exposure while the market digests a new norm.
The yield on the 10-year US Treasury just broke to a new high, reaching roughly 5.35% intraday – a level not seen since 2002. This may not seem like much, yet when analyzed in the context of growing US deficits, it quickly becomes a major problem. This breakdown in bonds is causing a chain reaction in Monetary Policy and the U.S. Dollar, which is depleting global liquidity.
In this report, we will unpack the current macro-backdrop. We will explain why this breakout in yields matters, why the U.S. Dollar remains the key, and why growth in the economy should put a floor under any extended period of volatility.
Record Consumer Spending Is Putting a Floor Under Stocks
There are a handful of macro forces that have a history of affecting equity markets, ranging from growth, inflation, liquidity, sentiment, fiscal and monetary policy. Of these, one of the most important factors which largely determines secular shifts in the equity market’s trend is growth.
While the market is focused on bond yields moving higher, and FED policy becoming more restrictive, not many are discussing the unusually high level of growth unfolding in the economy. We are in a rare period where nominal private sector growth, as measured by domestic private demand, grew at a 9.5% annualized rate in Q2. This is more than double the pre-COVID growth of 4% to 4.5%. Roughly half of this growth is real, at 4.6% after inflation, which is still well above pre-COVID trends.
Furthermore, when we dive into the data, what we find challenges the assumption that the AI CAPEX buildout is the primary driver of economic activity. While this narrative was true in 2025, it doesn’t represent the full picture in 2026.
Most AI spending shows up in GDP under business investment (nonresidential fixed investment). That category covers software, information processing equipment, R&D, structures such as data centers, and other equipment. Its contribution to real GDP growth decreased from 1.4 percentage points in Q1 2026 to 1.2 percentage points in Q2, using BEA’s revised data released September 30th.
While the business investment share of the total contribution to GDP decreased, the QoQ growth figure was +3.6% in Q2. What this means is that investments in US businesses were not the primary driver of Q2 GDP, which may surprise many readers. The biggest driver of growth was consumer spending. This segment’s contribution jumped from 0.5 percentage points in Q1 to 2.5 points in Q2, more than all of Q2’s 2.2% growth rate. So, not only is AI spending in the economy still expanding, but the US consumer is also leading the current growth in the economy.
It is unlikely to see the start of a meaningful bear market in equities when growth is this robust. The growth picture alone confirms the larger secular trend higher that we outlined in last week’s report. However, this does not mean that we cannot see other meaningful macro forces cause a temporary period of volatility.
10-Year Treasury Yields Hit 2002 Highs as $40 Trillion Debt Boxes In the Fed
While the growth backdrop is historically very strong, which would typically support a secular uptrend in equities, the two segments that could lead to a correction now are Monetary Policy and Liquidity.
The above-trend growth in the economy we just discussed has been happening while inflation was running well above the FED’s arbitrary 2% target. The FED has been easing into this environment with their rate cutting campaign that started in 2024, until they reversed course with a rate hike on September 16th.
As a result of an economy running hot in tandem with a Fed that has been stimulating, bond yields are starting to break out (and bond prices to break down) to levels not seen in nearly 25 years.
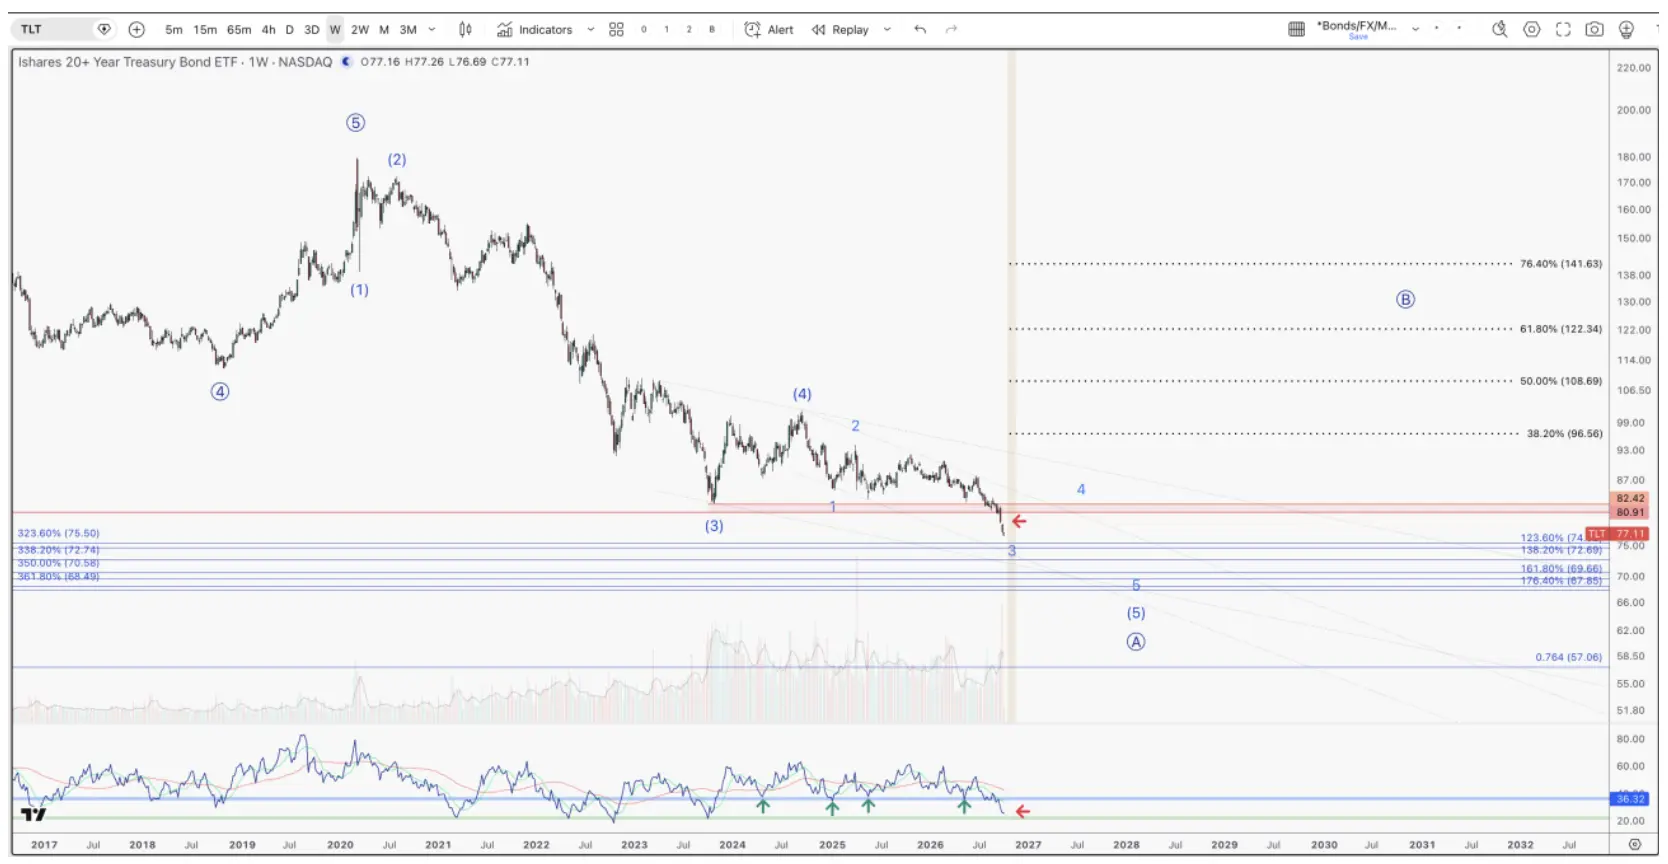
The iShares 20+ Year Treasury Bond ETF (TLT) has fallen more than 50% from its August 2020 peak, marking the deepest drawdown in the fund’s history. The breakdown supports the view that the four-decade bond bull market may have ended as inflation and fiscal pressures push long-term yields higher.
What drives yields in long-duration bonds is growth and inflation expectations. A stronger economy pushes prices higher to meet a growing demand for goods and services. Rising inflation is not an environment in which one wants to hold a fixed yield, as the purchasing power of that yield diminishes the higher inflation goes.
Fiscal Dominance Is Limiting the Fed’s Options
The breakdown in bonds is the market signaling loudly that the FED has been too accommodative by demanding a higher yield for holding this debt. However, unlike over the prior decades, the FED is very limited in what it can do to address inflation concerns due to the current fiscal problems in the U.S.
Our debt sits at $40 Trillion, while our GDP sits at roughly $32.5 Trillion. We are currently spending ~21% of all tax receipts just to service interest on the debt. The last time the 10-year yield was this high in 2002, we were only spending 9% of tax receipts to service the debt.
Furthermore, our tax receipts are unable to fund our spending needs. In fiscal year 2026, the government spent $7.4 Trillion while collecting $5.4 Trillion in taxes, leaving a $2.0 Trillion deficit that we have to borrow/create. This equals roughly 6% of our total GDP.
Now consider what happens when the FED raises rates to fight inflation. It only increases the borrowing costs of the U.S. Government. In other words, we now have to increase our deficit due to the increase in yields the FED caused. This means more borrowing, which means more inflation over time.
So, while the FED is attempting to look tough on inflation, the fact that they raised the short end of the curve will only exacerbate the US debt problem. And, keep in mind, bonds are breaking down because the FED was too accommodative. They were making borrowing too easy, which also puts more money into the system, causing inflation over time. This no-way-out scenario is what is called “fiscal dominance.”
In our view, no matter what the FED does, it will likely increase inflation due to the massive deficits we are running. This effectively removes the FED as the primary driver of monetary policy in exchange for the Treasury.
Why a Strong U.S. Dollar Is Driving Global Bond Yields Higher
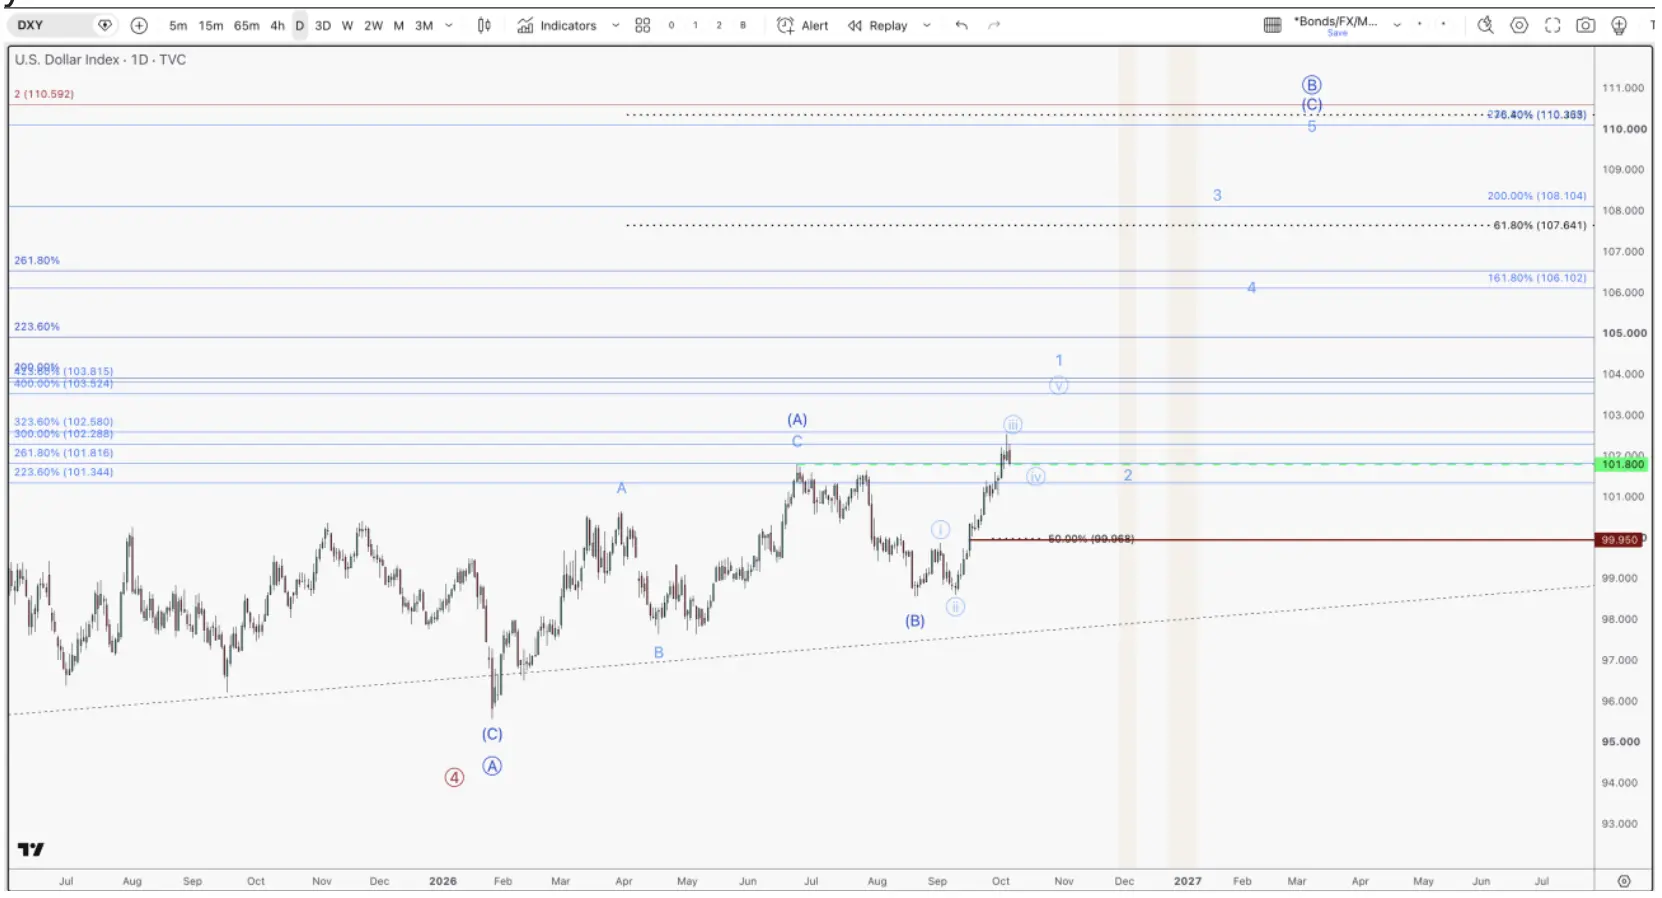
This chain reaction is spreading into the Dollar Index, which can be seen in the breakout in the chart below.
The U.S. Dollar Index (DXY) has broken above a key resistance zone near 101.8, confirming a stronger uptrend after months of consolidation. If the breakout holds, the chart suggests potential upside toward the 106-110 range, reinforcing the view that a stronger dollar could tighten global liquidity, pressure foreign borrowers with dollar-denominated debt, and contribute to rising global bond yields.
The U.S. Dollar Index (DXY) has broken above a key resistance zone near 101.8, confirming a stronger uptrend after months of consolidation. If the breakout holds, the chart suggests potential upside toward the 106-110 range, reinforcing the view that a stronger dollar could tighten global liquidity, pressure foreign borrowers with dollar-denominated debt, and contribute to rising global bond yields.
As bond yields break out in the US, the FED has been forced to tighten monetary policy in reaction, raising rates on September 16th for the first time in three years. When rates go higher, this naturally makes the US dollar scarcer, which creates its own liquidity issues, and it also attracts money into the US considering bonds are now paying higher yields.
Considering there is an estimated $84 trillion of dollar obligations outside of the US, the higher the dollar moves in comparison to foreign currencies, the more foreign borrowers must spend of their local currency to service their dollar debt. Foreign investors naturally sell assets like equities and bonds to meet their obligations, which is why global liquidity is so linked to the behaviors of the U.S. Dollar.
Another consequence of a rising dollar is that money must leave a foreign economy to access a more expensive dollar, which pushes foreign government yields higher – i.e., foreign governments now must borrow more to fund spending, just like the U.S.
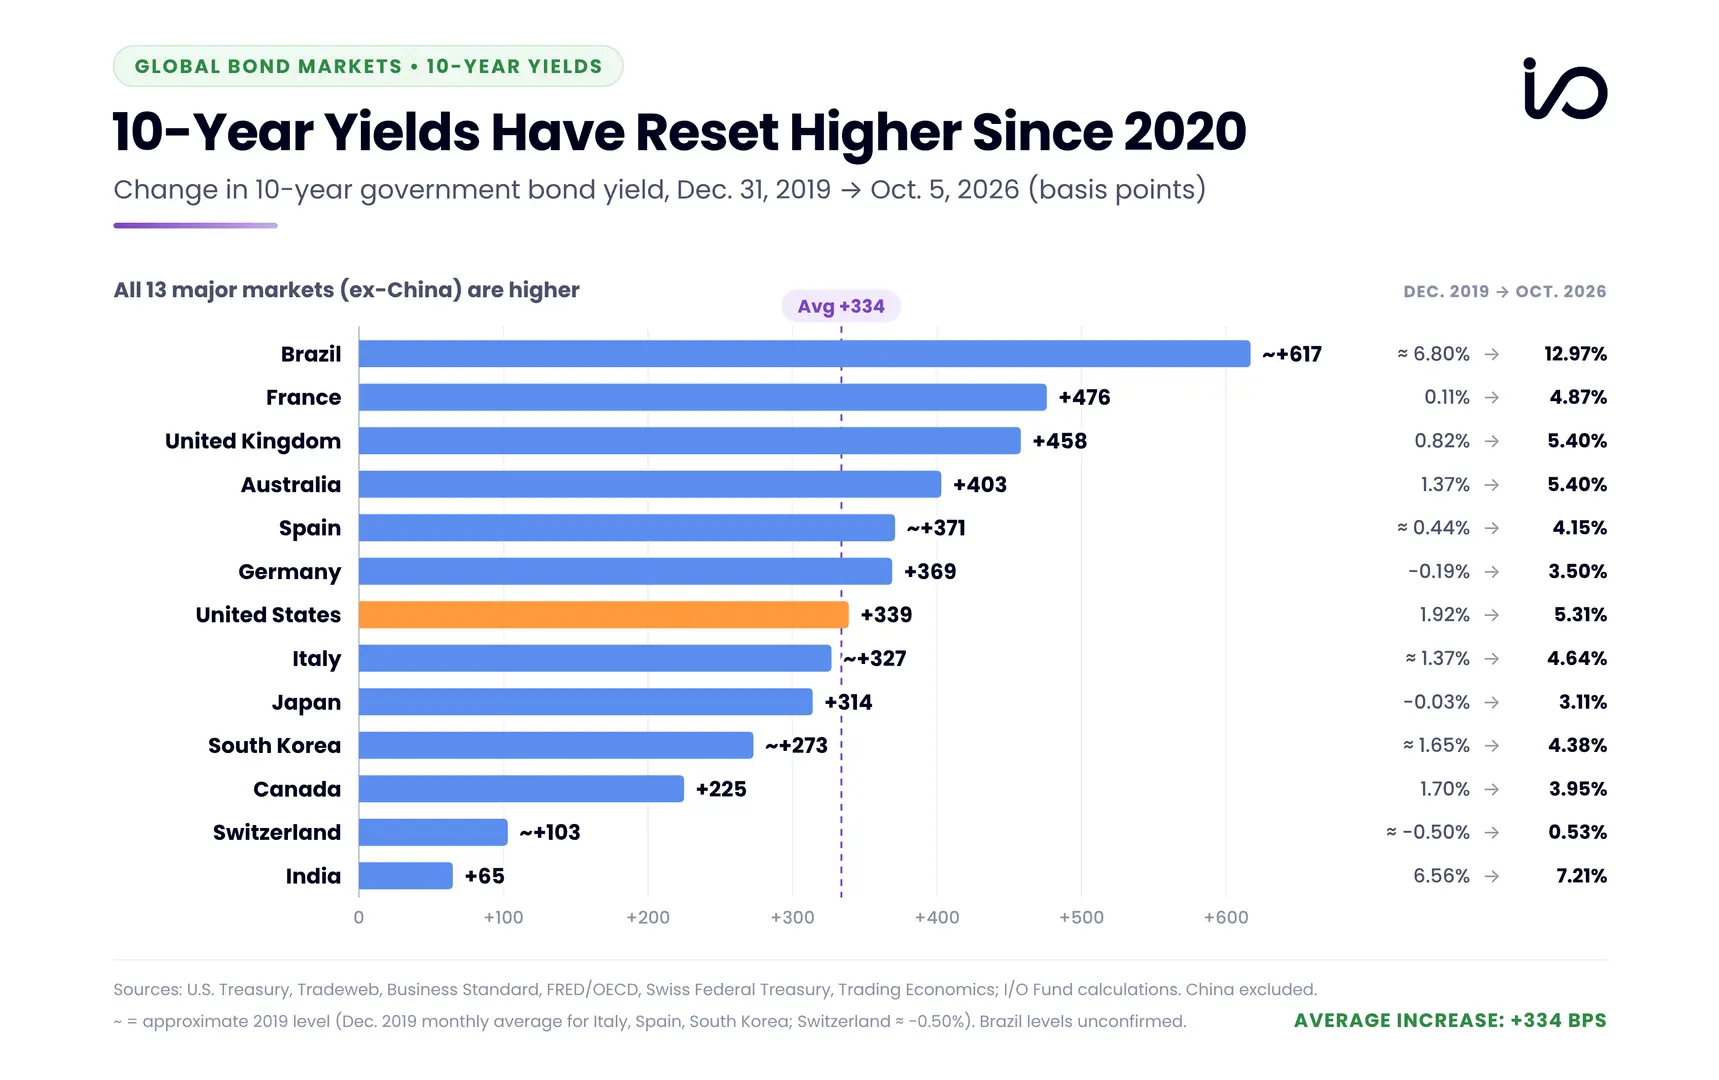
This behavior is clearly seen in global bond yields, which are rising along with the U.S. 10-year yield. In fact, since bond yields bottomed in 2020, the U.S. has not been alone: 10-year yields in the U.K. and France have hit multi-decade highs, and Germany’s has reached its highest level since 2008.
Since the end of 2019, 10-year government bond yields have risen across all 13 major markets shown, with an average increase of roughly 334 basis points. The broad-based rise in yields highlights that the bond market selloff is a global phenomenon rather than a U.S.-only event, reflecting higher inflation, tighter financial conditions, and growing fiscal pressures worldwide.
Get Our Free Weekly Stock Newsletter
Get weekly stock insights, market analysis, and technology updates straight to your inbox.
Weekly stock insights
Market analysis
Technology updates
This matters because foreign corporations and governments owe an exorbitant amount of debt in a currency they can’t print. The higher the dollar goes, the harder it becomes to service this debt, increasing global risk. As foreign currencies are sold to chase a higher dollar, money inherently flows into the US markets, which pushes yields on foreign debt higher. Not only does a rising dollar exert pressure on foreign private sectors, but a growing yield on foreign government bonds exerts pressure on their public sector.
As bad as the U.S.’s fiscal situation is, and as bad as the breakout in bond yields could become, it’s worse in other countries. Most importantly, there is a persistent demand for U.S. dollars in the world while there is a very limited demand for almost every other country’s currency. We can print the money we owe, while other countries cannot. This puts the U.S. in a unique situation.
Seeing the United States within the context of this global system makes our debt burden, fiscal dominance and bond market breakdown much more palatable and preferable on a relative basis. The problem with this dynamic is that it is good for the U.S. on a relative basis and bad for everyone else. As the dollar goes higher, the stress on foreign countries will only grow, attracting more money into the U.S. in a flight for safety.
The Historic Bond Market Crash Signals a Return to Secular Inflation
As much as pundits and politicians may speak of wanting a stronger dollar, as you can now see, the global community, and ultimately the U.S. as well, has a critical interest in keeping the U.S. dollar lower. This dynamic ties into the growing deficits that have no real solution, along with a FED that is quickly becoming secondary to the fiscal needs of the U.S. Treasury.
What all of this means can be seen in the bond market, where long-term Treasuries are breaking down. Long-term Treasury bonds (as tracked by TLT) have fallen more than 50% from their August 2020 high, the deepest drawdown in that fund’s history. This breakdown in bonds, which is still playing out, is also the largest drop in bonds in U.S. history, dwarfed only by the drop in bonds surrounding the Napoleonic War.
The secular trend in bonds is shifting right in front of our eyes, and what this means is one of the most important shifts in macroeconomics and investing in over 40 years.
To most investors, it is a foregone conclusion that bonds and stocks tend to move in opposite directions. This realization was the foundation of the 60/40 portfolio that treated retirement accounts well throughout the decades. However, this was not always the case.
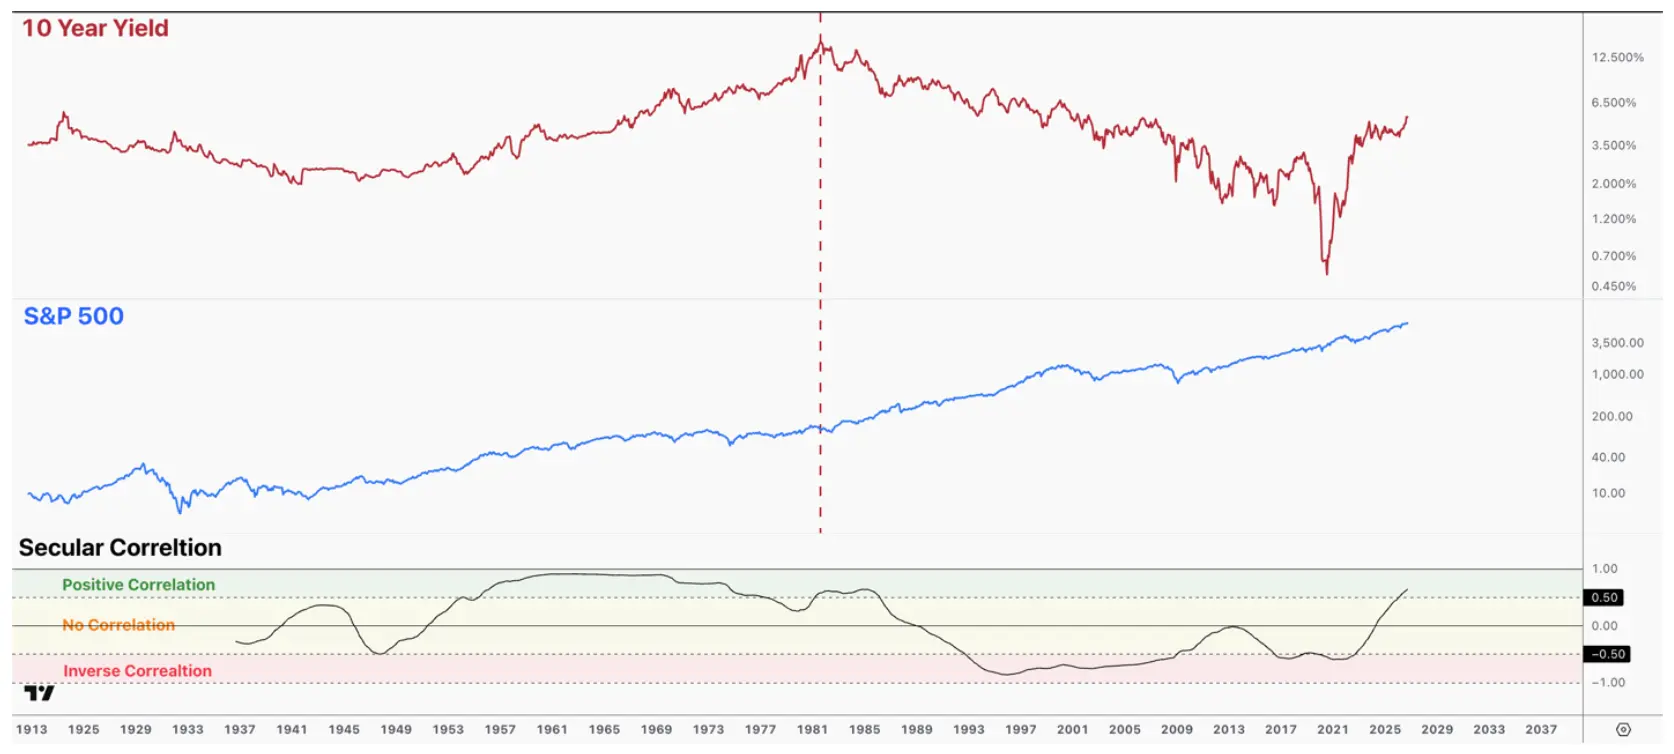
The below chart shows the 10-year yield compared to the S&P 500 since the 1940s. The indicator below shows the secular correlation between the two. When the correlation is between 0.5 to 1.0 it is signaling a high correlation between the two markets being compared. A reading of -0.5 to -1.0 shows a market that is inversely correlated.
The relationship between stocks and bond yields has shifted across market regimes. From the 1940s through the early 1980s, the S&P 500 and 10-Year Treasury yields generally moved in the same direction, while the disinflationary period that followed produced the inverse relationship investors know today. The recent rise in correlation suggests stocks and yields may once again be moving together as secular inflation returns.
As you can see, from the 1940s through the 1980s, the correlation between bond yields and the stock market was the opposite of what we believe today. Both yields and stocks moved in unison until the early 1980s, at which point they began the known inverse correlation that we are familiar with today.
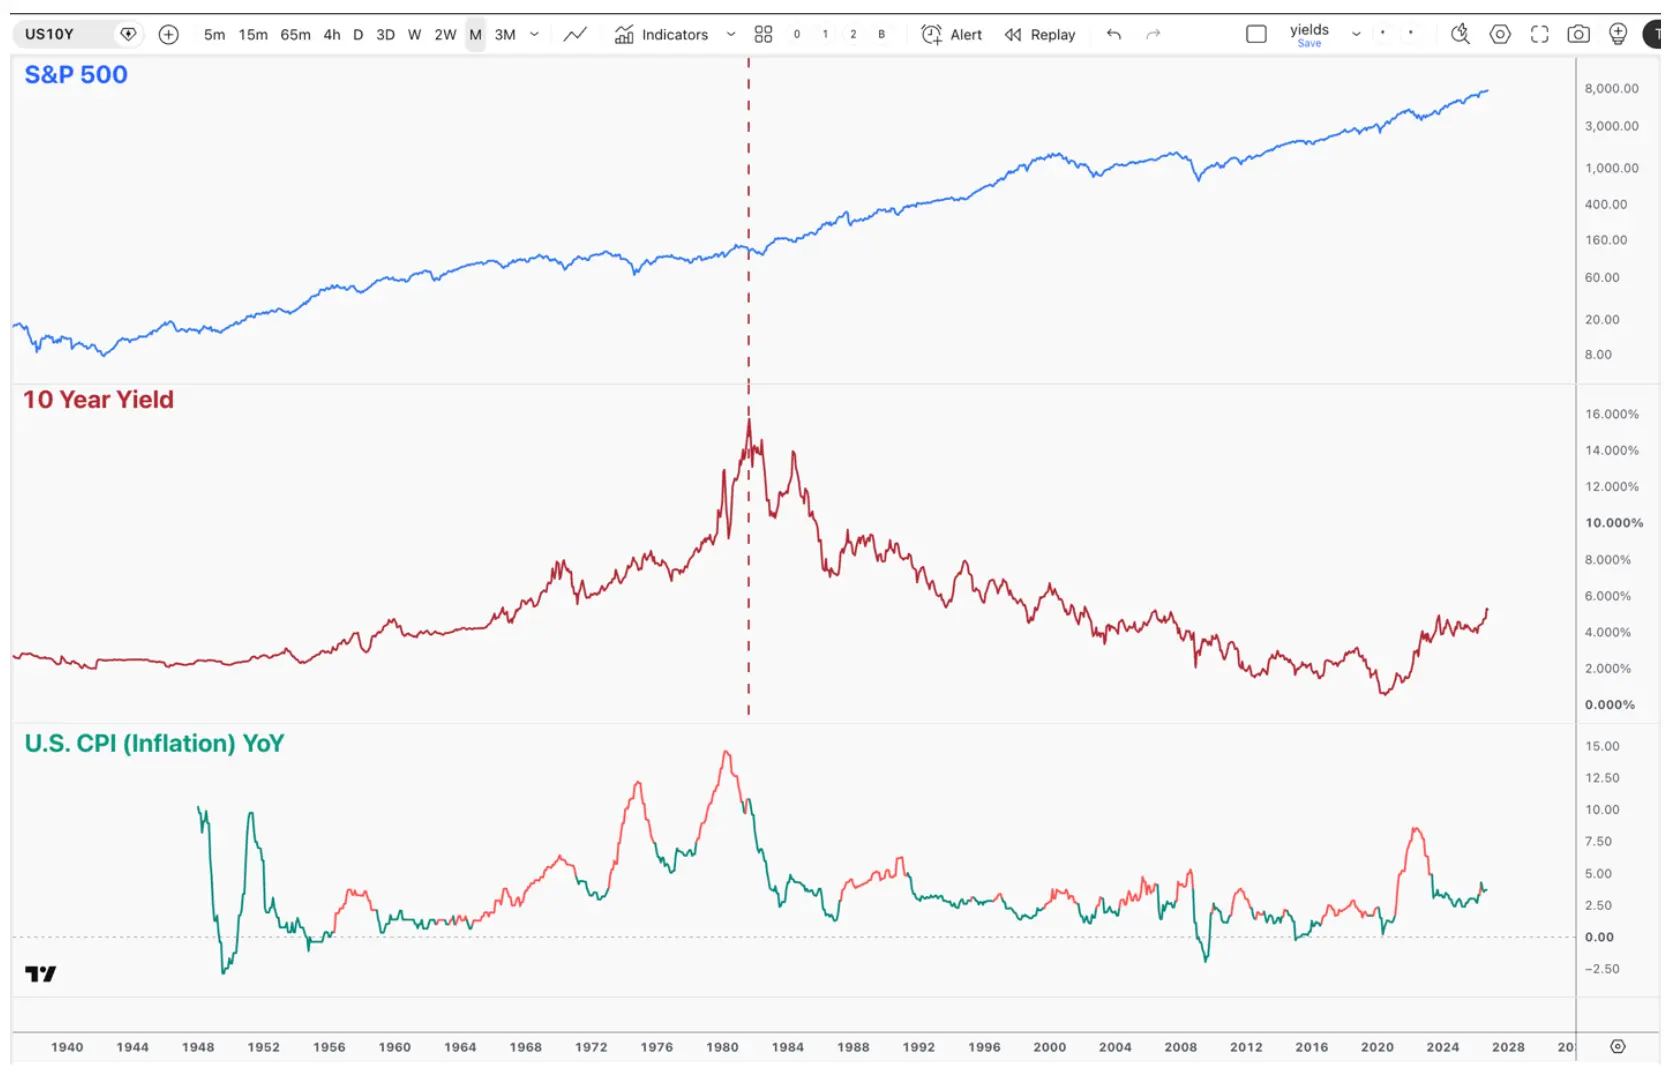
What shifted was the secular trend in inflation, which can clearly be seen when we overlay the YoY change in U.S. CPI on the chart above.
The relationship between stocks and bond yields has historically been driven by inflation. During the inflationary period from the 1940s through the early 1980s, the S&P 500 and 10-Year Treasury yields generally rose together alongside higher inflation. The shift to a disinflationary environment after 1980 coincided with falling yields and a decades-long bond bull market, while the recent rebound in yields may signal the return of a more inflationary regime.
The Inflation Regime Is Returning
From the 1940s through the early 1980s, the US battled recurring waves of inflation: from the debt accrued from WW2, to paying for the Great Society and the Vietnam War, to the inflation of the 1970s.
In the 1980s we saw the secular shift in inflation give way to a secular deflationary trend, which is the world we are all familiar with. This was supported by the tailwinds of a nascent move to globalization, the boomers, then the largest generation in US history, entering their prime working and spending years, the implementation of advancements in computer and IT productivity, and a FED that was starting with a Fed Funds rate near 20%.
This trend went as far as 0% rates for roughly nine years in total in the US, while other countries were experimenting with negative interest rates – a policy with virtually no precedent across roughly 5,000 years of recorded interest rate history.
What the above chart also shows is that this secular downtrend in yields likely ended with the 2020 low. What defines a downtrend in technical analysis is a series of lower lows and lower highs. Since the 1981 top in yields, this definition held until 2022, when the 10-year yield made its first higher-high, breaking the downtrend pattern.
Whether the world wants to believe it or not, the bond market is signaling an uncomfortable truth, which is backed up by supporting tailwinds. We appear to be in the early days of a return to secular inflation. The world appears to be decoupling from globalization, rejecting its outcome through the rise of populism. Instead of seeking the most inexpensive source globally, we are now seeing a shift towards more expensive domestic and regional alternatives, which will naturally increase prices. This is happening while global debt sits around 310% of GDP, with a significant share of foreign borrowing in U.S. dollars, and no way to pay it off aside from printing the money needed.
Conclusion
In conclusion, we believe we have crossed an important milestone; no matter what the Fed does, the likely outcome is the same – inflation. However, equally true, the growth in the U.S. is rare and truly historic. This will likely continue to put a floor under any bout of volatility that we see in Q4. Our levels from last week’s report remain in place: a pullback to the 7,300–7,265 area, and if 7,265 breaks, 7,000–6,683.
That tug-of-war is why we expect a correction, not a bear market. As long as growth remains robust, and AI earnings remain promising, earnings should outpace the higher discount rate, and we can see yields and stocks go up together.
The I/O Fund has built a strong track record in lesser-known AI winners, including an energy stock up more than 1,300% since our initial entry last year, an optical networking stock up 325%, and two of our largest AI positions up 183% and 130% year to date.
Our portfolio is up over 70% YTD—3X the Nasdaq-100—and we are crushing influencer-led tech ETFs both on a YTD basis and cumulative basis.
We publish more than 100 paywalled articles each year on AI stocks, supported by an actively managed portfolio and real-time trade alerts.
Please note: The I/O Fund conducts research and draws conclusions for the Fund’s positions. We then share that information with our readers. This is not a guarantee of a stock’s performance. Please consult your personal financial advisor before buying any stock in the companies mentioned in this analysis.