Banks, Inflation, and One More Low
March 16, 2023

Knox Ridley
Portfolio Manager
The bear market is not over. This has been our probable thesis since the start of 2023. With the 10-year rates breaking out to new highs, and on-going inflation reports showing a re-acceleration under the headline numbers, it was apparent that the FOMC would need to raise the terminal rate to further fight stubborn inflationary pressures. This realization marked the February top, which has since been intensified by the unforeseen collapse of two large regional banks.
We are open to the bullish narrative; however, it would require a clear and dramatic reversal in the monthly inflationary trends, coupled with no more banks coming under pressure. The needle the FOMC must thread is one of the most delicate in modern history. With inflation still elevated and showing little signs of decelerating in key areas, how much can the FED drop rates, short of a bank contagion? Either way, it does not look good for equities, and until we get signs of this bullish scenario playing out, we will remain cautious and defensive.
Broad Market Analysis
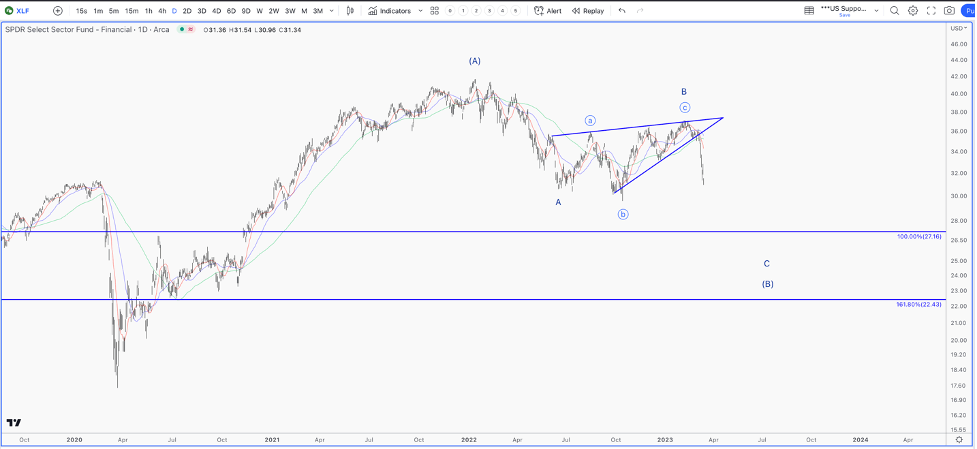
We have been warning our members since early 2023 that this market is unhealthy. Our automated hedge signal went to sell, and we have been hedged since early February; however, the warnings were present long before. We were seeing warning signs in Financials long before the current regional banking crisis. On February 22nd, we even posted a public warning about this sector flashing warning signals.

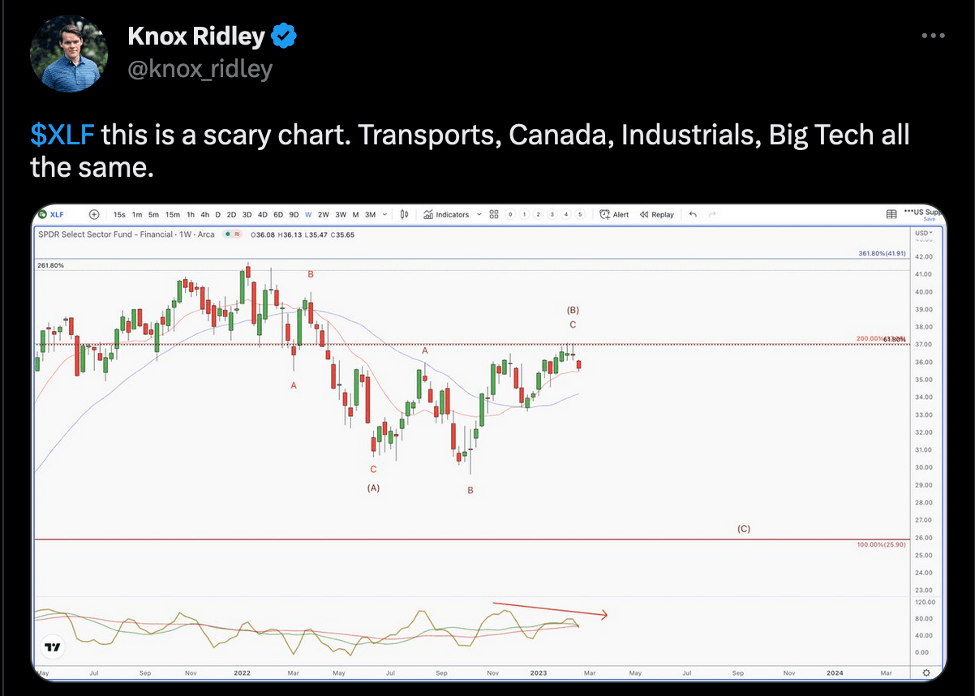
We were seeing a clear bearish pattern forming off the October low, which was confirmed over the last 2 weeks.

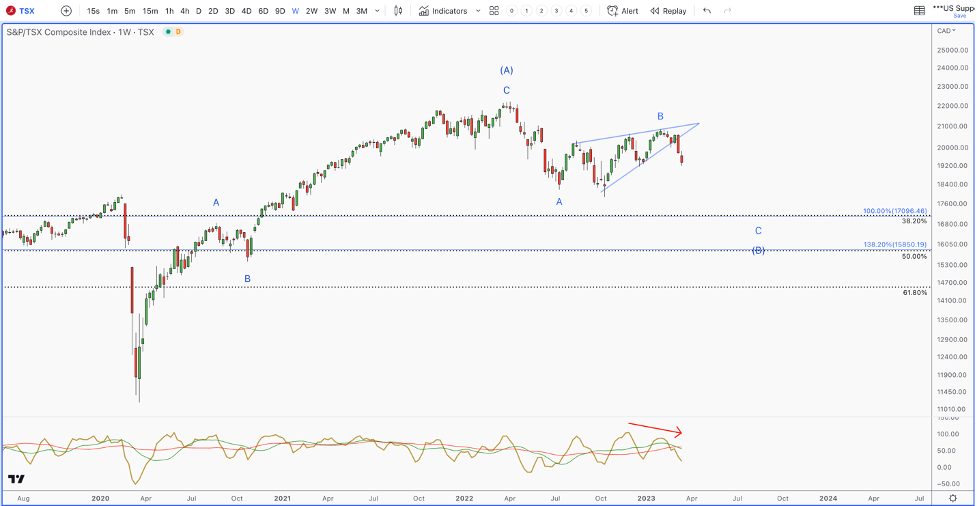
We were also seeing similar warnings in international markets. The reason this was concerning was that if we were on the verge of starting a new bull market, this would likely be signaled across the globe. This was not what we were seeing.
For example, the Canadian TSX has a long history of leading the US markets. This was a very clear bear pennant playing out, which has now been confirmed.

European markets have been relatively strong this year. For those watching, it was actually just a little behind US markets. In other words, the same bearish setup was playing out, just with a lag. So, while many were talking about a US breakout, we were seeing topping patterns in European markets, which did not line up with a new bull market forming.

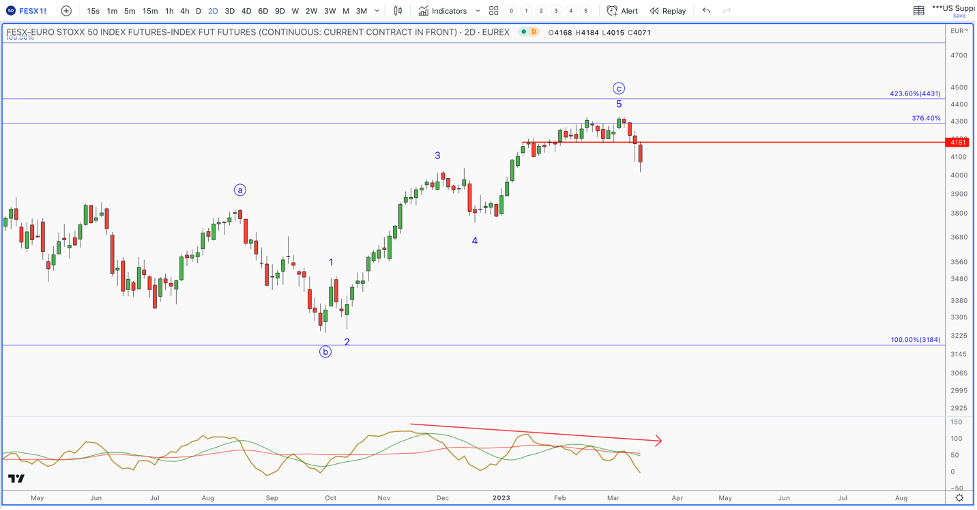
So, where does that leave the US markets? From a technical perspective, the 2022 bear market does not appear to be over. We seem to be tracing a rather complex pattern, which suggests one more large degree 5 wave drop to complete the pattern.
These complex patterns tend to have shallow recovery rallies, much like we saw in July/August, and then again in October/January. Also, another key feature is that the length of each leg tends to be proportionate.
Note: For a Limited Time, I/O Fund is offering a $99/year Premium Newsletter plan that provides one actionable stock tip per month and analysis from a top performing, audited team. Click here for more details
For the first leg, which is marked “W” in the chart below, it broke down into 3 legs, marked A,B,C. Note how the C wave, which bottomed in June, is exactly 150% the length of the A. Regarding the 2nd leg of this bear market, which is marked “Y”, we should expect similar proportions.
Interestingly, if we apply the same measurements, from the recent top in February of 2023, 150% targets the 3050 SPX region. This lines up with several techniques pointing out the significance of this support region. If this pattern is playing out, we will loosely target this zone for some signs of a low being put in.
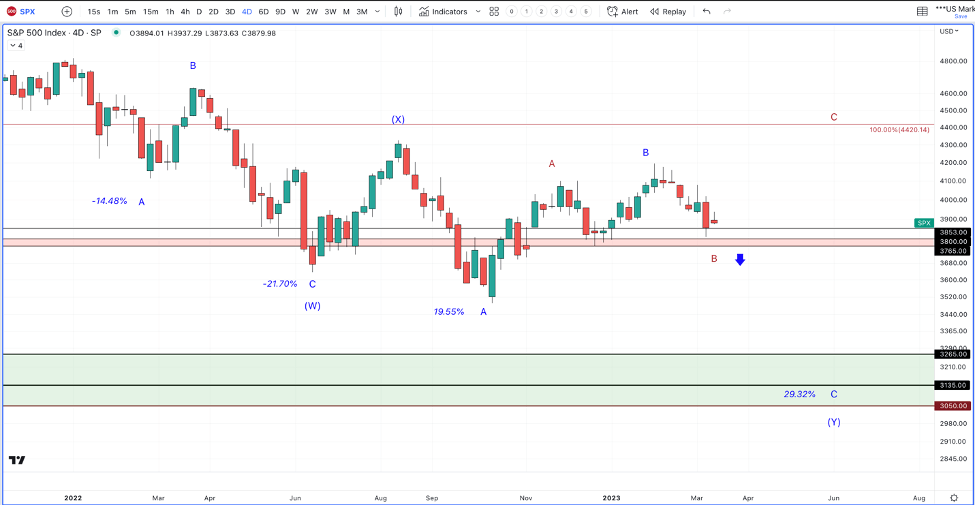
However, we need confirmation that this leg is playing out. The primary pivot will be 3765-3750. If we break below here, I would expect the drop to unfold rather rapidly. As long as we stay above this pivot, there is an off chance that we could see one more attempt at a bullish push higher, before the next leg lower.
Peak Inflation?
On Tuesday, the market celebrated a YoY CPI reading that was in line with expectations. While equities were up, long duration bonds on the other hand were down, which was a warning. This is interesting because what drives the price of long duration bonds is not the FED, but the growth and inflation outlook set by the bond market. With the FED trying to lower rates, and the CPI print coming in as expected, signaling inflation is cooling, you would think the bond market would rally with equities.
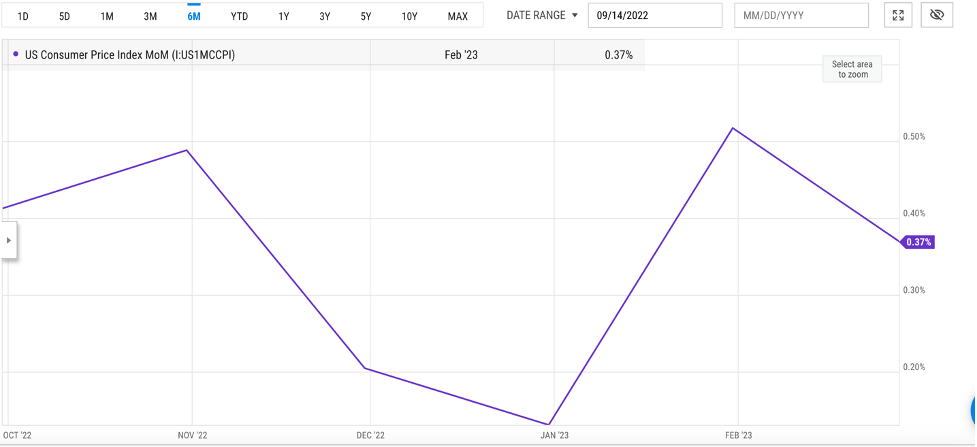
What the headlines were not discussing was that the CPI print was actually much hotter than the YoY print was suggesting. Inflation is best measured on a sequential basis, not a YoY basis. What matters is the trend, not annual comparison. It’s much more important to see if inflation is improving from month to month, not year over year, when tracking the trend.
I prefer to take the 3-month annualized readings to get the best feel for the actual trend. When you add up the prior 3 month readings and annualize them, the number comes out to 4.08%, compared with last month’s reading at 3.4%. This is a concerning rate of acceleration, and marks the 2nd month in a row of an accelerated trend within the CPI data.

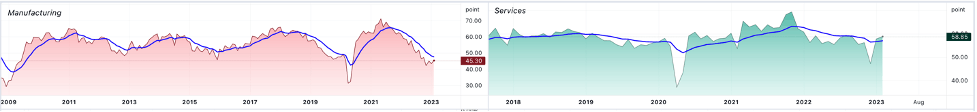
Even more concerning, we are seeing a similar acceleration in energy, core prices, core goods, shelter, as well as services, which has been the biggest concern regarding inflation. The reason why services is so concerning is because it accounts for ~85% of the US GDP and it is still expanding above its 12 month trend.

With an on-going economic expansion comes inflation, which continues to show up in the CPI numbers. There is no question the FED, short of a banking crisis, would have to increase their terminal rate well above 5%, considering both the resilience of the US economy and the stubbornness of inflationary pressures in the services sector. This is why, in light of the troubles in the banking sector, the futures market is still priced in a 25 bps raise at a 50% chance.

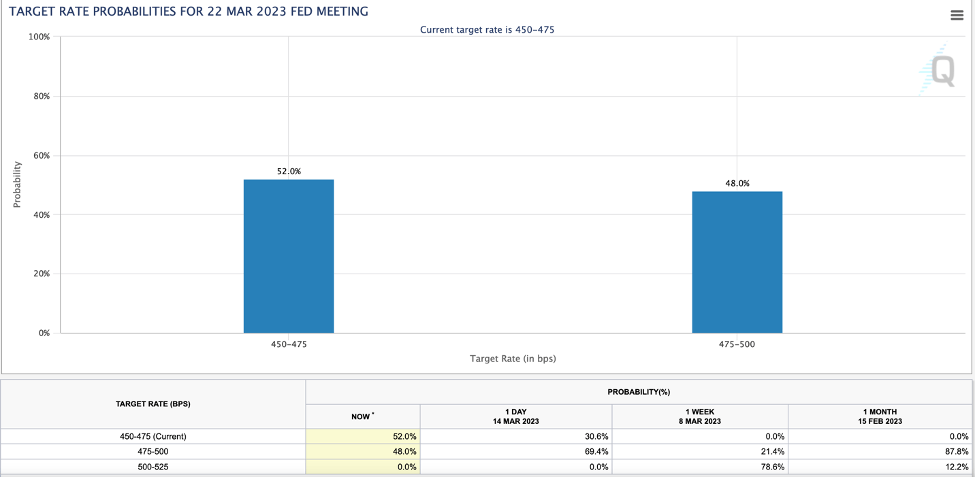
Source: CME Group
What’s more concerning is that the current inflation readings were for February, which was done with Wheat and Energy commodities at subdued prices. If we look at these charts, from a technical perspective, they appear to be either coming to the end of their large downtrends, or in bullish postures, suggesting a bigger breakout is brewing.
Take gasoline, for example. It’s holding the ascending triangle pattern on bullish momentum.

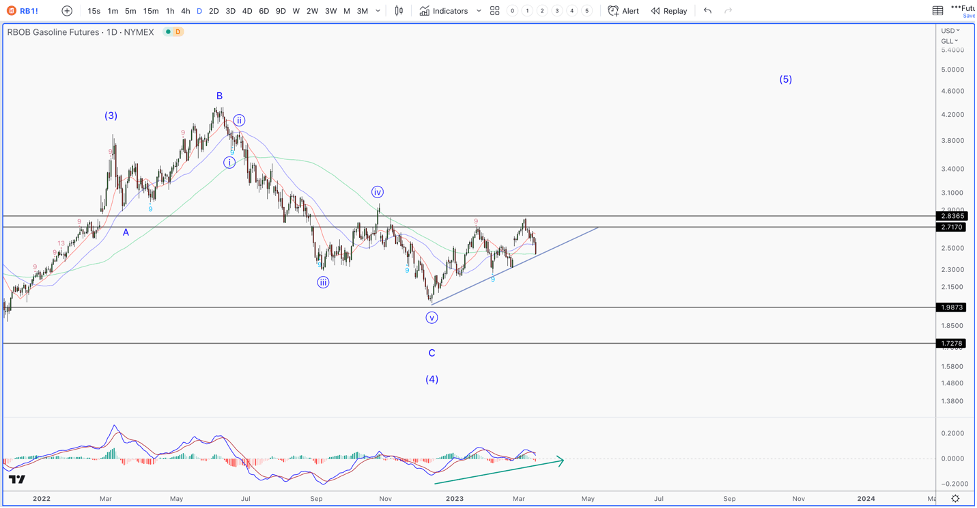
If we see a breakout $2.8-$3 price point, we should see a sharp move higher, which would mean higher gas prices. The same can be said with Wheat, which appears to be coming to the end of a large degree correction.
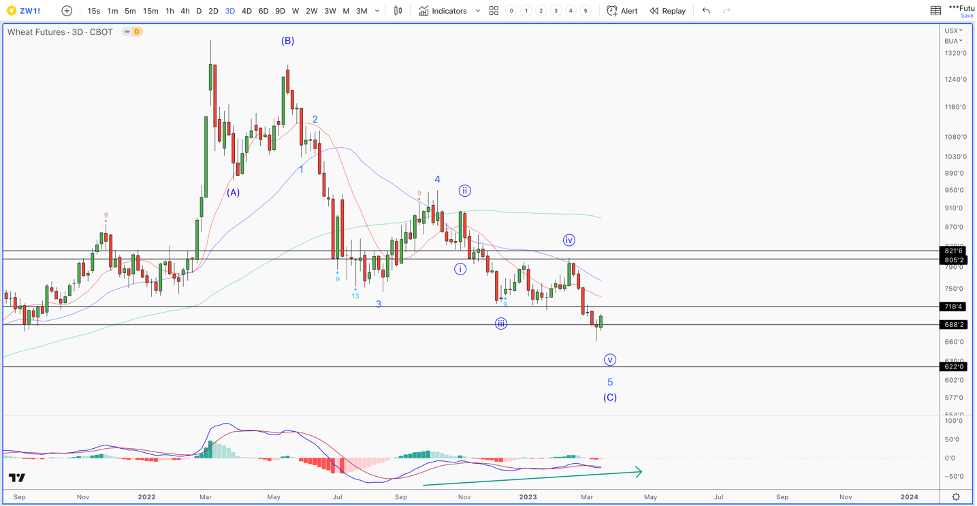
These charts are suggesting a move higher on the horizon, which would not be good for future inflation readings.
Banks Matter
When the market bottomed on October 13th, 2022, it did so on the day that major banks began reporting their earnings for Q3, 2022. Interestingly, some of the larger banks surprised to the upside and even raised their 2023 guidance. What became apparent was that larger banks were thriving in the elevated rate environment.
Through various FOMC policies like 0% interest rates, operation twist, QE programs, etc., banks have not seen 30-year mortgage rates this high in a very long time. Being artificially suppressed, this affected the margins. So, this change was actually a windfall for banks that have been starved for years to make more money on the difference they take in for loans and then pay out on liabilities, also called net interest income (NII).
For example, JP Morgan in Q3 of 2022 reported NII of $17.6 billion, and guided for NII of $61.5 Billion for the year, beating expectations of $58 Billion. Even more astounding, JP Morgan announced that they currently have $1.2 Trillion in excess cash at the time. But, JPM was not the only bank reporting similar growth, we saw similar stories around the October lows from most major banks.
As a result, financials led the market higher into late November, which was signaling a stronger economy than most were anticipating. This was one of the primary reasons why we went on a spending spree in mid-late October. What’s important to note is that when financials are strong, the market tends to be strong, and vice versa.
For reference, there have been two bear markets that saw a greater than 50% drawdown in modern market history: 1929, 2008. They are extremely rare events that have one common theme running throughout each narrative – a banking crisis.
In each instance we saw a rare phenomenon that can be summed up as a loss of confidence in the banking sector. Each instance also saw the credit windows shut for even reasonably capitalized companies, which only intensified the accompanied recessions.
Note: For a Limited Time, I/O Fund is offering a $99/year Premium Newsletter plan that provides one actionable stock tip per month and analysis from a top performing, audited team. Click here for more details
It’s easy to dismiss the financial sector in today’s tech focused market. After all, financials only account for 11% of the total market cap of the S&P 500, with 3 sectors ahead of it. However, all companies depend on loans, and when banks get scared, the credit window shuts, which tends to lead to outsized bankruptcies. Bankruptcies lead to unemployment, which leads to less spending, which snowballs the process into a panic.
With the recent fall of Silicon Valley Bank (SIVB), followed by Signature Bank (SBNY), we saw the 2nd and 3rd largest bank failures in US history. In fact, the run on SIVB was the largest bank run in US history, with $2 Billion withdrawn in one day. Prior to this run, Washington Mutual was the largest run, with $16.7 Billion over 10 days.
According to the markets, the problem is not localized. The below chart is a handful of larger regional banks in the S&P 500 as well as the SPYDR Regional Bank ETF (KRE). This type of drop off is not the sign of a healthy stock, and we are seeing them across the board.

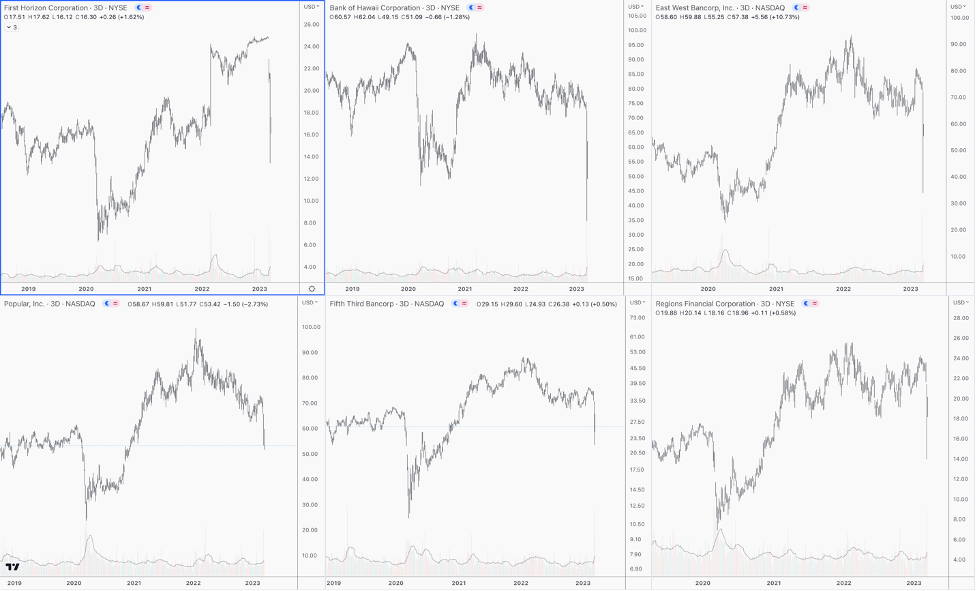
No one knows what will ultimately play out. We could see no further bank failures, accompanied with inflation continuing to trend towards the FED’s 2%. This would allow them the freedom to start a fresh liquidity cycle and rescue equities from any additional volatility. However, the above charts are quite telling and very unhealthy. They appear to be incomplete, and if they break below the recent panic low, expect the banking crisis to only intensify.
In conclusion, markets climb a wall of worry. This was the phrase that championed one of the greatest bull markets in US history from 2009-2022. After all, the market shrugged off Grexit, Brexit, the downgrading of US debt, two global slowdowns, China crash 1 and 2, as well as a global pandemic (!) Why would investors not believe it could shrug off a regional banking crisis as well as inflation?
However, the one common theme within the last bull market was that the FED was allowed to maintain an expansive liquidity cycle due to low inflation. Even in 2016, 2019 and 2020, the FED was able to start fresh liquidity cycles before the selloff lead to severe damage in the markets and economy. Today, the FED is aggressively draining liquidity from the system as a means to fight inflation, as shown in the below chart that compares liquidity in the system to the S&P 500

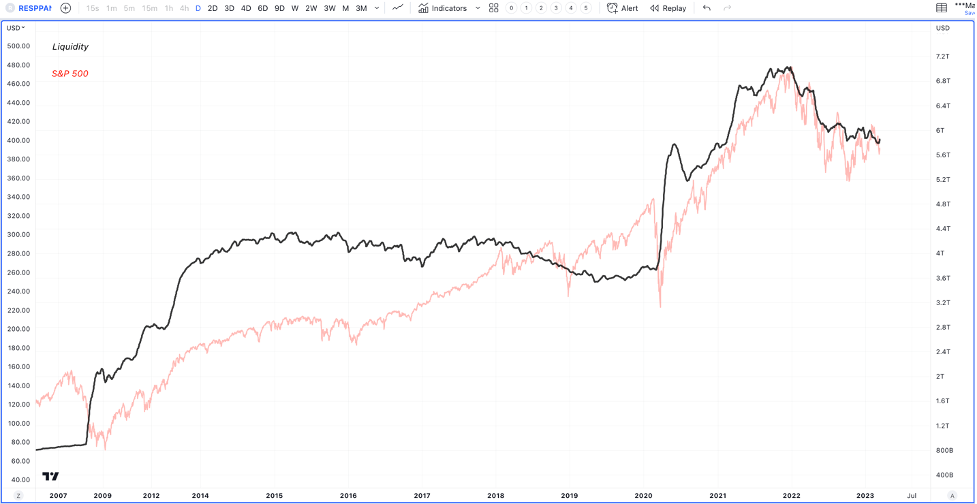
What’s troubling is that the aggressive actions taken by the FED are starting to affect the banking sector. However, these aggressive actions are simply not doing enough to quell inflation.
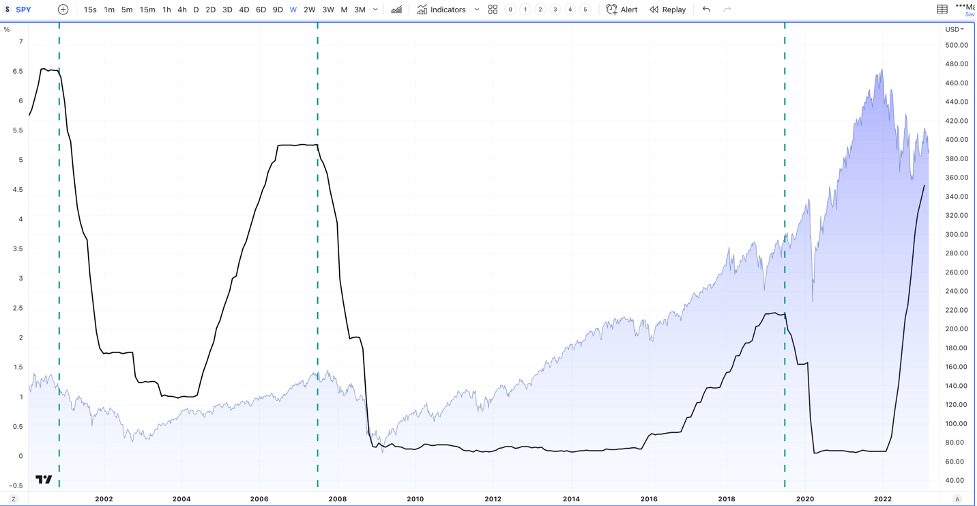
It could be argued that the FOMC will drop rates, start a new liquidity cycle and save the day. History suggests that this is not the case once the damage is done. It takes months for rate changes to filter into the economy, and once an aggressive hiking cycle breaks something, it tends to run its course in the equity markets before a bottom is found. The below chart compares the Fed Funds rate to the S&P 500. Note when the FED started lowering rates, which started a fresh liquidity cycle. Then look at how long it takes for equities to finally respond.
Maybe inflation will trend lower going forward, and maybe no more banks will have trouble; maybe, we are missing out on an opportunity to buy equities at lower prices just before a new bull market is about to start up. This is a very thin needle that must be threaded, and until we get evidence it is manifesting, we remain cautious.
Join us every Thursday, at 4:40 EST, when we host a webinar for our premium members. We go over various markets, outline what we are seeing and what we need to see in order to reverse our perspective. We also go through the charts of tech stocks and some cryptos that we are targeting to buy or trim. You can sign up here.
Note: For a Limited Time, I/O Fund is offering a $99/year Premium Newsletter plan that provides one actionable stock tip per month and analysis from a top performing, audited team. Click here for more details
The I/O Fund is a publishing company. The analysis, strategies, reports, activity and all other features of our service is provided for informational and educational purposes only, and should not be construed as personalized investment advice. Hedging is an advanced method of trading stocks, sudden losses can occur, and hedging should only be pursued under the supervision of your personal financial advisor.


More To Explore
Newsletter

Nvidia and Google Are Crowding TSMC’s N3 Node - Can Intel Fill the Gap?
Nvidia is moving its next-generation Rubin GPUs from 4nm to 3nm, yet Google’s latest TPUs are already on N3 and are expected to remain there. Meanwhile, a growing number of AI CPUs from Nvidia, Amazon

Intel vs TSMC: How CoWoS Packaging Constraints Could Create an Opportunity for Intel Foundry
Taiwan Semiconductor (TSMC) is the single, most important company to the AI industry. However, to compete with the incumbent, Intel does not need to beat TSMC at leading-edge manufacturing. It only ne

Big Tech’s Free Cash Flow is Turning Negative – Who's Next?
Big Tech’s AI revenue is accelerating, but free cash flow is moving sharply in the opposite direction. Across Google, Microsoft, Meta and Amazon, capex is rising much faster than operating cash flow a
Big Tech Earnings Preview: Is AI Monetization Finally Catching Up to Capex?
The most pronounced difference between 2026’s tech rally compared to rallies in the past is which companies have been left out of it. The names most associated with the AI trade have hardly participat
Nvidia, CXL, and the Battle to Improve AI Inference Economics
This is Part 2 of our two-part series on AI inference economics. In Part 1 — Why Nvidia's Next AI Battle Is About Tokens per Watt, we laid out why tokens per watt has become the defining metric for in
Why Nvidia’s Next AI Battle Is About Tokens per Watt
As hyperscalers move from building AI infrastructure to monetizing it, tokens per watt helps to reflect if revenue is scaling and if profitability is improving. Offload engines can increase tokens per

Micron Is Up 900%. Here’s Why the AI Memory Trade May Still Have Room to Run
Over the past 10 months, memory chip stocks have gone from being solid beneficiaries of the AI boom to capturing a massively outsized piece of the return pie. The inflection in Micron’s performance de

Why the S&P 500 Shrugged Off the Iran War — and What Could Finally Break the Rally
On February 28th, the U.S. went to war with Iran, and the market was handed the kind of shock it hasn't contended with for years. The conflict set off a chain reaction across the region: an ongoing su

Nvidia, CoreWeave, and Nebius: Inside the Circular Financing of the GPU Boom
Neoclouds are one of the more hotly debated AI business models, with CoreWeave and Nebius being the two most widely recognized names. These companies have seen their sales, backlog, and share prices s

AMD, Nvidia, Arm, Intel: Inside the $120 Billion CPU Gold Rush
CPUs have gone from an afterthought to becoming the AI trade’s next great bottleneck – and with AMD, Nvidia, Arm and Intel circling a market that is doubling nearly overnight, the only question left i
