July Market Update: Is Inflation Overblown?
July 23, 2021

Knox Ridley
Portfolio Manager

On February 16th, the dynamics of the market shifted as we saw the beginning of a large rotation away from the growth stocks that led us out of the 2020 bear market. Around the same time, the price of copper rose to levels that we haven’t seen since March of 2013, while the yield on the 10-year treasury moved above a key resistance level that has held since February of 2020. In other words, inflation was officially here.

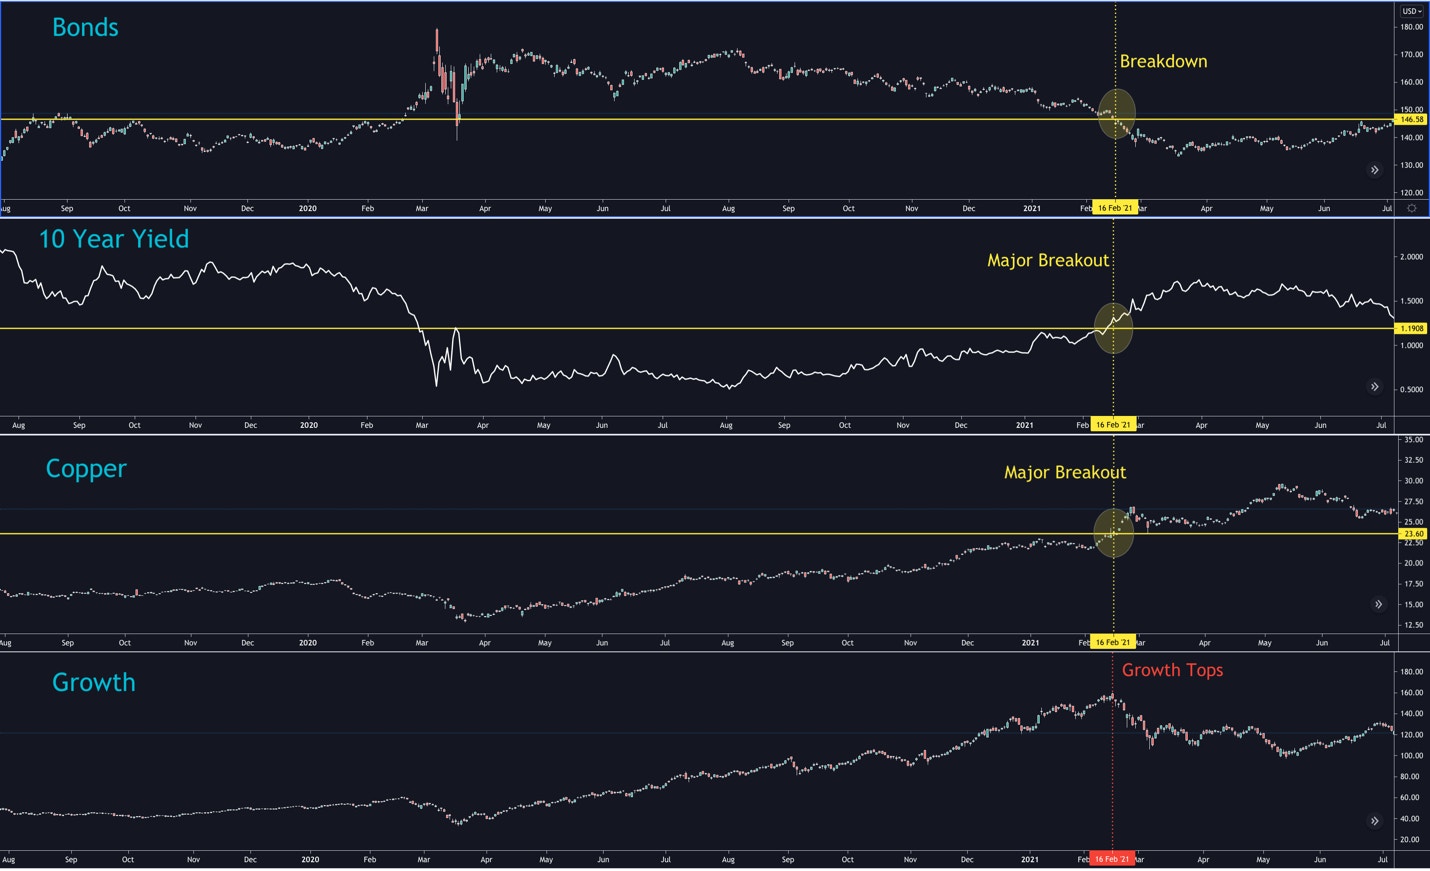
Pictured Above: Copper and Yields broke out on the same day that growth equities topped
Historically, inflation pressures build towards the end of a cycle, resulting in the bond market selling off. The reason for this is because as the FED raises rates to fight inflation, bonds get priced down. Bonds don’t perform well in a rising rate environment; hence a downtrend in bonds usually begins in anticipation of a rate hike. As bonds get sold, rates go up, making the cost for companies to refinance debts more difficult while at the same time harming future projected cash flows for high growth companies. Eventually, stocks catch up to bonds and a bear market begins.
Ultimately, inflation begins the cascade of reactions that leads to a recession, hence the steep selloff in richly valued growth stocks. The real question today is whether the inflation is transitory, as the FED and many economists are claiming, or is it here to stay? If it is truly here to stay, the FED will have no choice but to raise rates, cutting off the bull market. On the other hand, if inflation is transitory, then the recent drawdown in high growth names may have presented a buying opportunity if the bull market resumes.
The popular narrative tends to side with “inflation is here” and “the FED will have no choice but to raise rates soon.” This is backed not only with countless anecdotal claims, but real data. For example, June’s CPI came in at 5.4% YoY which exceeded expectations. This has caused analysts and pundits to point out that the last time we saw a rise this high was in 2007. Just as alarming, housing prices are now exceeding 2007 levels.

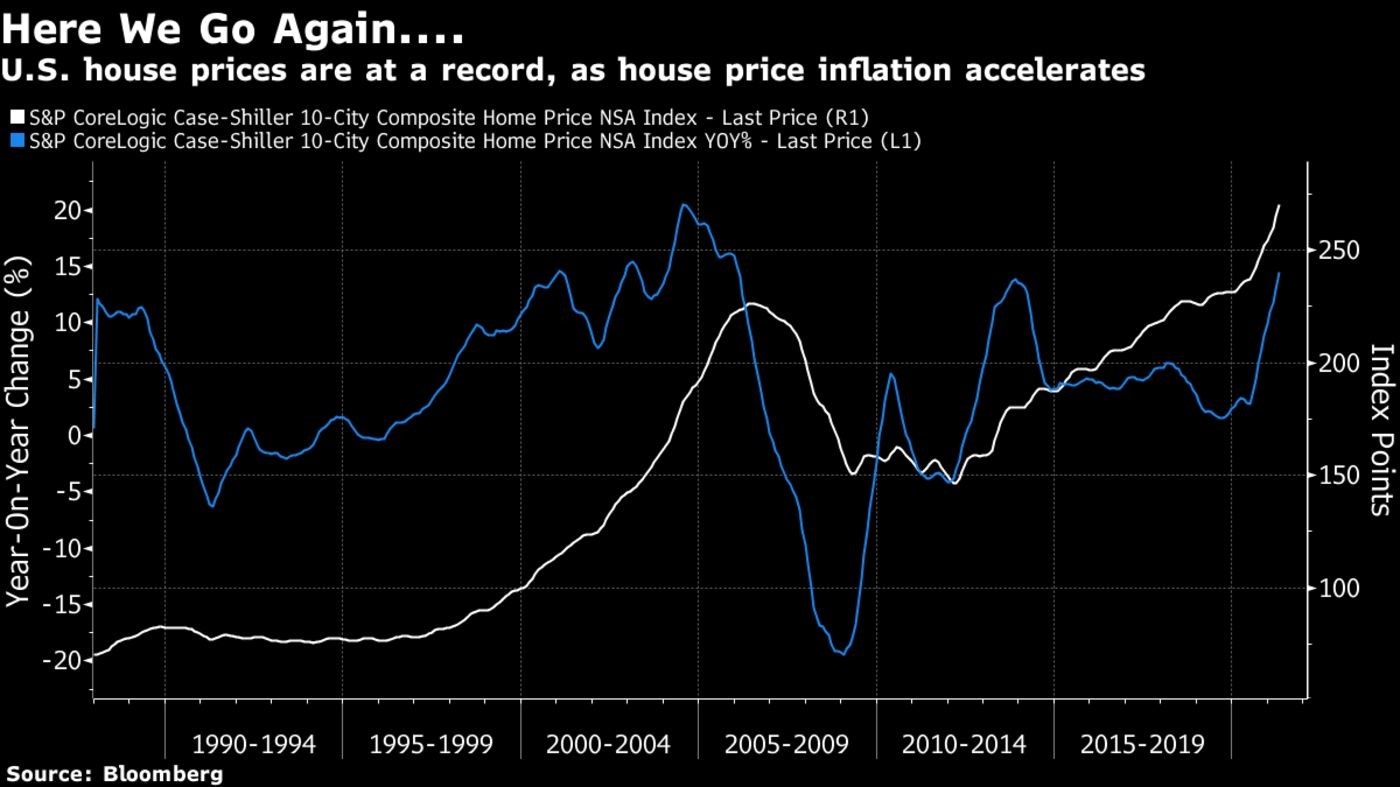
Source: Bloomberg
This is compelling evidence to support the popular narrative that inflation is here, and likely signals the end of the bull market. However, I believe the markets are a much greater predictor of future economic outcomes. If we monitor the price relations with intermarket analysis (see below), the market is telling us that inflation fears are likely overblown. Even if the trend in inflation continues, we could still see an environment like 1999 where inflation, yields, commodities and equities all advance together.
Intermarket Analysis
On May 12th, the equity markets appear to have hit a significant bottom. Following this low, what we have seen is a quiet rotation out of commodities and value stocks, and back into risk-on assets. Across key sectors, high growth and green tech is up 20% while big tech and cloud is up 15%. Meanwhile, value is up just over 1% while commodities are in negative territory.

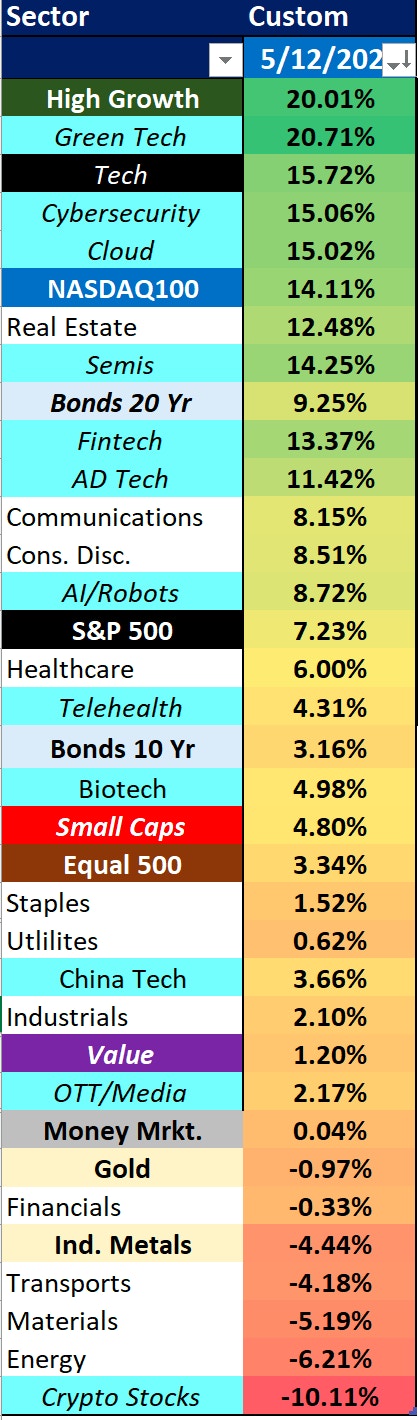
Since the May 12th bottom, we have seen beaten down growth stocks take back their leadership role in the market – this is a thesis that we held, positioned for and stated publicly. The I/O Fund has initiated numerous buys since the May 12th bottom, after building a reasonable cash position going into the selloff in February.
Joining growth in a renewed leadership role is bonds. We are seeing bonds in a new uptrend, specifically longer duration treasury (+20 years), which are outperforming the S&P 500 since the May 12th bottom.
If we look a little deeper, copper topped on May 12th, the same day that growth stocks bottomed. Also, on May 12th bonds were confirming their first higher low, which was starting a new uptrend. In short, the bond market was signaling that inflation fears were either overblown, or that they may not be significant enough to force rate hikes.


Pictured Above: The intermarket relationship between copper, bonds and growth stocks from the May 12th bottom
Further evidence that inflation fears may be overblown are found in the recent behavior in lumber. The price of lumber has been the rally cry for investors concerned about inflation. Historically, not a speculative commodity, lumber saw a roughly 180% increase YTD before peaking on May 10th. Since the peak, prices have collapsed by roughly 65%.

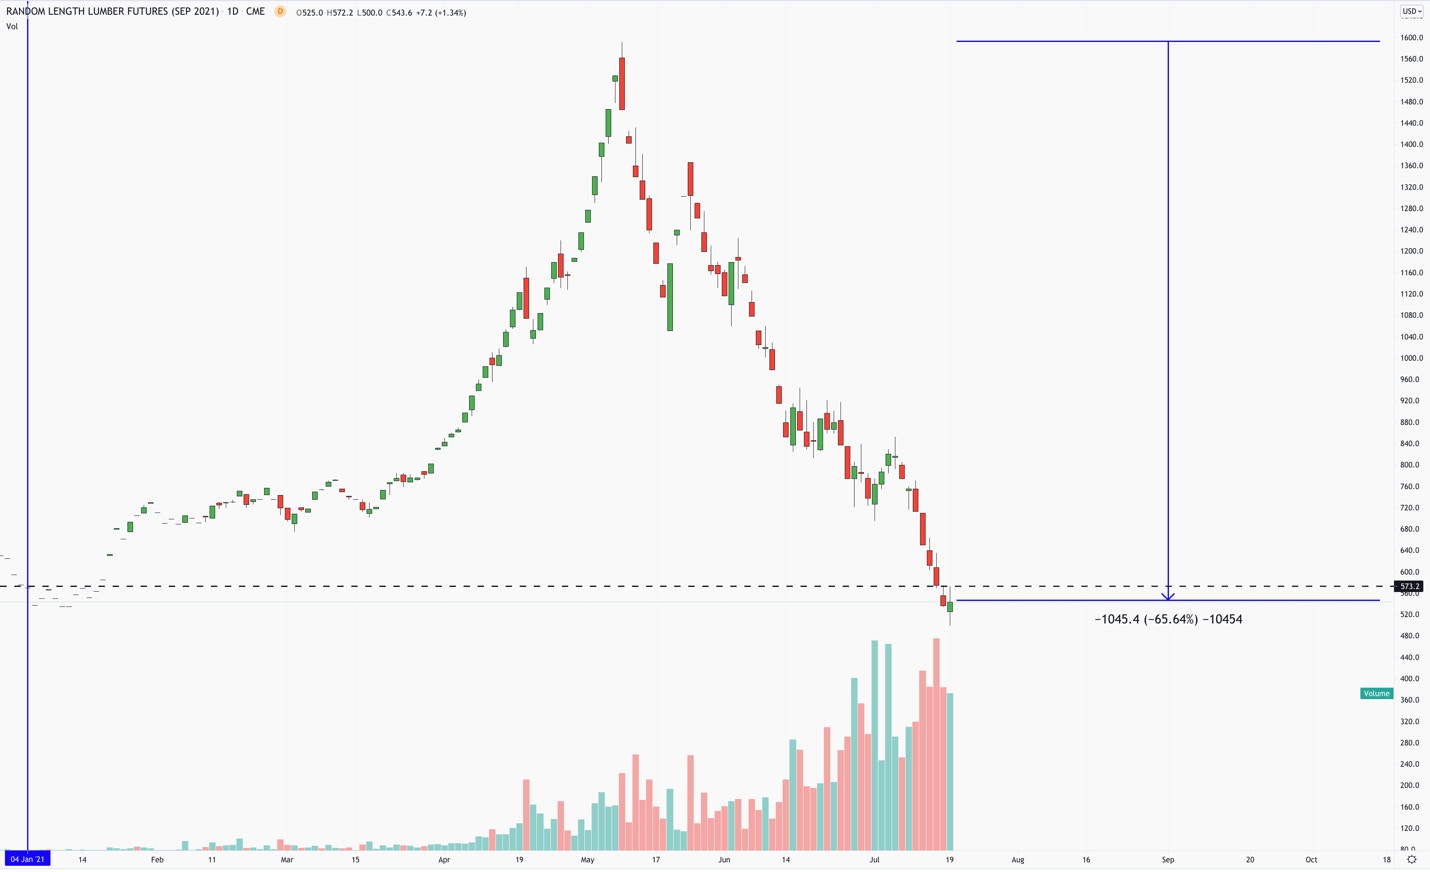
This puts the growth in lumber prices at negative for the year, which is rare for a commodity because it’s not speculative. This is further backed by the price of copper. After a roughly 35% rise in prices, from its May 10th peak, the price of copper has decreased by 10%.
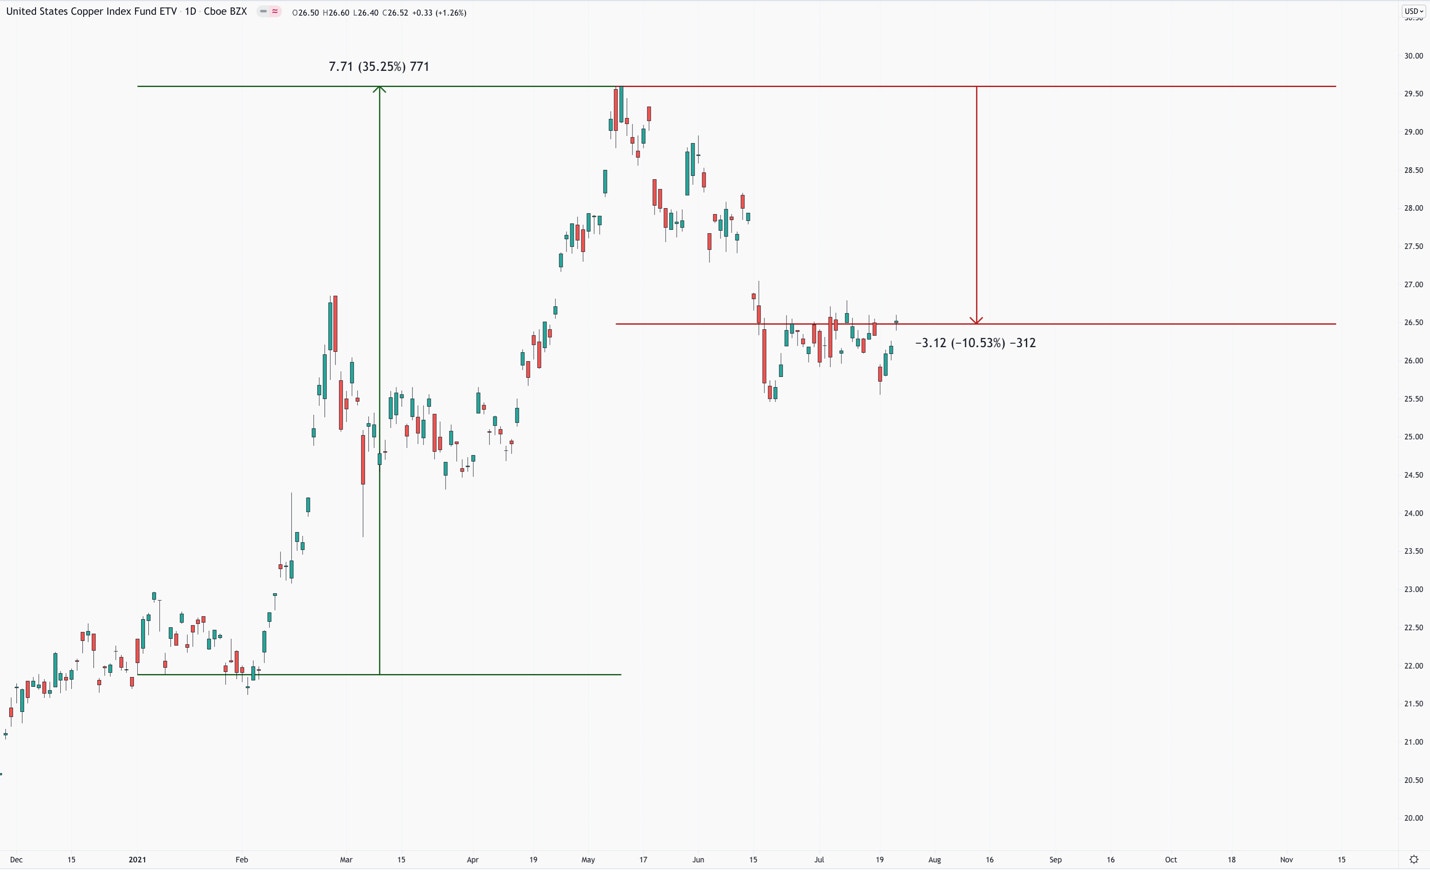
The collapse in economically-sensitive commodities is also not typically what you’d expect in an inflationary environment. Also, it’s worth pointing out that the 10-year yield is testing the very breakout zone that triggered the growth sell-off.
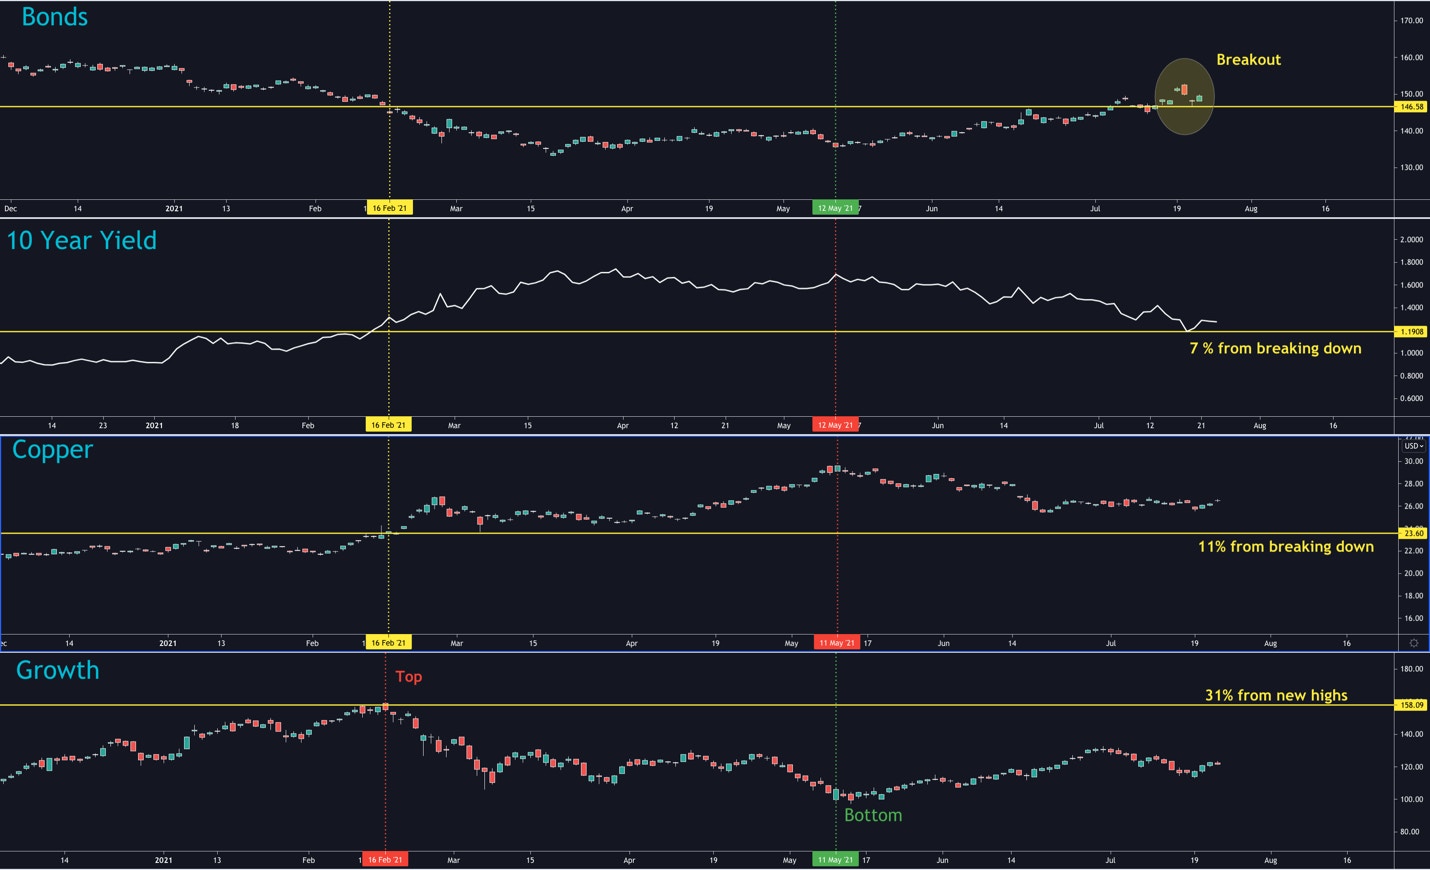
Pictured Above: bonds, copper and the 10 year yield are almost back where they were before the February 16th rotation began.
As of now, Bonds have broken out above the February 16th resistance with the 10 year yield only 7% away from reclaiming the February 16th region and copper 11% away. If yields and copper follow bonds, and reset the dynamics that lead to the growth rotation, it would suggest that growth stocks could continue their uptrend. As of now, high growth stocks are about 31% below their high.
Correlations and History
I’d also like to suggest that even if the 10-year yield and copper does hold the February 16th breakout zone, and continues to move up, it doesn’t necessarily mean that growth will continue its downtrend. In today’s market, it is now believed that growth stocks simply cannot go up with yields and commodities with inflation on the rise. However, if we look through history, this is simply not the case.

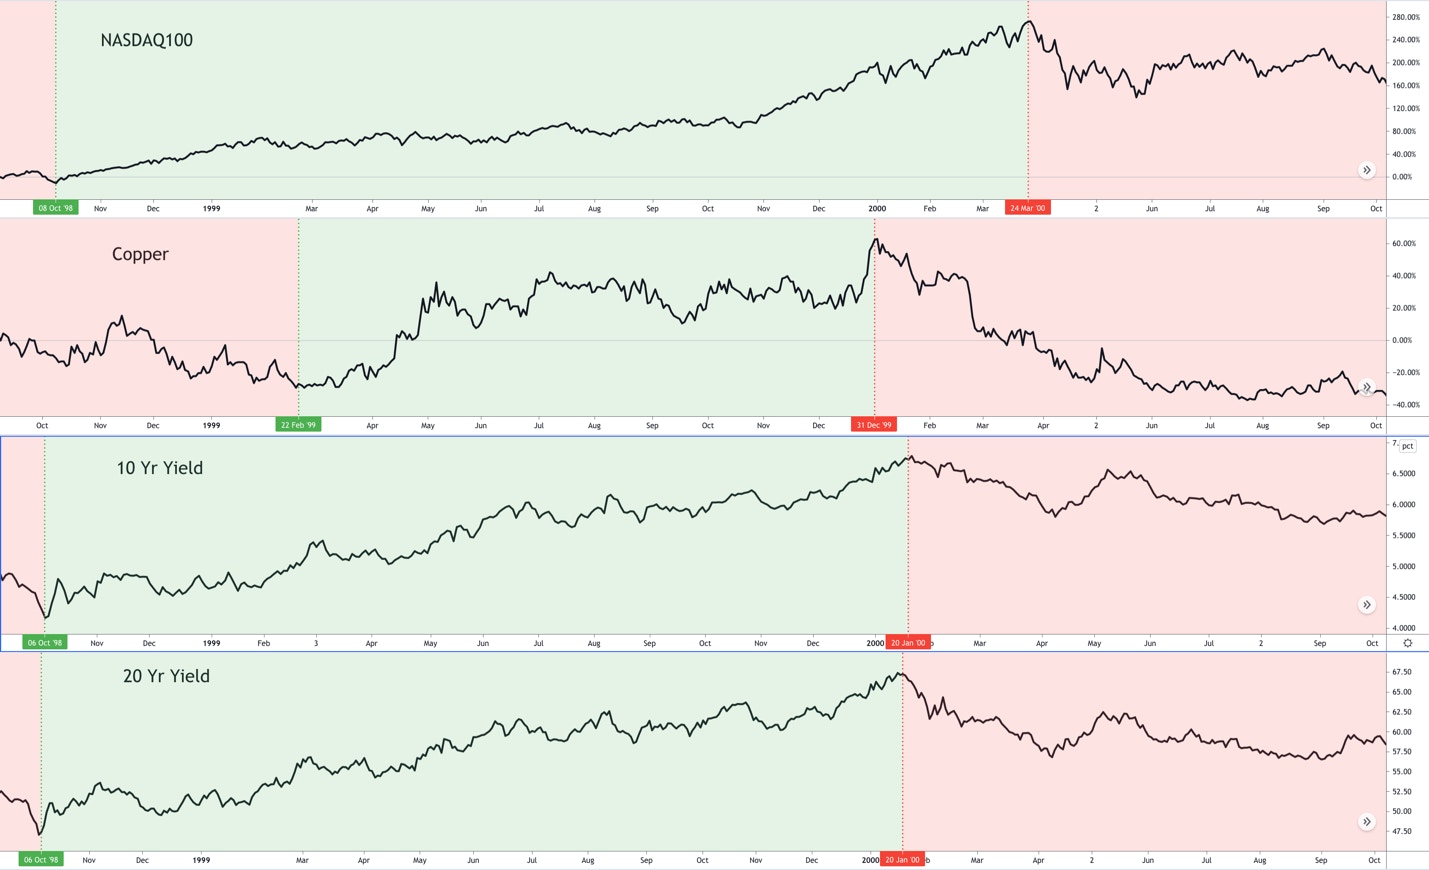
The chart above compares the NASDAQ100 with copper and the yield on the 10 and 20-year government bonds between 1998 through 2000. Red indicates a downtrend and green indicates an uptrend. Note how all four assets participated in an uptrend in unison from February 1999 – December 1999. These assets remained correlated, and this was during a rising rate environment with elevated inflation.
It’s also worth noting that in 1999 copper topped first, then yields, followed by equities. The drop in copper and yields would be considered a boon to equities today, but this was actually a warning in 1999/early 2000. When assets correlate, it’s good to take notice as history tends to rhyme.
Levels to Watch for the NASDAQ100 and S&P500
In our last market report, we identified the 14080 region as a likely breakout zone for the NASDAQ100.
On June 22nd, the breakout was confirmed and we have seen a move up roughly 5%. We’ve also publicly identified that we believe the NASDAQ100 is targeting the 16000 before we’d potentially see a deeper correction.
With the breakdown in the S&P500 on Monday, July 19th, this threatened to end this target earlier than expected. The recovery since has halted the early correction in the broader markets, and setup some clear levels for us to monitor.
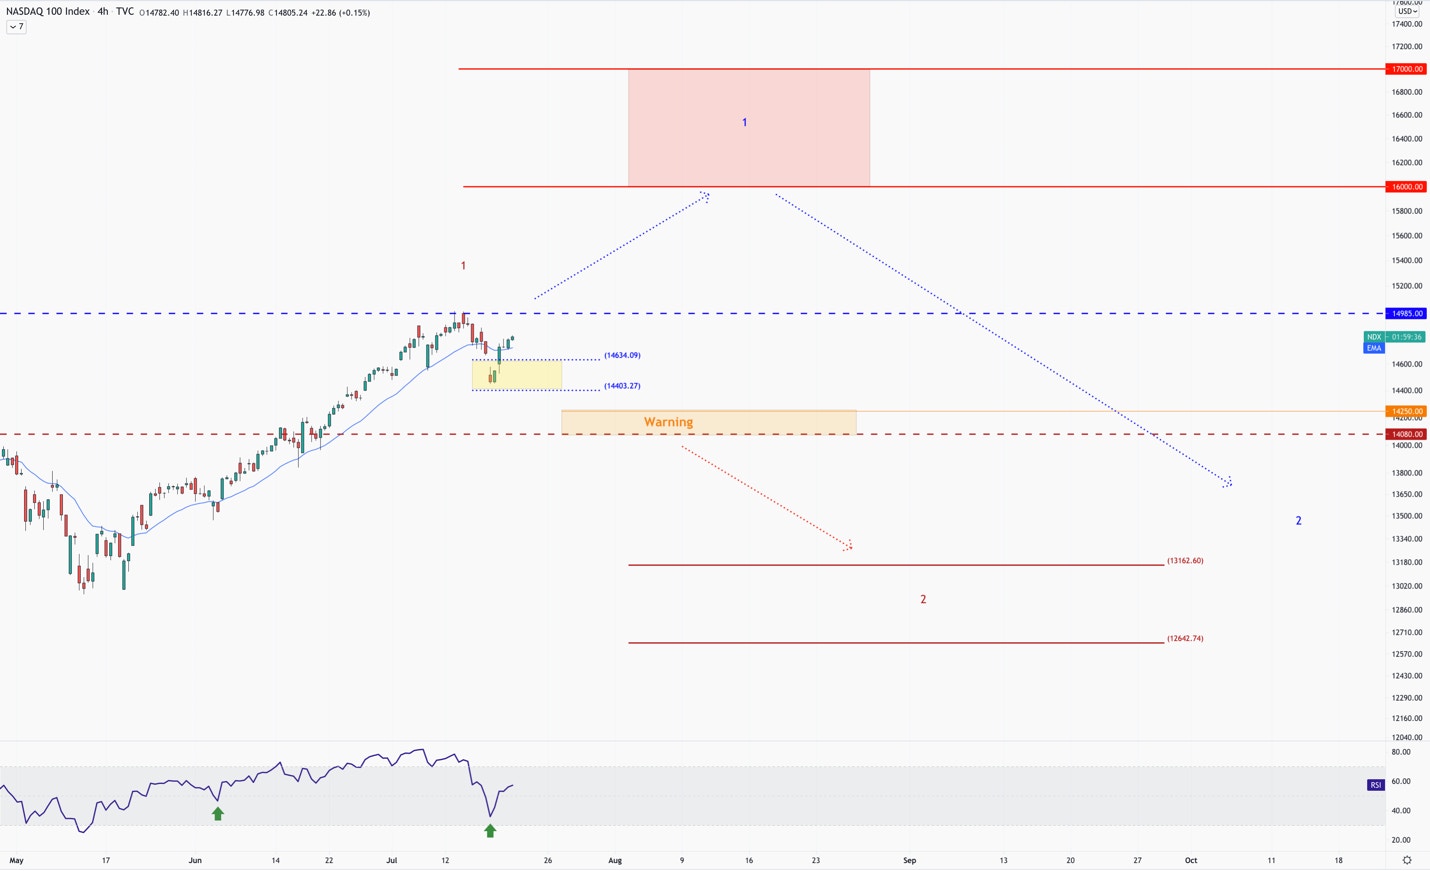
The above chart outlines the levels that we are watching. These are the potential outcomes I see playing out:
- Even with the strong bounce off the recent lows, we are not out of the woods yet. Until we can reclaim all-time highs, the current bounce could be a corrective bounce in a deeper correction. If we do see another leg lower, I’m expecting the 14200 level to hold, setting up a short correction in a much larger uptrend.
- If the bounce continues and we can move past the 14985-14900 region, we can resume our move to the 16000 region before a larger correction unfolds.
- The lowest probability scenario is that the current correction breaks down below 14080. If this support breaks, it will signal that we are in the larger correction earlier than expected.
We believe that any correction is part of a much larger uptrend. We expect much higher prices before the secular bull market that started in March of 2009 end, and that the current selloff in growth has provided a remarkable opportunity to buy some of most innovative, and fastest growing companies at a relative bargain.
Regardless of what scenario, or variation of a scenario plays out, the above information provides context so that emotions do not dictate our investments.


More To Explore
Newsletter

Nvidia, CXL, and the Battle to Improve AI Inference Economics
This is Part 2 of our two-part series on AI inference economics. In Part 1 — Why Nvidia's Next AI Battle Is About Tokens per Watt, we laid out why tokens per watt has become the defining metric for in

Why Nvidia’s Next AI Battle Is About Tokens per Watt
As hyperscalers move from building AI infrastructure to monetizing it, tokens per watt helps to reflect if revenue is scaling and if profitability is improving. Offload engines can increase tokens per

Micron Is Up 900%. Here’s Why the AI Memory Trade May Still Have Room to Run
Over the past 10 months, memory chip stocks have gone from being solid beneficiaries of the AI boom to capturing a massively outsized piece of the return pie. The inflection in Micron’s performance de
Why the S&P 500 Shrugged Off the Iran War — and What Could Finally Break the Rally
On February 28th, the U.S. went to war with Iran, and the market was handed the kind of shock it hasn't contended with for years. The conflict set off a chain reaction across the region: an ongoing su
Nvidia, CoreWeave, and Nebius: Inside the Circular Financing of the GPU Boom
Neoclouds are one of the more hotly debated AI business models, with CoreWeave and Nebius being the two most widely recognized names. These companies have seen their sales, backlog, and share prices s
AMD, Nvidia, Arm, Intel: Inside the $120 Billion CPU Gold Rush
CPUs have gone from an afterthought to becoming the AI trade’s next great bottleneck – and with AMD, Nvidia, Arm and Intel circling a market that is doubling nearly overnight, the only question left i

Google TPU v8 vs Nvidia: How Inference Is Rewriting the AI Market
In April, Google announced it would begin selling its TPUs to select third-party data center operators, which is something the market has anticipated for nearly a decade. The TPU-versus-Nvidia-GPU deb

The AI Networking Stock That Beat Nvidia by 7X YTD for Returns of 135% YTD
AI networking stock Lumentum is among the key I/O Fund winners in 2026. We allocated heavily to LITE in January—a month before Nvidia backed the company. While most investors couldn’t stomach taking a

Bloom Energy — Our 2026 Top Pick Was the Best Performing Stock in April
April was the best month in six years for the Nasdaq-100. The single best-performing large-cap stock wasn't Nvidia, Microsoft, or Meta. It was Bloom Energy, up roughly 109% in one month. As you'll rec

Inside Nvidia’s $4B Optical Strategy—and Why CPO Changes Everything
Within the AI investment theme, there is nowhere that the supply chain shifts faster than in networking, leading companies to gain content on new platforms or lose incremental share. The reason is str
