Levels to Watch for SPX: The Market Got Too Bearish Too Soon
March 18, 2022

Knox Ridley
Portfolio Manager

We are in a market where the macro environment is front and center.
The S&P500 is comfortably below its 50-day and 200-day moving average (MA), growth has reversed much of the gains from 2020 and energy is the only sector positive for the year. Inflation is at 40-year highs, oil went from $90- $129 in less than a month, as the FOMC arguably waited too long into this cycle to begin raising rates.
The FOMC is now boxed and must either abandon inflation concerns or growth concerns. Consumer sentiment is trending into recessionary levels, which means if the FED doesn’t address inflation, the consumer will do this for them. As if that’s not enough, the current war is potentially leading to a global sanction war that would all but guarantee a global recession.
Regardless, I still think the odds are higher that we see +5000 SPX before we see 3500 SPX, and the reason for this is due to the single most powerful force in equity markets – sentiment.
I know many will claim this time really is different, but many forget that similar excessive bearishness was present during Brexit, Grexit, the near collapse of the Euro zone, downgrading US debt, China collapses 1 and 2, double dip recession fears in 2012, as well as the 2016 global slowdown and political shift that brought about cries of a 50% drawdown. In fact, it really was different in 2009 as well as 2020, yet the market marched higher and never looked back, regardless of the data and extreme bearishness.
For the first time since 2020, we have sentiment depressed enough to propel us higher, and it is only from such states of despair that deep corrections find bottoms and begin to march higher. If you have ever said to yourself, “this market makes zero sense,” then you indirectly understand that fundamentals do not always drive market moves. I believe the time will come soon, that many will be saying the same phrase as we begin to march higher in light of the ongoing negative news cycle.
Bear Market or Correction?
The debate is whether this is a correction or the start of a secular bear market. If this is the start of a secular bear market, it will be the first one in history that the equity market sees before the bond market. Yes, the yield curve is flattening, but it has not indicated that the FED has made a catastrophic mistake that would all but insure a recession. The equity market has historically and consistently been the final market to wake up to the macro picture, with the bond market usually being the first.

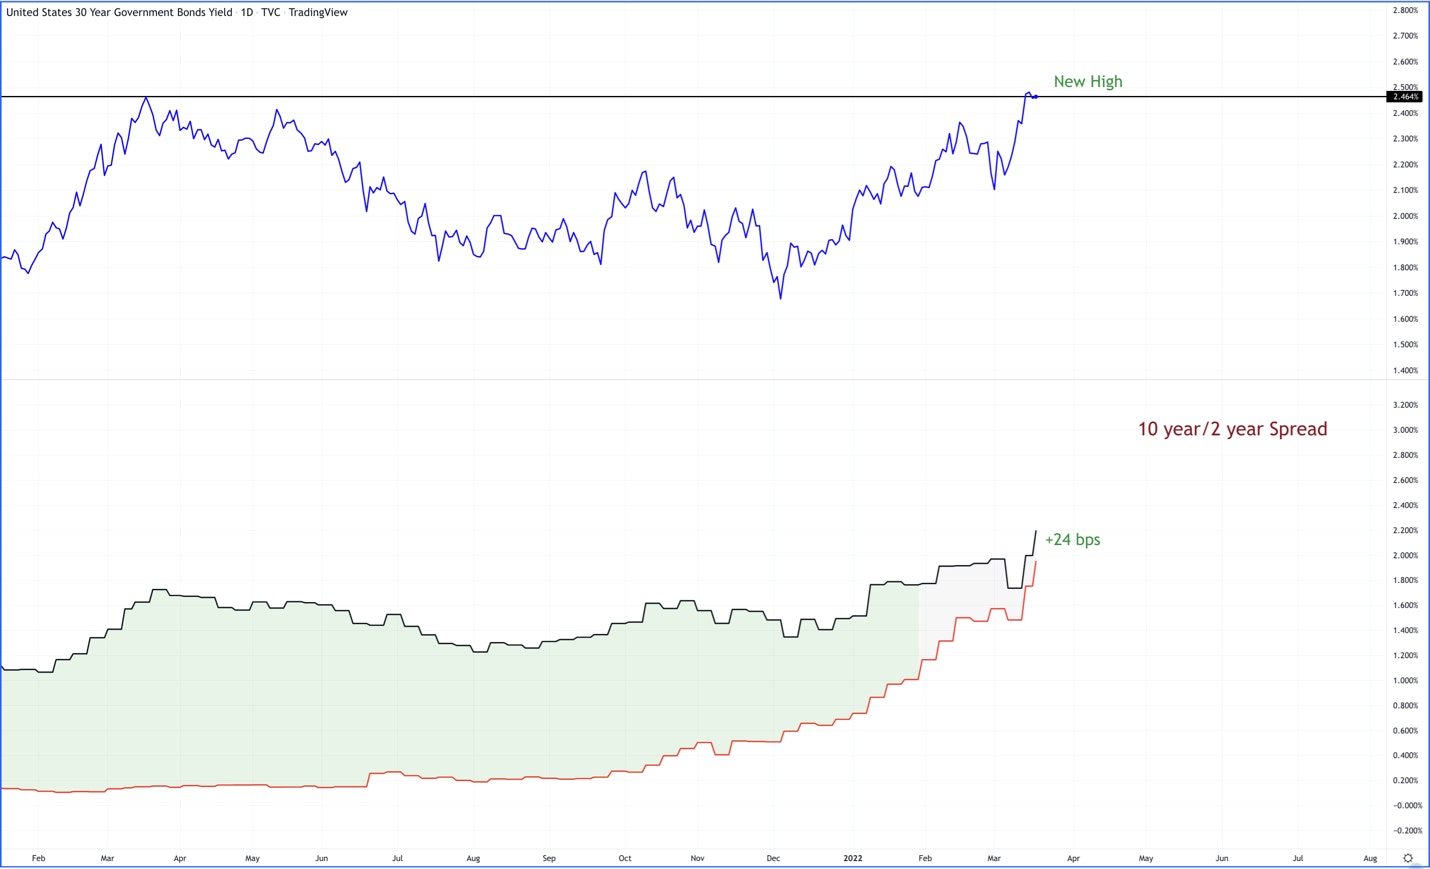
As of today, the 30-year yield is making a new high. Unlike the short end of the curve, the longer out you go, the more rates are controlled by growth/inflation. The 30-year has been in a prolonged downtrend, until recently, suggesting that inflation AND growth do not warrant a coming recession, yet.
The spread between the 10/2 year is the flattest we’ve seen since October of 2018. This is not ideal, and this trend is moving towards an inversion. However, we have not inverted, yet.
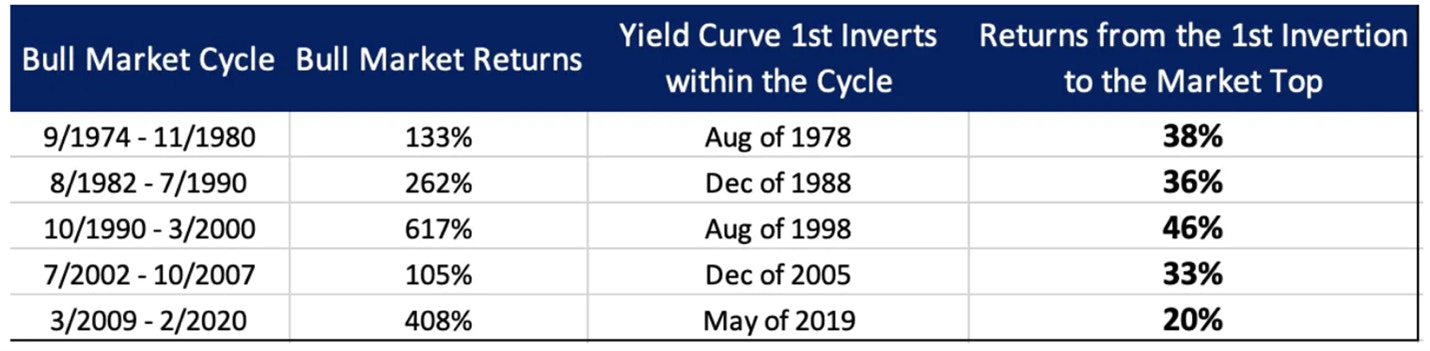
What history has shown us is that once the yield curve inverts, the economy falls into recession, on average, between 9-24 months from the first inversion. Also, surprisingly, some of the best gains within a bull market happen in that final +1 year period after inversion.

Also, this would be the first bear market that triggers while the economy is still expanding, and earnings are surprising to the upside. In fact, over 75% of the stocks in the S&P 500 provided upward surprises, as many talked about raising their prices and increasing production to meet the demand in the global economy.
Sign up for I/O Fund's free newsletter with gains of up to 403% - Click here
Though the Rate of Change is starting to slow in the high frequency economic data, we are still expanding. We appeared to have reached peak growth in mid 2021, as the Rate of Change (RoC) continues to move towards a contraction.

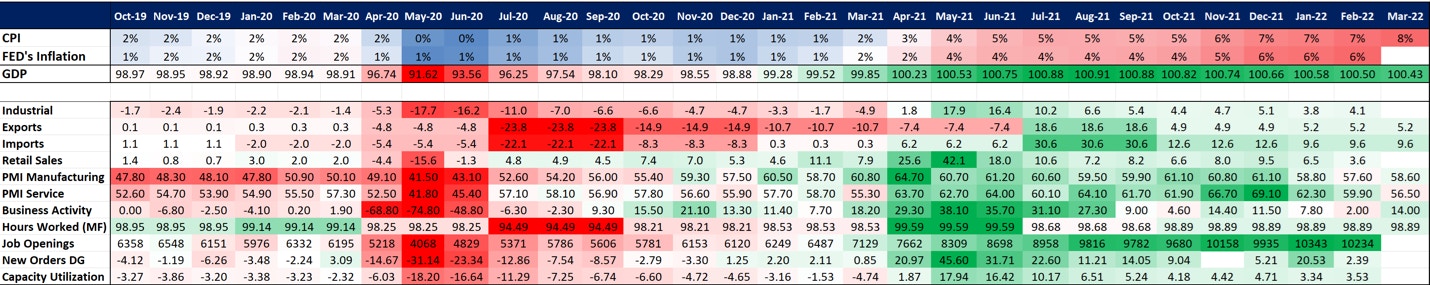
However, the above chart is measuring Rate of Change, and though we are seeing the RoC decelerate, we are still expanding. In fact, the last two rounds of global PMI data showed numerous surprises to the upside in both manufacturing and services, and not just in the US. Historically, this is not the environment that we see large, prolonged drawdowns.
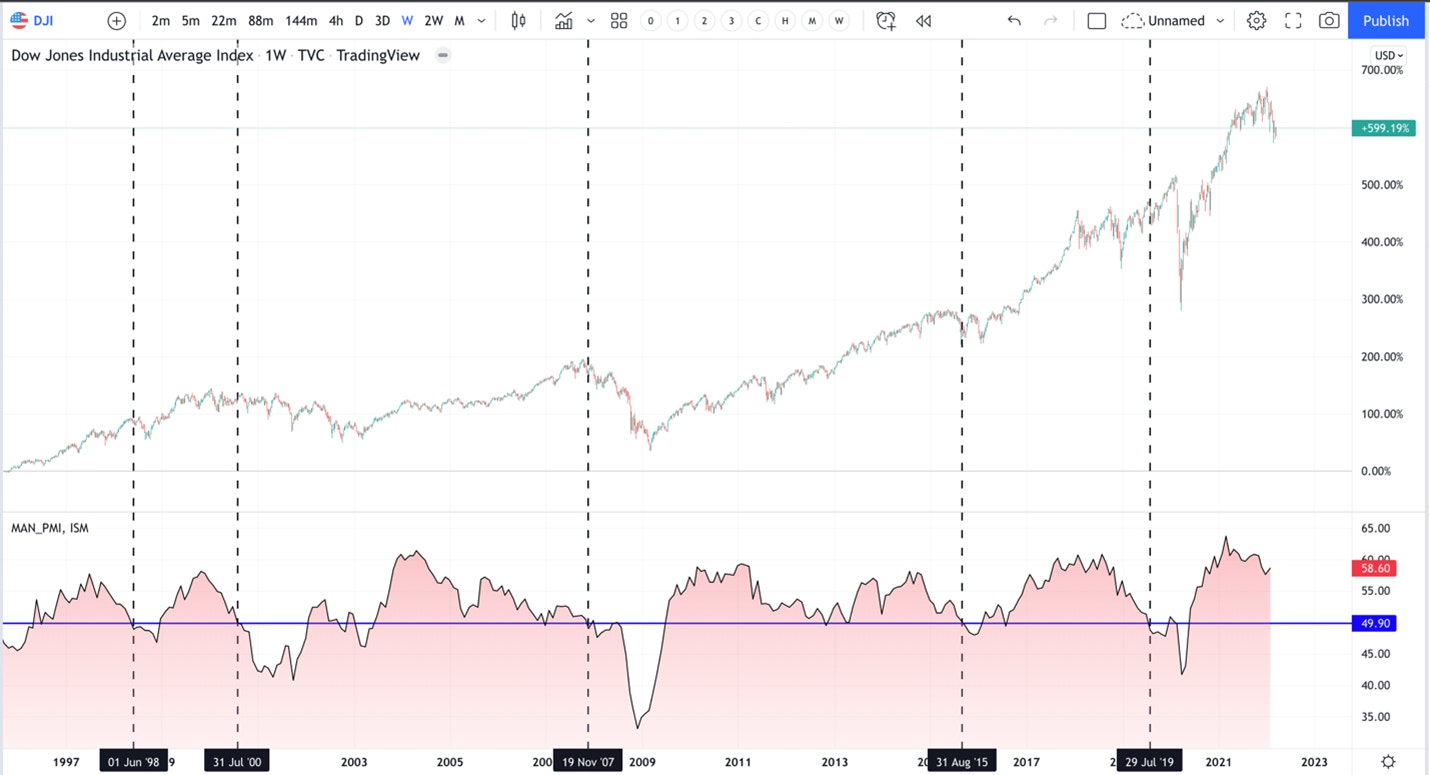
If we look at the US PMI data, anything above 50 is signifying an expansion, while below 50 signals a contraction. It’s not until we get that sub-50 reading that we see the equity markets at their most volatile. Note in the below chart how the PMI moving sub-50 tends to coincide with either the largest leg of a drawdown, or close to the start of a large drawdown. As of today, the PMI reading is at 58.

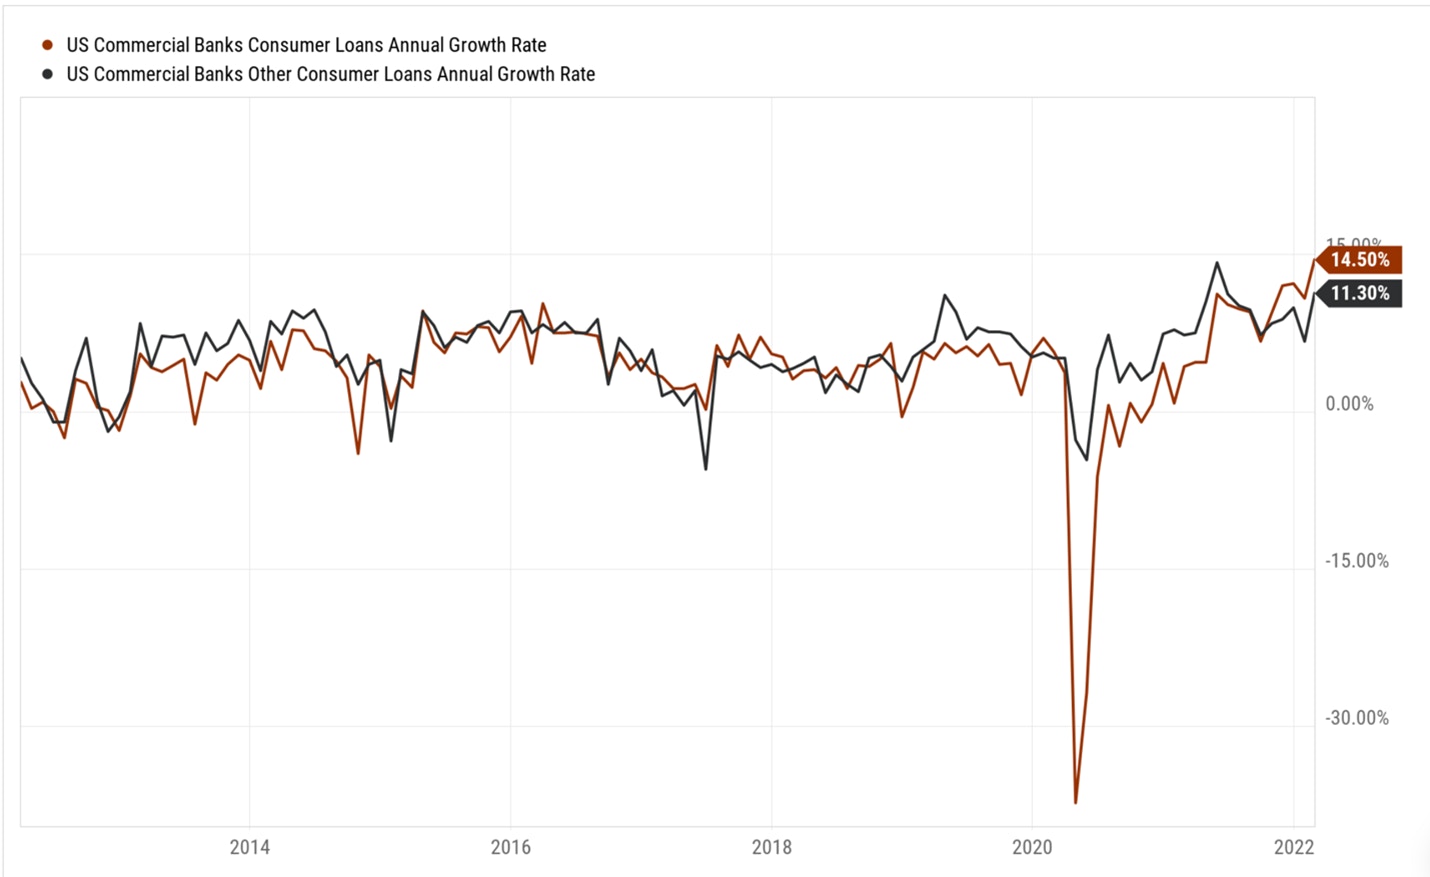
Furthermore, we are seeing Business Development Companies (BDCs) reporting strong demand, as many have raised their dividends and increased guidance for 2022. It’s important to monitor the sources of borrowing for small to medium sized businesses, which BDC’s service. This is further backed by the upward trending loan growth in commercial banks in the US.

I am not arguing that the current economy is ripe for growth. In fact, it’s important to understand where we are in the business cycle as well as earnings cycle. What I am saying is that sentiment in the markets have gotten too bearish, too quickly. This, more times than not, leads to an unwind which I believe could take SPX +5000 before we see 3500.
Next week, I will discuss statistics around bear markets and what has historically preceded a bear market and what has historically led to new highs. You might be surprised.
The I/O Fund is a team of analysts who share their research publicly as they build a portfolio of 20 stocks. Our team has record results for a retail Fund and we also have four-digit gains on some of our free newsletter coverage. You can learn more about our premium service by clicking here or sign up for our free newsletter here.
Disclaimer: This is not financial advice. Please consult with your financial advisor in regards to any stocks you buy.


More To Explore
Newsletter

Big Tech’s Free Cash Flow is Turning Negative – Who's Next?
Big Tech’s AI revenue is accelerating, but free cash flow is moving sharply in the opposite direction. Across Google, Microsoft, Meta and Amazon, capex is rising much faster than operating cash flow a

Big Tech Earnings Preview: Is AI Monetization Finally Catching Up to Capex?
The most pronounced difference between 2026’s tech rally compared to rallies in the past is which companies have been left out of it. The names most associated with the AI trade have hardly participat

Nvidia, CXL, and the Battle to Improve AI Inference Economics
This is Part 2 of our two-part series on AI inference economics. In Part 1 — Why Nvidia's Next AI Battle Is About Tokens per Watt, we laid out why tokens per watt has become the defining metric for in
Why Nvidia’s Next AI Battle Is About Tokens per Watt
As hyperscalers move from building AI infrastructure to monetizing it, tokens per watt helps to reflect if revenue is scaling and if profitability is improving. Offload engines can increase tokens per
Micron Is Up 900%. Here’s Why the AI Memory Trade May Still Have Room to Run
Over the past 10 months, memory chip stocks have gone from being solid beneficiaries of the AI boom to capturing a massively outsized piece of the return pie. The inflection in Micron’s performance de
Why the S&P 500 Shrugged Off the Iran War — and What Could Finally Break the Rally
On February 28th, the U.S. went to war with Iran, and the market was handed the kind of shock it hasn't contended with for years. The conflict set off a chain reaction across the region: an ongoing su

Nvidia, CoreWeave, and Nebius: Inside the Circular Financing of the GPU Boom
Neoclouds are one of the more hotly debated AI business models, with CoreWeave and Nebius being the two most widely recognized names. These companies have seen their sales, backlog, and share prices s

AMD, Nvidia, Arm, Intel: Inside the $120 Billion CPU Gold Rush
CPUs have gone from an afterthought to becoming the AI trade’s next great bottleneck – and with AMD, Nvidia, Arm and Intel circling a market that is doubling nearly overnight, the only question left i

Google TPU v8 vs Nvidia: How Inference Is Rewriting the AI Market
In April, Google announced it would begin selling its TPUs to select third-party data center operators, which is something the market has anticipated for nearly a decade. The TPU-versus-Nvidia-GPU deb

The AI Networking Stock That Beat Nvidia by 7X YTD for Returns of 135% YTD
AI networking stock Lumentum is among the key I/O Fund winners in 2026. We allocated heavily to LITE in January—a month before Nvidia backed the company. While most investors couldn’t stomach taking a
