The importance of the NASDAQ100, and Levels to Watch
March 25, 2021

Knox Ridley
Portfolio Manager

Long term technical signals suggest the current selloff is a buying opportunity
Coming out of the 2008 Financial Crisis, we saw a shift from value to growth for the first time since the 90s. Growth stocks took the lead and have been the general theme of the current secular bull market that we are in. With a multitude of tech focused microtrends like the internet, mobile, social media, e-commerce, now cloud and soon to be 5G and AI, the tech sector has led growth stocks.
From a broad market perspective, the NASDAQ100 (NDX), and index of predominantly large cap stocks, has been the most important index to track within the current cycle. It has led the broad market into and out of almost every major correction since this bull market began.
This pattern has even continued since the quick bear market in March of 2020. From peak to trough, while the S&P 500 saw a 35.40% drawdown, the richly valued NDX only saw a 30.50% drawdown. Since the March 23rd low, we have seen a consistent trend where the NASDAQ100 has led us into each correction and also bottomed before the S&P 500.
However, since the recent correction began on February 16th, we have seen a meaningful shift from growth to value. Where the DOW is at new highs, the S&P 500 and DOW Transports are down less than 2%, while the NASDAQ100 is still about 7% away from new highs.
This is a meaningful rotation, which we see as healthy. The microtrends in tech are not over or at the end of their cycle, regardless of stock prices. Also, we want to see as many sectors and stocks participating in this bull market, which is happening.
Considering the importance of tech’s leadership, as well as the overall weight of tech within the S&P 500, which currently sits at about 24%, without the NASDAQ 100 participating in new highs, I would consider any bottom to be suspect. For this reason, we believe tracking the NASDAQ100 to be crucial right now in order to glean broad market cues.
I/O Fund has been preparing for a correction since late February. We built up a nice cash position, which we were vocal about with our readers as well as on Twitter (here here here). We also added a series of hedges prior to the selloff, and have recently added them back due to the possibility of a lower low. As of now, the long-term technical signals, and trend is still up. This suggests the current selloff is a buying opportunity, which we have been taking advantage of.
NDX: Levels to Watch

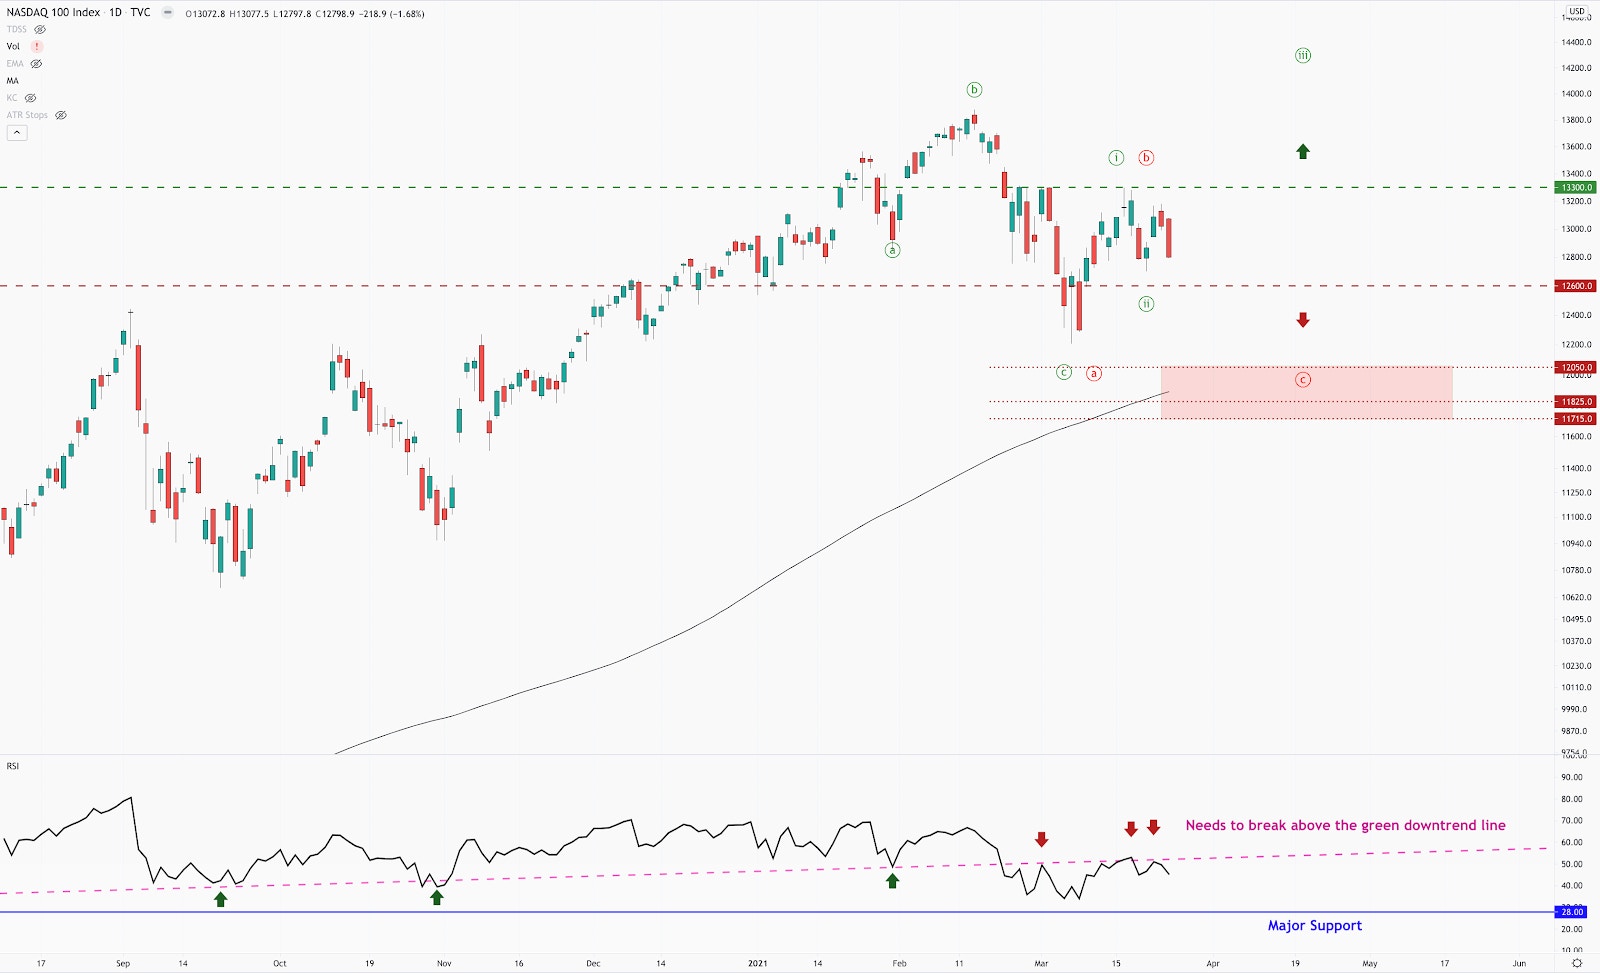
From a technical perspective, there are two scenarios we are tracking:
- The correction is over. For the green count in the chart above, we finished the final leg in the March 5th correction. If NDX holds 12,600 and we see a breakout above 13,300, the low is likely in for this correction. To confirm this scenario, we need NDX to breakout above 13,300, at which point our small hedge will come off.
- NDX makes a new low. If NDX breaks 12,600, that would put us in the red count. This count has us in the final leg of the correction, with a potential bottom at 11,715 to 12,050.
Regardless of what path NDX takes, we view this pullback as a buying opportunity and when the correction is complete we expect the uptrend to resume. We have been building key positions as we feel you can’t time the market and you most certainly can’t time a bottom.
There are many tools we use to guide our entries as well as risk management. One is the RSI, which I believe will be a key technical indicator to focus on based on the pattern in the daily chart. The trendline that was acting as support has become strong resistance. NDX needs to break back above the trendline before we can call this correction over. Furthermore, NDX has major support at the blue line. This was the final capitulation point for the March 2020 lows. If NDX reaches that level, we will take it as a strong buy signal.
Disclaimer: Beth Kindig and the I/O Fund currently owns shares of TSLA. The content in this article is intended to be used for informational purposes only. The author has not received any compensation from any third party or company discussed in this article. The content is the expressed opinions of the author and is intended for educational and research purposes. Any thesis presented is not a guarantee of any particular stock’s future prices, so please factor this risk into your own analysis. It is very important that you do your own analysis before making any investments based on your personal circumstances. The author is not a licensed professional advisor. Please seek counsel form a licensed professional before acting on any analysis expressed in this article, to see if it is appropriate for your personal situation.


More To Explore
Newsletter

AI Token Demand is Shattering Forecasts
Total annual token processing is no longer measured in billions or trillions of tokens, but in the quadrillions and beyond. As annual token processing is now tracked in units with 15 trailing zeros, i

Nvidia and Google Are Crowding TSMC’s N3 Node - Can Intel Fill the Gap?
Nvidia is moving its next-generation Rubin GPUs from 4nm to 3nm, yet Google’s latest TPUs are already on N3 and are expected to remain there. Meanwhile, a growing number of AI CPUs from Nvidia, Amazon

Intel vs TSMC: How CoWoS Packaging Constraints Could Create an Opportunity for Intel Foundry
Taiwan Semiconductor (TSMC) is the single, most important company to the AI industry. However, to compete with the incumbent, Intel does not need to beat TSMC at leading-edge manufacturing. It only ne
Big Tech’s Free Cash Flow is Turning Negative – Who's Next?
Big Tech’s AI revenue is accelerating, but free cash flow is moving sharply in the opposite direction. Across Google, Microsoft, Meta and Amazon, capex is rising much faster than operating cash flow a
Big Tech Earnings Preview: Is AI Monetization Finally Catching Up to Capex?
The most pronounced difference between 2026’s tech rally compared to rallies in the past is which companies have been left out of it. The names most associated with the AI trade have hardly participat
Nvidia, CXL, and the Battle to Improve AI Inference Economics
This is Part 2 of our two-part series on AI inference economics. In Part 1 — Why Nvidia's Next AI Battle Is About Tokens per Watt, we laid out why tokens per watt has become the defining metric for in

Why Nvidia’s Next AI Battle Is About Tokens per Watt
As hyperscalers move from building AI infrastructure to monetizing it, tokens per watt helps to reflect if revenue is scaling and if profitability is improving. Offload engines can increase tokens per

Micron Is Up 900%. Here’s Why the AI Memory Trade May Still Have Room to Run
Over the past 10 months, memory chip stocks have gone from being solid beneficiaries of the AI boom to capturing a massively outsized piece of the return pie. The inflection in Micron’s performance de

Why the S&P 500 Shrugged Off the Iran War — and What Could Finally Break the Rally
On February 28th, the U.S. went to war with Iran, and the market was handed the kind of shock it hasn't contended with for years. The conflict set off a chain reaction across the region: an ongoing su

Nvidia, CoreWeave, and Nebius: Inside the Circular Financing of the GPU Boom
Neoclouds are one of the more hotly debated AI business models, with CoreWeave and Nebius being the two most widely recognized names. These companies have seen their sales, backlog, and share prices s
