The Low is in for Bonds, As Well As Most Stocks (For Now)
November 11, 2022

Knox Ridley
Portfolio Manager
Last week, the market went through one of the largest intraday swings since the bear market began in 2022. Since then, we have reclaimed that high. The question is: what does this mean for the market in the long term?
How the Chaos Began
It started with the FED. They indicated they are now more open to pausing interest rate hikes, which sent markets soaring. The Federal Open Market Committee (FOMC) announced that, instead of reacting to only the latest inflation numbers, they will take in the “cumulative effect” of all their rate hikes.
They further acknowledged that the aggressive actions they’ve taken to combat inflation need time to play out. In other words, it remains to be seen whether they will they be seriously damaging, ineffective, or somewhere in-between. This startling self-awareness implied that the FOMC may not need to aggressively raise rates until the effects of their rate changes are truly obvious.
The market jumped 1.5% on this announcement, as pundits began to suggest a pause was insight.
However, in the speech that followed, Jerome Powell halted bullish emotions. He acknowledged that inflation has not come down as expected, even though supply chain issues that plagued most of 2021/2022 have been resolved. But he called a pause “very premature”— there’s still so much further to go, both in how high the rate could go and in the duration that they need to stay in the stratosphere.
And so, the press conference led to a plunge in the S&P 500, which closed down -3.4% from its high earlier in the day. It became the worst sell off on a FED-day since January, which has led to a retrace of most of the bounce from the October 13th low.
What Happens Next
You might assume we should brace ourselves for a new low in the S&P 500. That would be the prevailing trend preceding every FED meeting this year, but the market isn’t operating in a vacuum, and when you look outside of the S&P 500, a different story continues to emerge.
While some FAANGs and tech darlings, like TSLA, continued lower, many sectors and global markets continued higher. We’ve been trained for over a decade to follow tech, as it will lead the market. However, a seismic shift is occurring in real-time, as new leaders are being minted. The bond market was signaling to anyone listening that this FOMC meeting was different, as the complex bottoming process we have been discussing for weeks continues to build.
This shouldn’t be a surprise to our regular readers on Seeking Alpha. Here’s what we’ve been saying:
“…more and more signs are pointing to a bigger trend reversal underway.”
“…global markets did not follow the S&P 500 to new lows last week. Instead, they are signaling that a new push higher is likely to follow.”
“…the last time we saw these patterns was in mid-June, just before the market moved up 18% in less than 2 months…”
Those predictions, by the way, were all within the past month.
Value is a Major Indicator of the Next Upward Swing
The Big Five tech companies, also known by the acronym the FAANG, are having a rough time, especially Facebook (where thousands are being laid off), and Amazon and Google, which hit new lows, most people ignored what the rest of the market was saying.
Last week we discussed how boring Caterpillar and JPM Morgan have made their first higher high, as they are closer to making all-time highs than lows. This week, we will continue with theme from a broader perspective.
The DOW
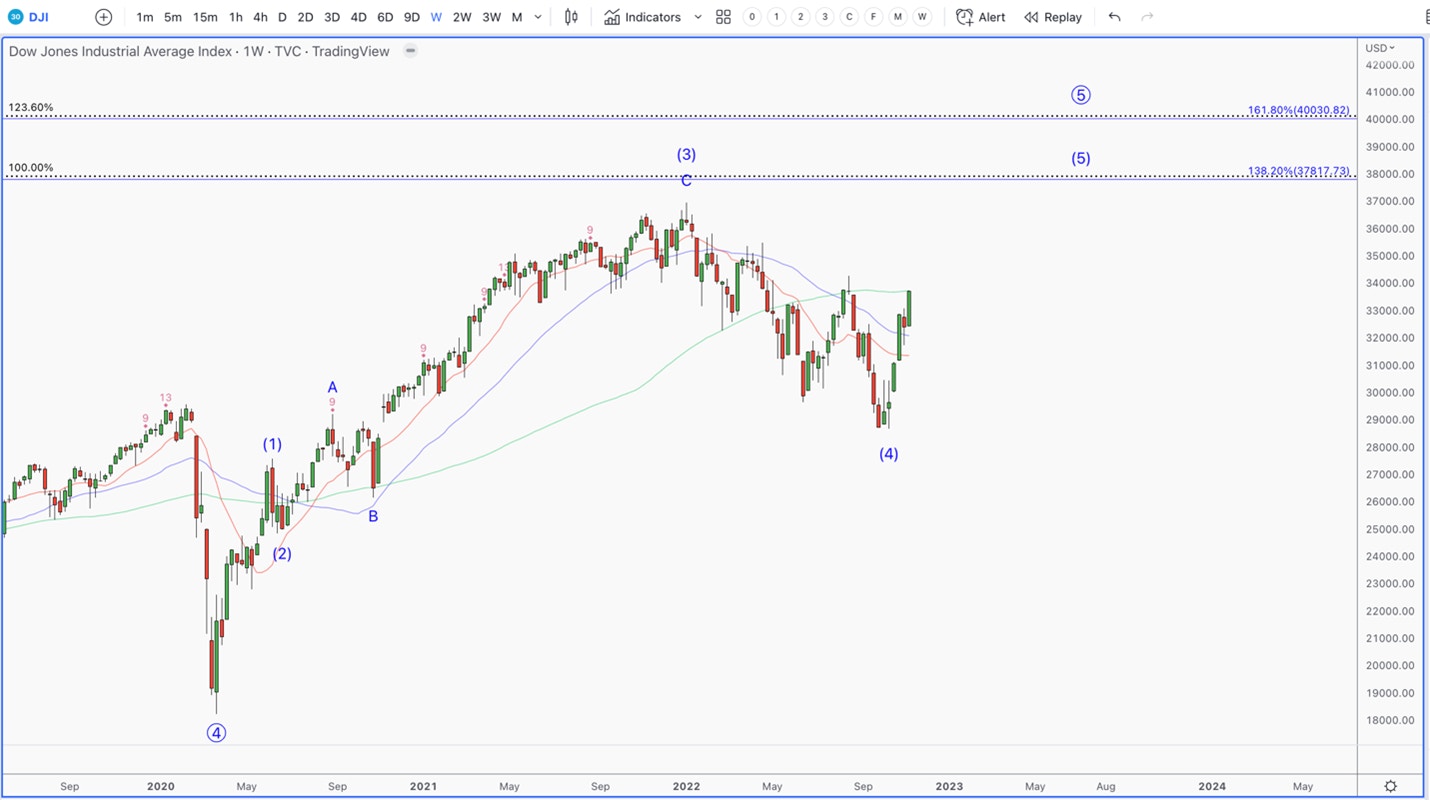
The oft-ignored Dow Jones Industrial Average (DJI) has just given us a clean and clear 5 wave pattern off its late September low, while also reclaiming the 200 day-moving average. Not only did it bottom before the NASDAQ and S&P 500, but this 5 wave pattern suggests a much larger trend is developing. Translation: If the next pullback holds the low, and we can breakout to new highs, I see the Dow Jones powering to new all-time highs in the coming months.

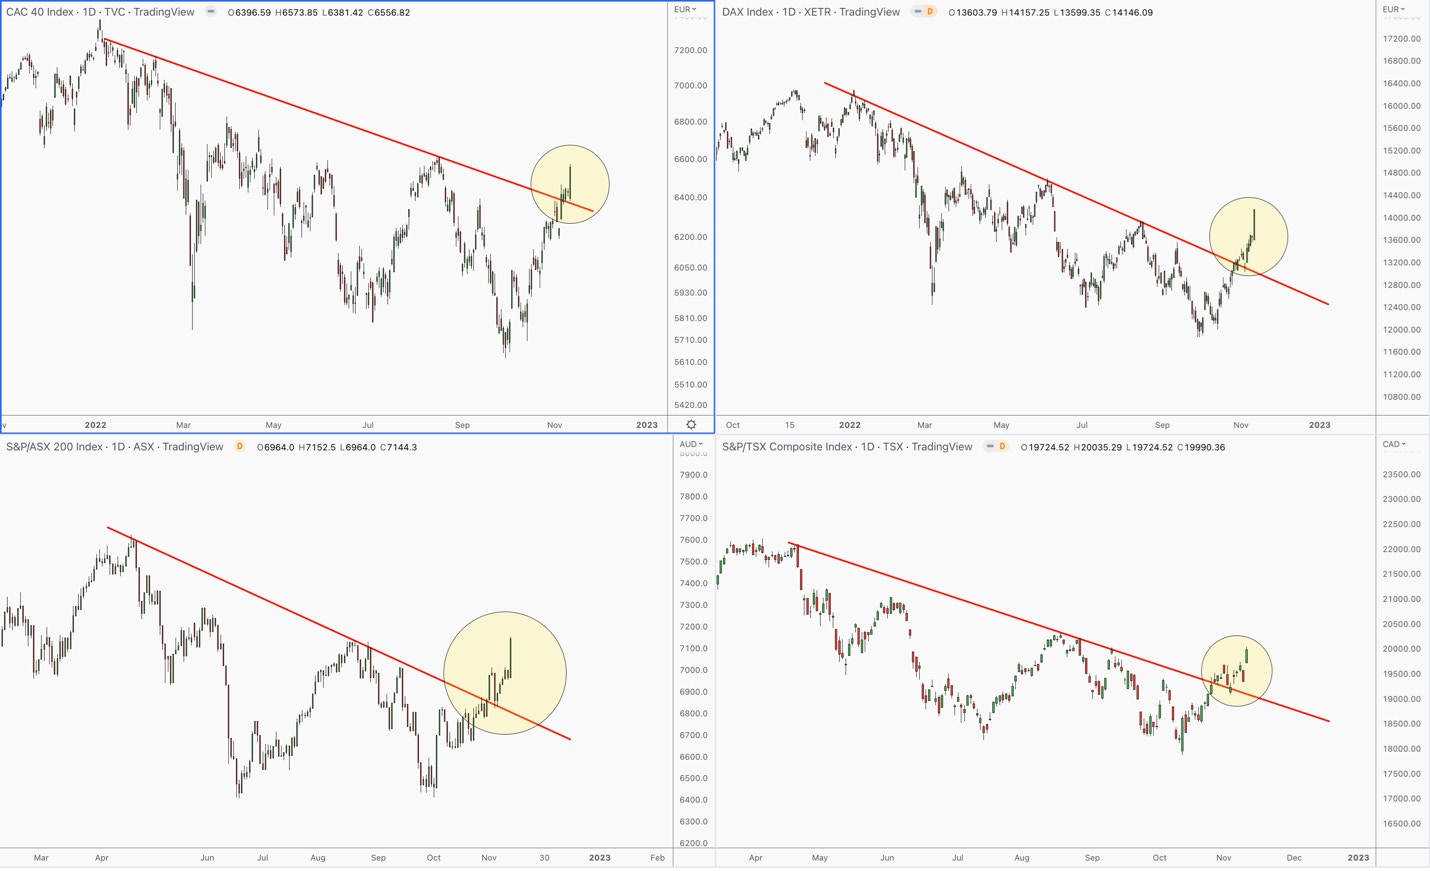
This is not only limited to U.S. value stocks. Global markets are also setting up for a bigger push higher. The French CAC-40 and German DAX have recently broken out of their bear market down trends. This is in light of Europe facing all the problems the U.S. is facing currently facing with inflation, on top of a serious energy crisis.
The Canadian TSX as well as the Australian XJO have broken out of their bear market trend lines. Interestingly, these too markets appear to be setting up for a run the higher highs like the Dow Jones.

The reason I am mentioning this is because really big trends occur when all markets are moving in the same direction. While tech and some FAANGs have a setup to go lower, the rest of the market looks like it is setting up to go higher. It’s important to track these markets in order to get clues on when bottoms (and tops) are developing. A bottom never happens when everyone is expecting it, and it almost always happens when sentiment has reached a bearish extreme.
Transportation Is Having a Bonanza
The transportation sector has historically been a leading indicator of America’s economic growth, and therefore it often leads the stock market.
The Dow Jones Transportation ETF (DJT) is also exhibiting relative strength compared to the broad market. While the Tech heavy NASDAQ-100 is about 9% off its lows, and the S&P 500 is 12% off its lows, DJT is over 16 % off its lows.

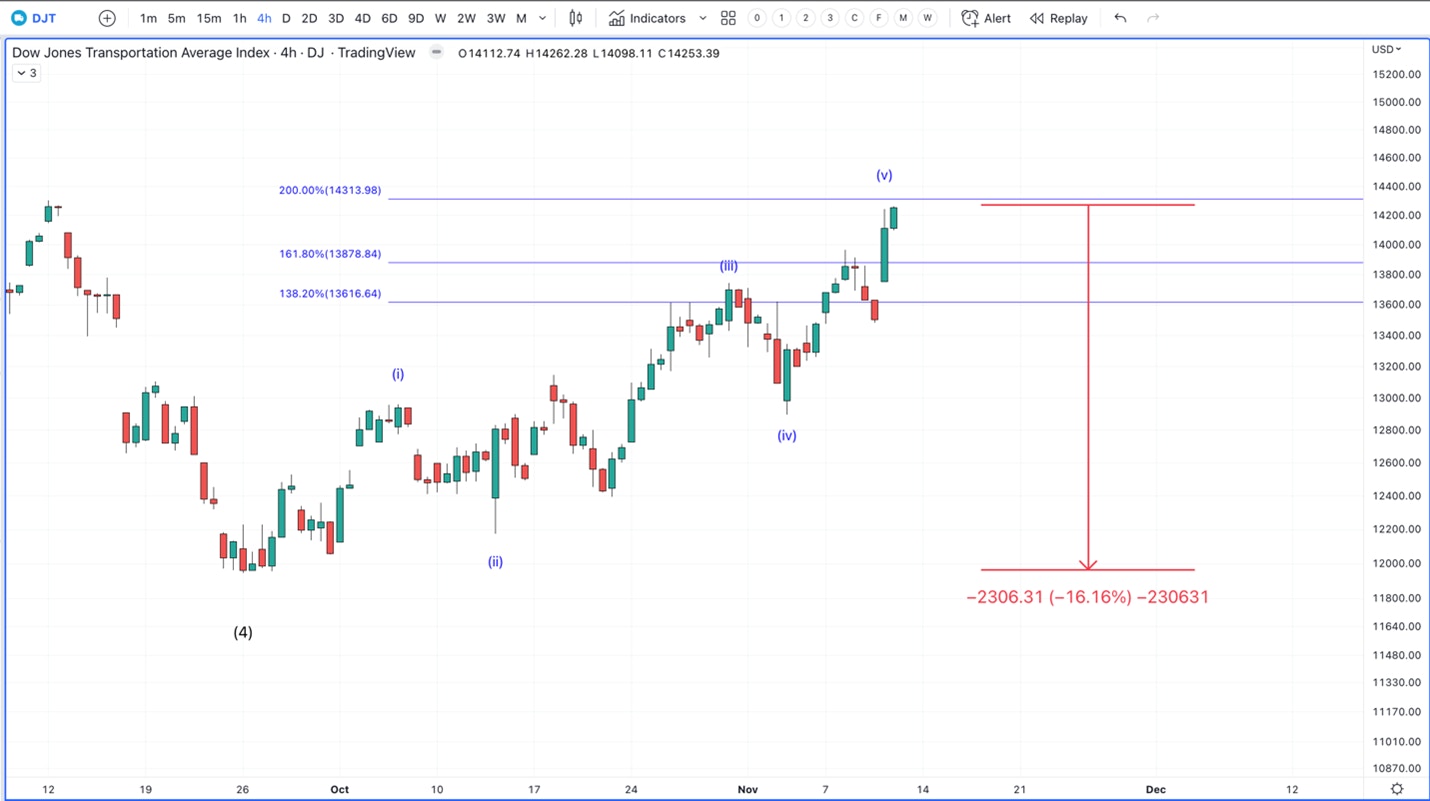
Also, like the Dow Jones, it has just completed a 5 wave pattern off the low, suggesting that a bigger rally is likely.
If the next pullback can hold the low, and then turn back above to make a fresh high, it will be signaling that a major low was put in as we move into the heart of a new rally.
The Bond Market Called the FED’s Bluff
The FOMC announcement triggered an odd reaction in a sector few were paying attention to: bonds. The further one gets on the curve, in our experience, the less of an effect FED decisions has on rates; instead, growth and inflation expectations affect them more. After every hawkish policy decision this year, we have seen rates go higher, as long duration bonds hit a fresh low.
Last week, we discussed how bonds were setting up for a multi-month rally. This week we will acknowledge the very important fact that bonds not only failed to make a new low after the last FED speech, but they have since reclaimed the high on FED-day. This is significant, as the bond market is pricing in inflation and rate hikes, and signaling a low in bonds.

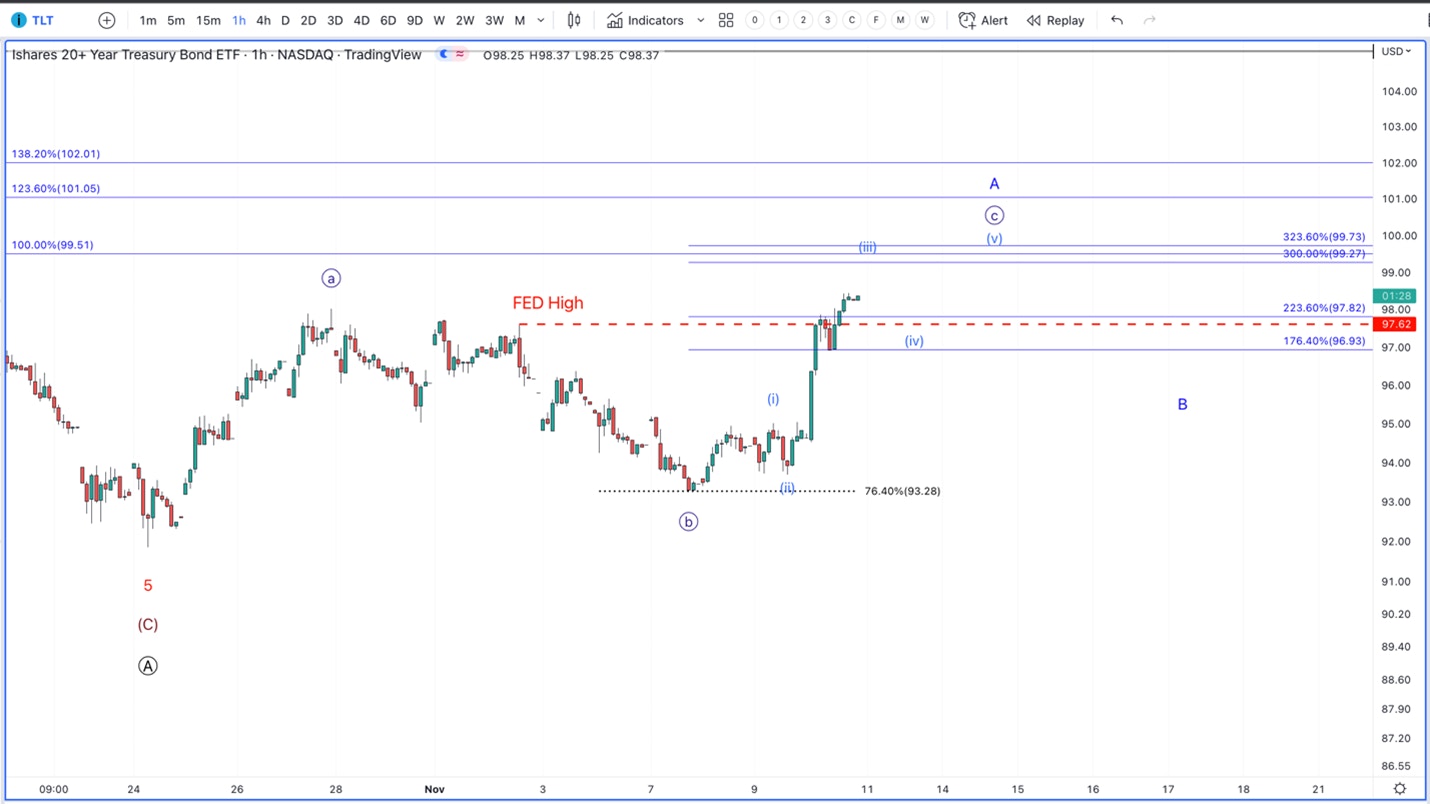
As bonds catch a long-term bid, rates will only go lower. This will force many beaten down tech stocks, which are simply long duration assets, to get repriced. This will be a tailwind for tech, and we believe today was the beginning of this repricing.
In anticipation of favorable repricing, coupled with tech’s beaten down valuations, we have been building key positions with real-time trade alerts sent to our premium subscribers.
Sign up for I/O Fund's free newsletter with gains of up to 221% - Click here
Market Levels
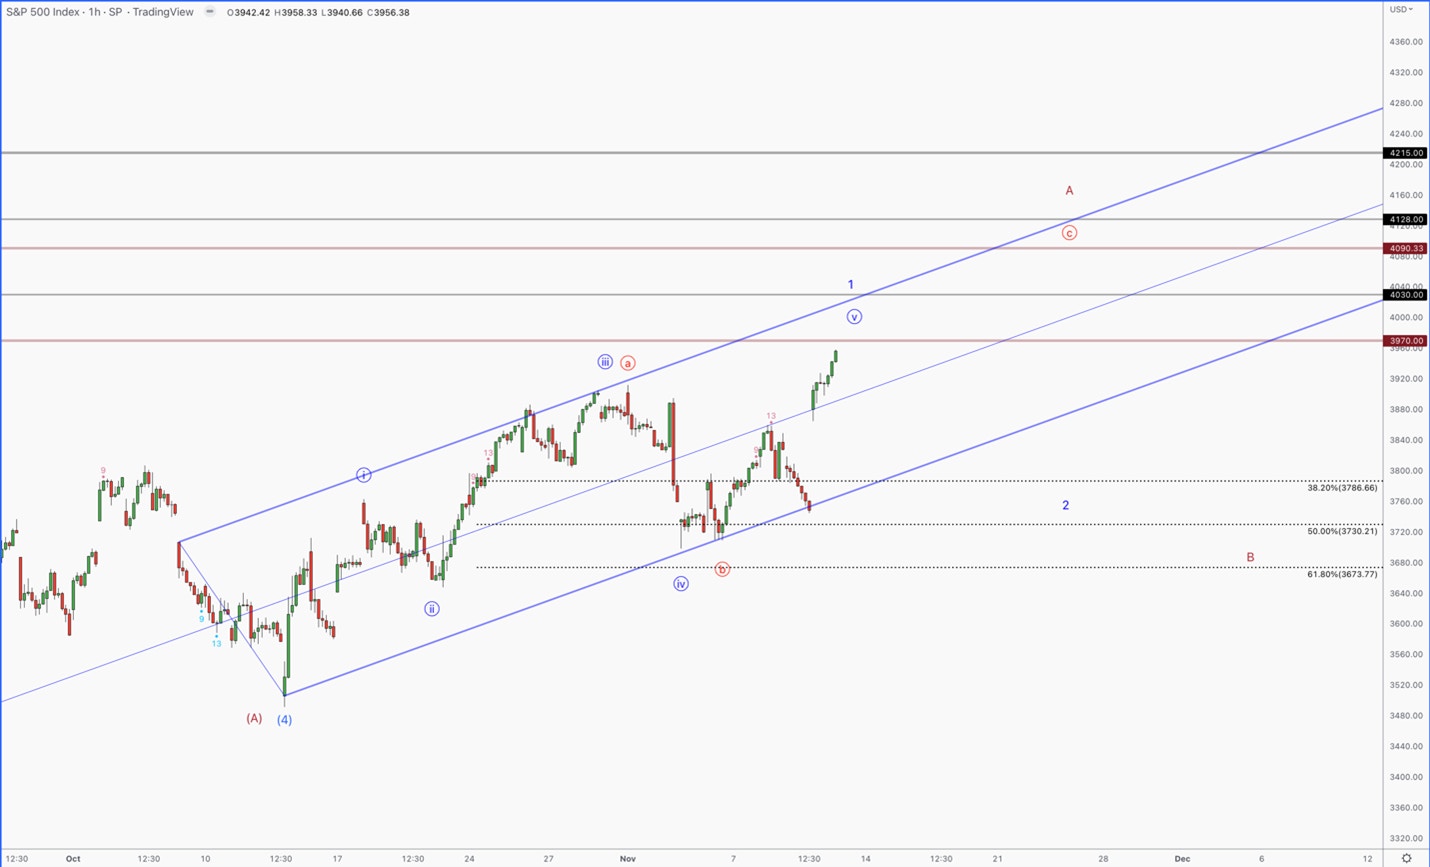
Reminder: the market rallied about ~12% just on a rumor of a potential pivot by the FED. Regardless of whether you believe we had it, the market definitely sold the news, and failed to make a new low. Not only that, but the S&P 500 reclaimed the 3912 level which was the high going into the FED speech. This is significant, as it is the first FED high the market has taken back in 2022.
With the divergences we have been talking about for weeks, if we do see continued volatility, it will likely be setting up a buyable low as we setup for a larger rally in the coming weeks.
The S&P 500 is not as clear as the Dow Jones. Like DJT, it completed 5 waves off its October 13th low, but it did so in a messy fashion. There are two primary probabilities: either the S&P 500 will make a new high in 2023 OR will instead play out a larger degree bear rally. If the next pullback can hold the low, then turn back and make a new high, I will be leaning towards the S&P 500 seeing new highs into 2023.
This would occur in large swings and likely take us back to 4300 SPX. It would be the scenario where some stocks and markets make new highs, while others do not. However, what is important to understand is that when you combine what rates, the dollar, global markets and many value stocks are telling us, it is that a large rally of some kind is under way.

What’s Coming— And When
The potential for some stocks to make a new low is present. However, the larger setup is for stocks to keep pushing higher. Short of a black swan event, we think most of the risk over the intermediate to long-term time frame is up --- but the FAANGs do not appear to be leading, as we have been accustomed to expect. However, weakness in these companies does not seem to be signaling weakness across the market. As long as rates hold their high, and many of the value stocks that are well off their highs hold, I see any additional volatility as a buying opportunity.
Regarding tech, not all companies are equal. One of the strongest companies in the market, is a well-known tech name, bottomed in May and is nearly 40% off its lows. While we will likely not see an all-encompassing tech rally, we do believe some names are setting up to be new leaders. The prices we are seeing, we believe, will pay off handsomely in the coming years.
Who’s ready for it?
Every Thursday at 4:30 pm Eastern we provide our Premium Members with a weekly market webinar where we discuss the stocks we’ve entered and exited throughout the week, plus stocks that are about to break out and our buy plan. The information from our weekly webinars have been used to successfully hedge our portfolio multiple times in 2022, as well as build positions at key levels. When we buy positions, sell positions or hedge the market, real-time trade alerts are sent to our Premium Members plus we offer a fully managed portfolio including details on allocations.
Please note: The I/O Fund conducts research and draws conclusions for the Fund’s positions. We then share that information with our readers. This is not a guarantee of a stock’s performance. Please consult your personal financial advisor before buying any stock in the companies mentioned in this analysis.


More To Explore
Newsletter

Nvidia and Google Are Crowding TSMC’s N3 Node - Can Intel Fill the Gap?
Nvidia is moving its next-generation Rubin GPUs from 4nm to 3nm, yet Google’s latest TPUs are already on N3 and are expected to remain there. Meanwhile, a growing number of AI CPUs from Nvidia, Amazon

Intel vs TSMC: How CoWoS Packaging Constraints Could Create an Opportunity for Intel Foundry
Taiwan Semiconductor (TSMC) is the single, most important company to the AI industry. However, to compete with the incumbent, Intel does not need to beat TSMC at leading-edge manufacturing. It only ne

Big Tech’s Free Cash Flow is Turning Negative – Who's Next?
Big Tech’s AI revenue is accelerating, but free cash flow is moving sharply in the opposite direction. Across Google, Microsoft, Meta and Amazon, capex is rising much faster than operating cash flow a
Big Tech Earnings Preview: Is AI Monetization Finally Catching Up to Capex?
The most pronounced difference between 2026’s tech rally compared to rallies in the past is which companies have been left out of it. The names most associated with the AI trade have hardly participat
Nvidia, CXL, and the Battle to Improve AI Inference Economics
This is Part 2 of our two-part series on AI inference economics. In Part 1 — Why Nvidia's Next AI Battle Is About Tokens per Watt, we laid out why tokens per watt has become the defining metric for in
Why Nvidia’s Next AI Battle Is About Tokens per Watt
As hyperscalers move from building AI infrastructure to monetizing it, tokens per watt helps to reflect if revenue is scaling and if profitability is improving. Offload engines can increase tokens per

Micron Is Up 900%. Here’s Why the AI Memory Trade May Still Have Room to Run
Over the past 10 months, memory chip stocks have gone from being solid beneficiaries of the AI boom to capturing a massively outsized piece of the return pie. The inflection in Micron’s performance de

Why the S&P 500 Shrugged Off the Iran War — and What Could Finally Break the Rally
On February 28th, the U.S. went to war with Iran, and the market was handed the kind of shock it hasn't contended with for years. The conflict set off a chain reaction across the region: an ongoing su

Nvidia, CoreWeave, and Nebius: Inside the Circular Financing of the GPU Boom
Neoclouds are one of the more hotly debated AI business models, with CoreWeave and Nebius being the two most widely recognized names. These companies have seen their sales, backlog, and share prices s

AMD, Nvidia, Arm, Intel: Inside the $120 Billion CPU Gold Rush
CPUs have gone from an afterthought to becoming the AI trade’s next great bottleneck – and with AMD, Nvidia, Arm and Intel circling a market that is doubling nearly overnight, the only question left i
