Levels to Monitor in the Coming Pullback
August 26, 2022

Knox Ridley
Portfolio Manager
In early July, the broad market failed to make new lows even despite bad news. The CPI print came in at a 40-year high, followed by the producer price index surprising to the upside. This told the market that inflation was still an issue and would likely be into the near future. This was then followed by mixed banks earnings, as reports of a looming economic slowdown and run-away inflation was starting to show up in earnings.
Yet, the S&P 500 continued to trend up on this bad news, which is a pattern we typically see around meaningful shifts in trends. Once the market starts going up on bad news, it’s telling us that what is known is priced in. What followed was a swift move that caught many investors off guard. Due to having ample experience in weathering pullbacks, we built key positions in the month of May and June as we felt the prices were “good enough” based on our time horizon.
With that said, outside of building key positions, we have also been warning our readers for the past month to be cautious. We still do not have confirmation that the bear market is over and we will have better opportunities to accumulate if this confirmation starts to develop.
What we want to see to start building this case is: 1) We only have a 4-wave bounce off the June 16th low. We want to see this bounce make one more high, which would complete a 5 wave pattern; 2) Rates need to confirm a bottom; 3) The US dollar needs to confirm a top.
I believe that the most important of these three occurrences is the first one. Trend reversals tend to develop in 5-wave patterns. If we can get a confirmed 5-wave push off the June low, the odds will start favoring a bigger uptrend is developing over the long-term. However, because the bond market and USD is not lining up with this scenario, investors should be cautious and expect more volatility until they do.
In last week’s broad market webinar, we warned our readers that a pullback was imminent. We also laid out what levels need to hold in order to confirm a new uptrend is forming. We also showed that the bond market is simply not buying what the equity market is, and that the USD pushing to new highs along with equities. These markets are simply not aligned with the current uptrend in equities, and until they are, we will remain cautious.
The below video goes through the levels as well as possible scenarios we could see play out over the coming months...
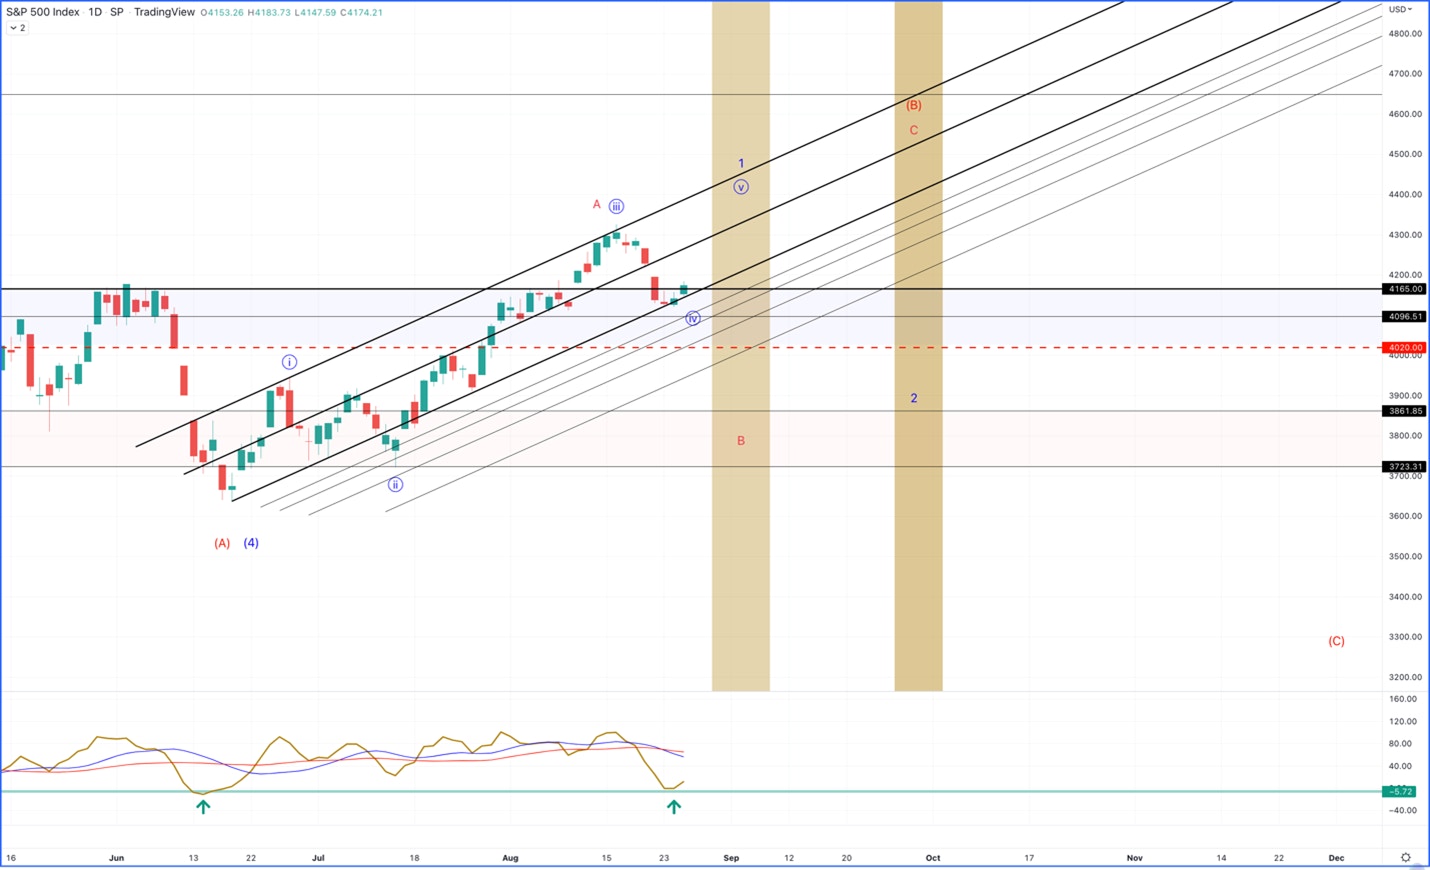
- The Bull Case: we want to see a pullback into the 4165-4020 region. We then need to see the market hold this region, and then turn back up to make one more high. If this happens, we have a clean 5 wave push off the June low, and a important evidence that a new uptrend is developing into 2023.
Since the last video, the S&P 500 pulled back just over 4% in three trading days, and is currently in our target zone. We need to see buyers push the market above SPX 4330 to confirm that final 5th wave. We should know in the next two weeks if the above scenario is in play. - The Bear Case: if we fail to make a new high above SPX 4330, and instead turn back down below the 4020 region, what the market is telling us is that 2023 is likely setting up for another leg down in the current bear market. If this does happen, we will be looking for one more large push higher into the Fall before we prepare our portfolio for this outcome.
No matter what scenario plays out, we expect around a ~10% pullback in the coming weeks, which should be followed by one more large push above SPX 4400 before the next leg lower begins. Here is an updated chart with the two scenarios we are tracking (blue is the bull case and red is the bear case).

Supporting Markets - Rates, USD
These are the charts that we have been tracking weekly. They are also the primary culprits behind the downward pressure on equities. Runaway inflation has forced the bond market to sell bonds due to a fixed yield well below the current CPI prints. Bonds do well in deflationary environments and poorly in inflationary ones. As bonds go down, rates go up, forcing equities to reprice their future projections.
Also, as the FOMC aggressively raises rates, the USD becomes scarcer, thus making it stronger. With the level of international exposure many US companies have in their revenue, this makes buying US goods more challenging internationally. Higher rates and a strong dollar are not great for equities, especially risk assets, hence the selling. So, we need to see a reversal in these two charts, specifically in order to confirm a new uptrend is developing.
Sign up for I/O Fund's free newsletter with gains of up to 403% - Click here
The equity market has rallied in a big way on the back of inflation data surprising to the downside for the first time in July 2022. This was followed up by several data points, such as, the producer price index coming in lower than expected, coupled with on-going housing data and manufacturing data that also suggests inflation may have peaked.
This was accompanied with a less hawkish tone from Jerome Powell in July, as the ECB started to increase its hawkish tone regarding soaring inflation in Europe. By all measures, it appears that the equity market is pricing in all the current inflation data, as well as a coming FED pivot. However, the bond market isn’t buying what the equity market currently is.
If peak inflation is behind us, and a FED pivot is likely to follow. Then the on-going slowdown in global economic output should take center stage.

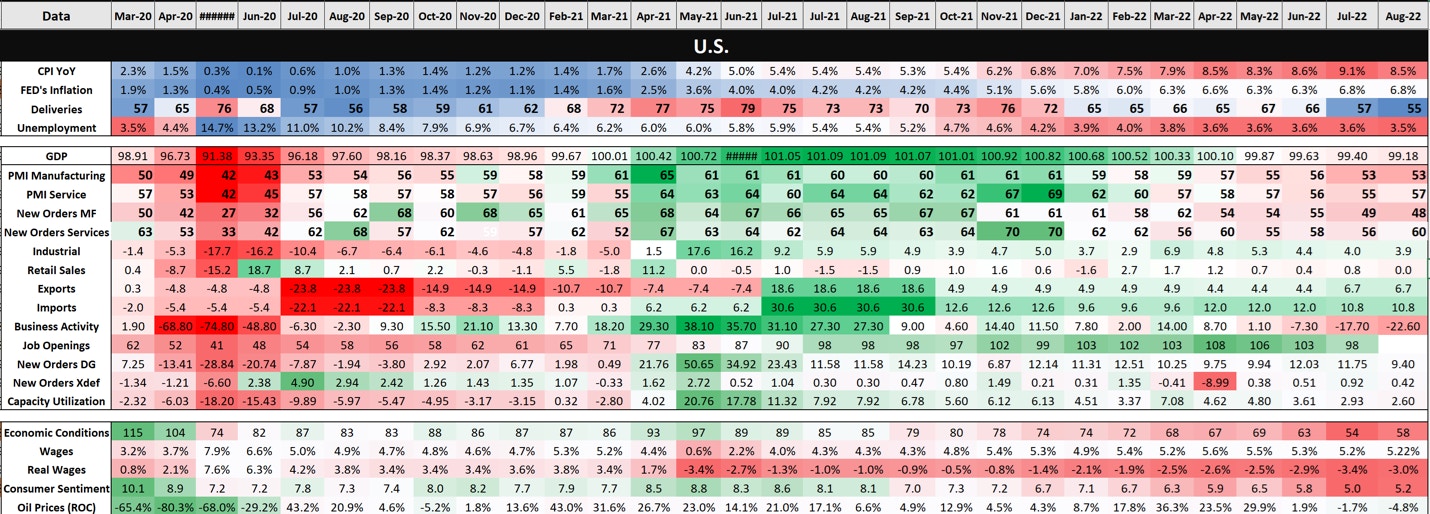
The above chart is a visual representation of US economic growth on a MoM basis. As the economy continues to slow, bonds should become more attractive, especially considering we are seeing attractive yields accompanied with the potential for peak inflation. Yet, since August 1, the ETF that tracks long duration government bonds (TLT), is down over 7%.

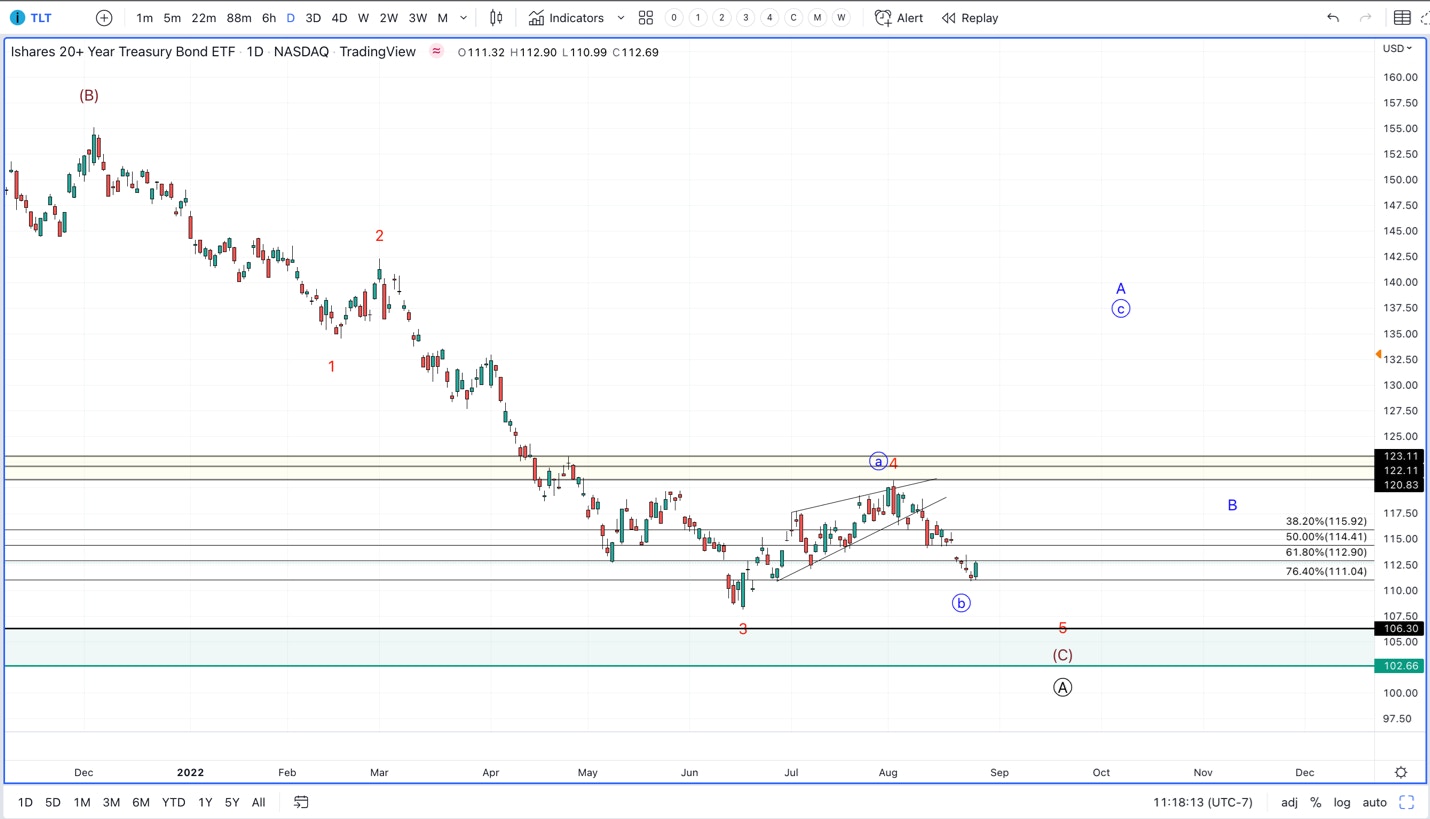
This means that the bond market is selling bonds, not buying them. Furthermore, you would expect the dollar to put in a top while the Euro puts in a bottom based on the rhetoric we are hearing from the central banks.

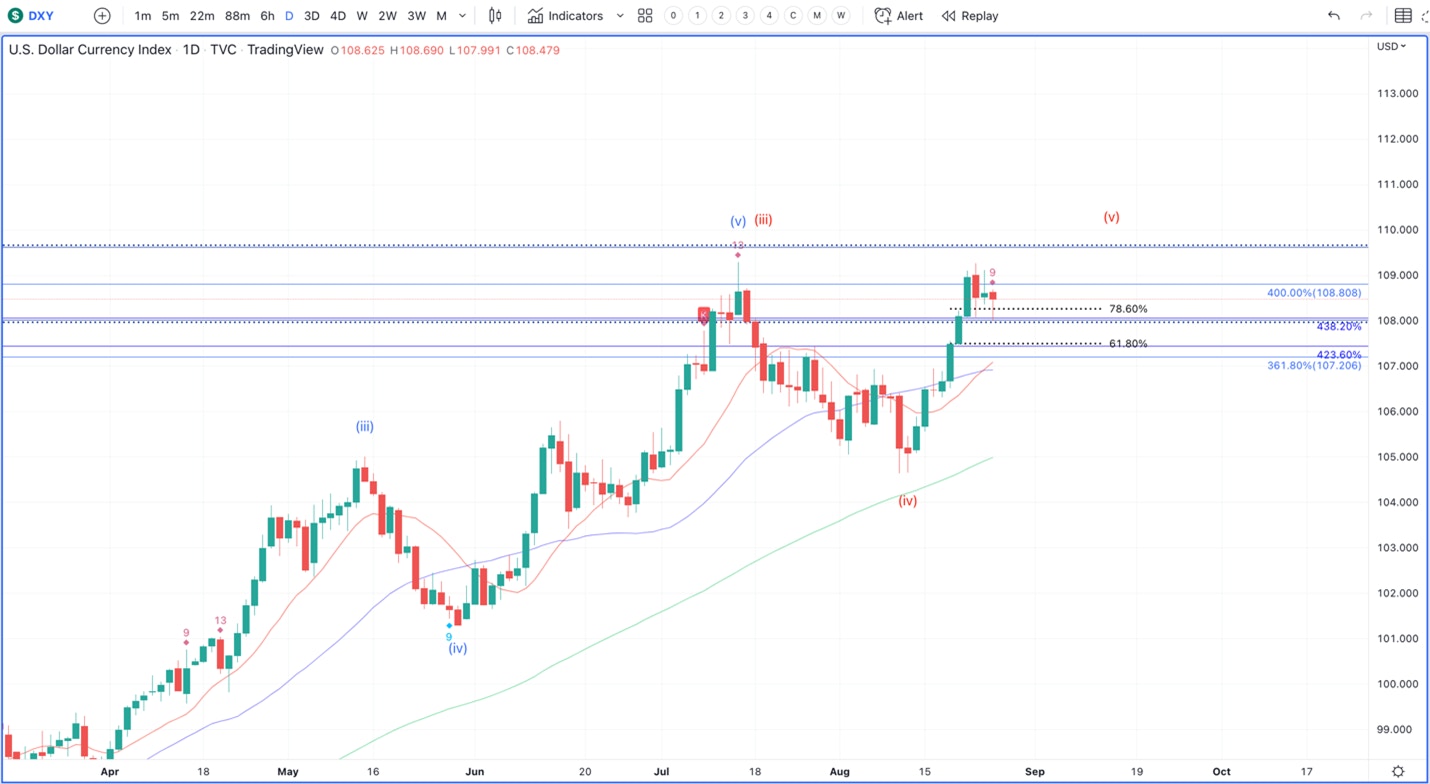
The dollar Index (DXY) is doing the opposite, as it is less than 1% away from making a new high. This is not the kind of action you’d expect to see if we were really past peak inflation and the FED was looking to pivot.
In Conclusion
We follow price, and if the broad market can give us a 5 wave push over the coming weeks, we expect bonds and the USD to get in line as we further base into the fall. These patterns tend to precede developing fundamentals, which is why it’s important to be aware of them while also following the price structure in the broad market. These markets are warning investors that are paying attention to not get too excited, yet. No matter what scenario plays out, we do believe there will be a better opportunity to get aggressive on the long side.
Please note: The I/O Fund conducts research and draws conclusions for the Fund’s positions. We then share that information with our readers. This is not a guarantee of a stock’s performance. Please consult your personal financial advisor before buying any stock in the companies mentioned in this analysis.


More To Explore
Newsletter

Token Growth is Surging - Here Are the Beneficiaries
The reality of AI demand growth has shattered early estimates for token processing, yet expectations continue moving up and to the right. In the second installment of our token processing series, we e

AI Token Demand is Shattering Forecasts
Total annual token processing is no longer measured in billions or trillions of tokens, but in the quadrillions and beyond. As annual token processing is now tracked in units with 15 trailing zeros, i

Nvidia and Google Are Crowding TSMC’s N3 Node - Can Intel Fill the Gap?
Nvidia is moving its next-generation Rubin GPUs from 4nm to 3nm, yet Google’s latest TPUs are already on N3 and are expected to remain there. Meanwhile, a growing number of AI CPUs from Nvidia, Amazon
Intel vs TSMC: How CoWoS Packaging Constraints Could Create an Opportunity for Intel Foundry
Taiwan Semiconductor (TSMC) is the single, most important company to the AI industry. However, to compete with the incumbent, Intel does not need to beat TSMC at leading-edge manufacturing. It only ne
Big Tech’s Free Cash Flow is Turning Negative – Who's Next?
Big Tech’s AI revenue is accelerating, but free cash flow is moving sharply in the opposite direction. Across Google, Microsoft, Meta and Amazon, capex is rising much faster than operating cash flow a
Big Tech Earnings Preview: Is AI Monetization Finally Catching Up to Capex?
The most pronounced difference between 2026’s tech rally compared to rallies in the past is which companies have been left out of it. The names most associated with the AI trade have hardly participat

Nvidia, CXL, and the Battle to Improve AI Inference Economics
This is Part 2 of our two-part series on AI inference economics. In Part 1 — Why Nvidia's Next AI Battle Is About Tokens per Watt, we laid out why tokens per watt has become the defining metric for in

Why Nvidia’s Next AI Battle Is About Tokens per Watt
As hyperscalers move from building AI infrastructure to monetizing it, tokens per watt helps to reflect if revenue is scaling and if profitability is improving. Offload engines can increase tokens per

Micron Is Up 900%. Here’s Why the AI Memory Trade May Still Have Room to Run
Over the past 10 months, memory chip stocks have gone from being solid beneficiaries of the AI boom to capturing a massively outsized piece of the return pie. The inflection in Micron’s performance de

Why the S&P 500 Shrugged Off the Iran War — and What Could Finally Break the Rally
On February 28th, the U.S. went to war with Iran, and the market was handed the kind of shock it hasn't contended with for years. The conflict set off a chain reaction across the region: an ongoing su
