Market Update – January 16th
January 17, 2020

Knox Ridley
Portfolio Manager
As we have referenced in the past, we are not a research site that attempts to predict the market. We think that’s a nearly impossible task. We simply keep an eye on various, opposing scenarios while providing stock tips we think are relevant in the current environment.
Bull Count
The level I’ve been watching is the S&P 500 at 3200. The market powered through this and has overtaken 3300. This means the bull market could take us up to 3800-4000 region. This is based on basic Elliott Wave analysis where the 5th wave, more times than not, reaches the length of the 1st wave, or an extension of that wave, which we see time and time again.
My rational for such a position is based on the global loose monetary policy seen by central banks. Not only are dozens of central banks cutting rates, but the Federal Reserve publicly said the goal is to keep the expansion alive, and they are using tools used to re-stimulate an economy from a recessionary position. In other words, they are going all-in on keeping the expansion going.
Also, it’s worth noting that an accommodative Fed has historically been great for MOMO stocks. As long as inflation stays muted according to the CPI, and central banks stay accommodative, I will stay long tech with rising stops to match rising gains.
Another point of encouragement is that a record level of cash is still on the sidelines, waiting to come back in. Furthermore, one trading platform shows 69% of clients are short the S&P 500 today. As these shorts cover their losses, it will force more buying, which will force more covers. Massive levels of shorts can propel a market, and this pattern will continue until the shorts give up, which can be propelled forward if cash on the sidelines moves in because of FOMO.
So, long term, I am bullish and slow-tilting my portfolio towards a more aggressive stance. However, in the medium term – i.e., a few weeks to a month out – I am expecting a local top to take us back at minimum 3%-5%, at which point I’ll look to allocate more of my cash. Tech has led this market and I believe it will continue to lead throughout the expansion.
Flashing Bear Signals
I’m going to expand on this more next week, but the current market environment is not without some flashing signals. It’s important to understand the backdrop in which we are investing and also where we are in the current market cycle.
In a nutshell, these are:
- The yield on the 2-year treasury and on the 10-year treasury have inverted. The inversion occurred in August of 2019 and the average time period before a recession following an inverted yield curve is 18.5 months.
- According to the ISM, manufacturing peaked and has been in a steady decline since late 2019. Once again, this trend has preceded every recession, and about 31 months after the cycle peak, on average, a recession follows. So far, the ISM peaked in summer of 2018.
- The Conference Board Leading Economic Index (LEI) is at the zero line. This is at its lowest level in over a decade. To be clear, it has not crossed yet, so it’s worth watching. I’ll expand more on this next week.
- After several years of zero percent interest rates, corporate debt is at historic and unsustainable levels totaling over $10 trillion total, or 47% of our national GDP. Fifty percent of investment grade debt is in the BBB ratings.
I’ll go more in-depth next week on those signals. The way that I protect my gains is to have trailing stops between 10-30%. If I hit my stop on a stock that I like, I will re-enter once the price has stabilized. A recent example is when I exited Zoom at $68 and got back in at $62. This is a small-scale exit, whereas Nvidia’s crypto bust was a larger-scale exit. My gains were protected and I simply re-entered once the price stabilized again. This is the only way I’ve found that I can stay in the market when there is a lot of noise towards the end of a market cycle.
Technical Analysis:
By Knox Ridley
Alteryx (AYX)

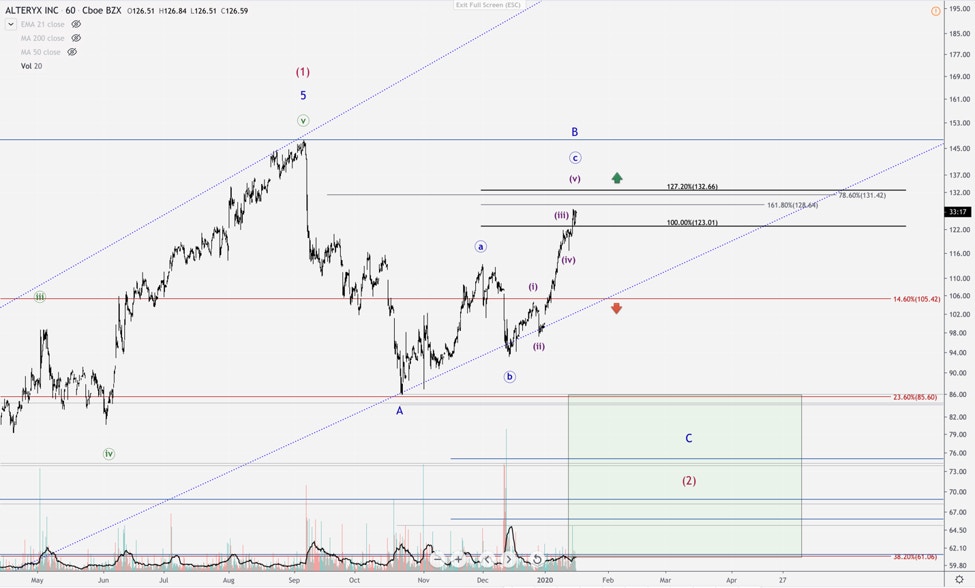
After about a 40% drawdown, Alteryx has dragged along the bottom of the long-term trend channel, which is highlighted by the blue dotted lines. The move up appears to be overlapping, and therefore corrective in nature, with the final C-wave unfolding in a 5-wave pattern, which I’m targeting the 127.2% extension around $133. I’m treating this as a corrective move, and holding off on adding to my current position until:
(1) we break $133 with heavy volume, at which point I’ll hold this position with a very tight stop until we clear new highs. If this happens, we will be in the heart of a 3rd wave, and the bottom for wave-2 will be in.
(2) AYX stalls in the coming days/weeks, and retests the $100 level. If this support doesn’t hold, I’ll look to pick up more shares as we approach the C-wave target box that I outlined in the chart above.
Roku (ROKU)

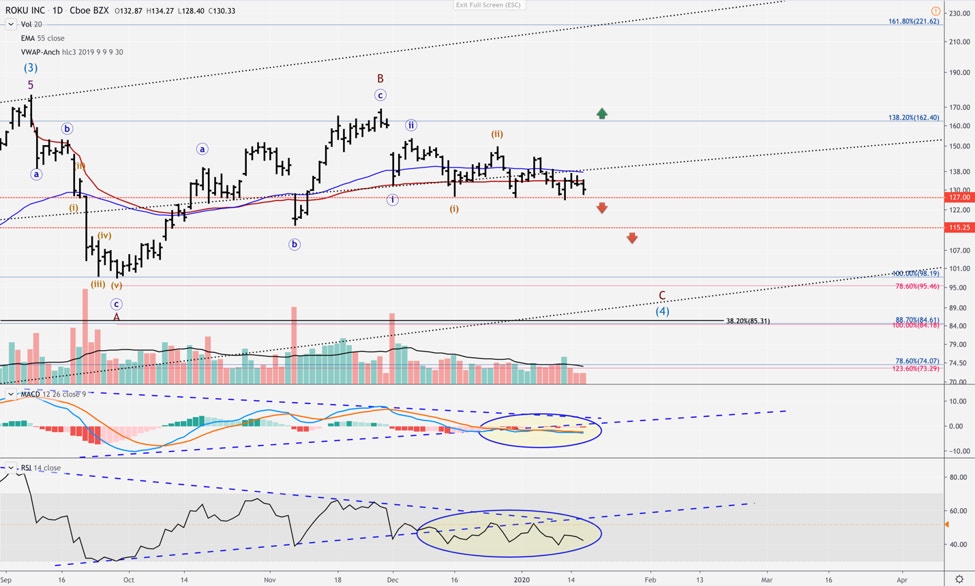
I’ve been patiently waiting to pick up more Roku sub-$100, and the set-up is in place for this to happen. Roku has tested the $127 support level 3 times, and each time it has corrected from $127 with less momentum and lower highs.
It’s currently trading just under the Volume Weighted Moving Average, which I anchored at the all-time high (in red). This average factors in volume from a critical moment. This week, the bears are in control. Furthermore, the price is below the 55-day exponential average, which is a great measurement of the overall trend.
Also, look at the internals (MACD, RSI). They have both broken their respective trendlines and are heading lower. I take this as a warning.
But, most importantly, the final C-wave set up is intact. Corrective waves (second waves and 4th waves) unfold in 2 moves (A down, B up, C down). There are several rules patterns that we see over and over. One of the most notable is that the C wave will almost always unfold in an impulsive, 5-wave structure, which on lower time frames will have its own smaller degree 5-wave structure.
We have a 1-2, (i)-(ii), i-ii setup right at the $127 support. If $127 is broken, we will be in the 3rd wave lower. Based on basic Elliot Wave, I’m expecting this move to terminate around $100-$95, at which point, I’ll look to add to my long-term position. Just to be clear, I’m still expecting Roku to reach $200 by 2021.
However, it’s worth noting that Roku has held the $127 support, and though the signals are suggesting that it could head lower, Roku has a tendency to move fast against bears. On a long-term basis, $127 is not a bad price to pay for this stock, based on what we are projecting for 2020.
Also, if Roku can break out on heavy volume in a 5-wave move up from $127 upwards, while the internal indicators break their downtrend (look at the green arrows), I’ll scrap this bearish set-up, and look to go long from higher levels.
Qualcomm (QCOM)

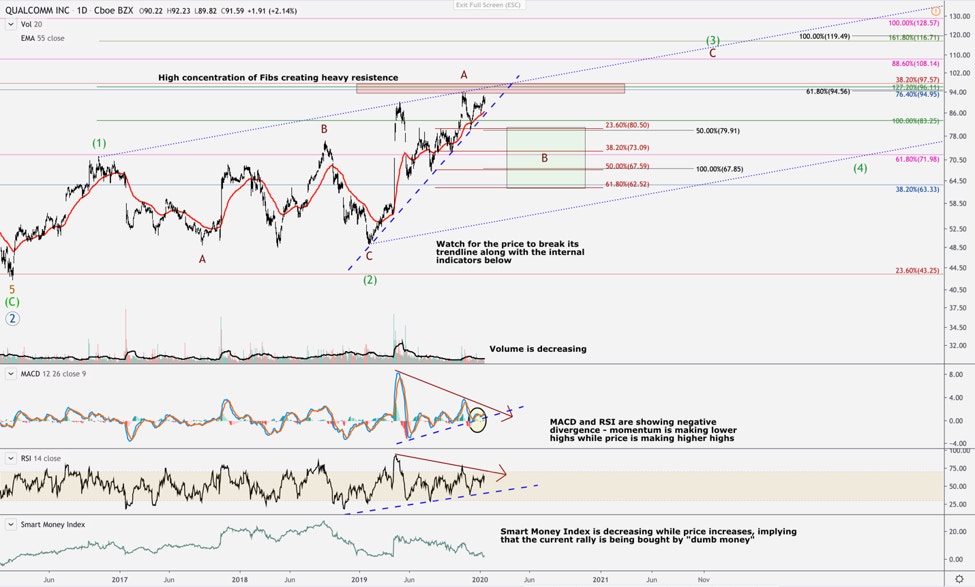
QCOM is approaching a cluster of resistance. The red box highlights a strong concentration of significant Fibonacci prices. Rarely do you see a concentration like this. QCOM will either break through on heavy volume, which would be an indication to go long, or it will break down from current levels. If we break down, I’ll be looking to add to my position in the green target box between $80 and $62.
Alibaba (BABA)
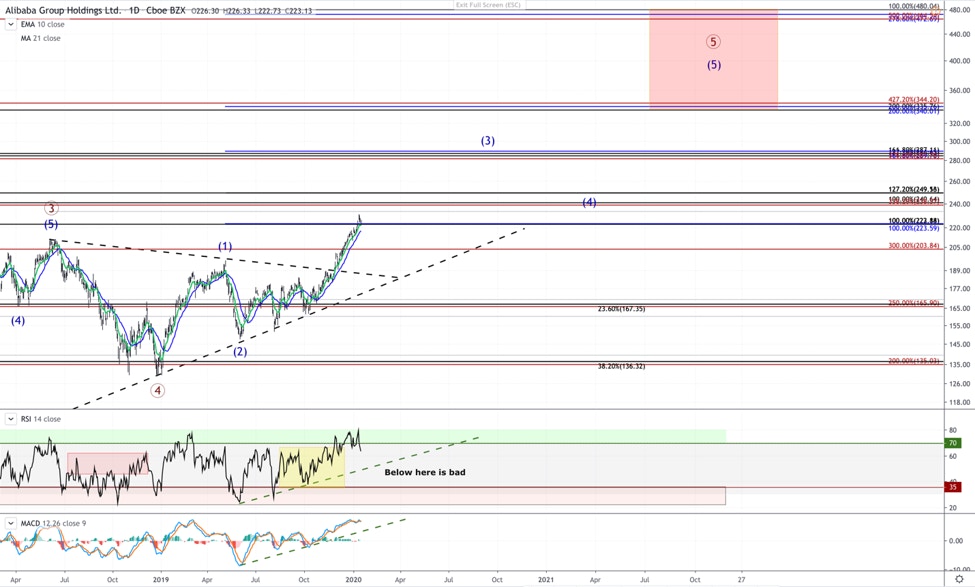
Since Alibaba broke out, we have clearly been in a 3rd wave uptrend. For anyone curious what a 3rd wave feels like, this is it – an uninterrupted bull train, where the price stays above the 10 and 20-day EMA. I’ve put my targets in the chart above as well as significant resistance zones as we continue upwards. We should have pullbacks along the way.
Twilio (TWLO)
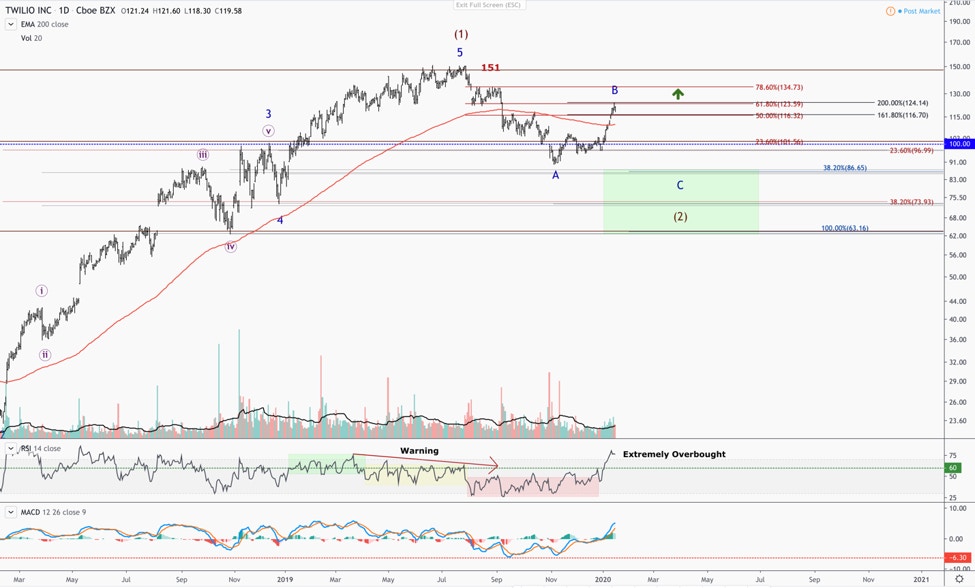
Twilio has shot straight through the 200-day SMA and found resistance at the 61.8% retrace level around $123. If Twilio can break this region, I will likely begin layering into Twilio. I will want to see it break through the $135 region for a final confirmation that the 2nd wave is over. However, a move up like we’ve seen in Twilio, breaking the 61.8% retrace is worth noting.
Zoom (ZM)
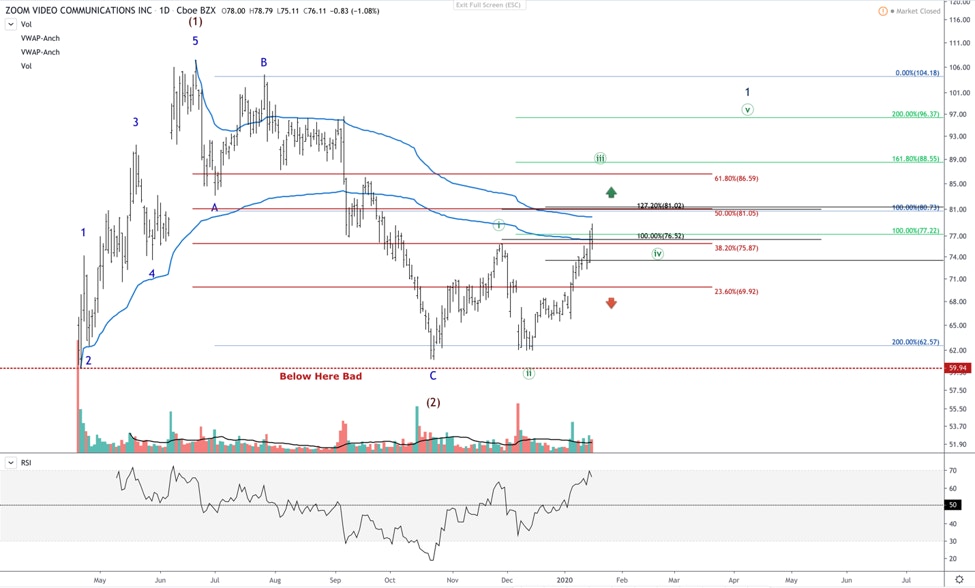
So far, Zoom is playing out as planned. After topping out in its first wave, it retraced nearly the entirety of that move in a very deep second wave. Since then, it’s provided us with a 1-2 setup, and is now powering up towards its AVWAPS. We picked up shares in the low $60s with a stop at all-time lows. As long as this level holds, I’m expecting new highs this year for ZM. If it can power through the above AVWAP in blue, that will be a strong showing of strength, at which point I’ll add more to my position.


More To Explore
Newsletter

Nvidia and Google Are Crowding TSMC’s N3 Node - Can Intel Fill the Gap?
Nvidia is moving its next-generation Rubin GPUs from 4nm to 3nm, yet Google’s latest TPUs are already on N3 and are expected to remain there. Meanwhile, a growing number of AI CPUs from Nvidia, Amazon

Intel vs TSMC: How CoWoS Packaging Constraints Could Create an Opportunity for Intel Foundry
Taiwan Semiconductor (TSMC) is the single, most important company to the AI industry. However, to compete with the incumbent, Intel does not need to beat TSMC at leading-edge manufacturing. It only ne

Big Tech’s Free Cash Flow is Turning Negative – Who's Next?
Big Tech’s AI revenue is accelerating, but free cash flow is moving sharply in the opposite direction. Across Google, Microsoft, Meta and Amazon, capex is rising much faster than operating cash flow a
Big Tech Earnings Preview: Is AI Monetization Finally Catching Up to Capex?
The most pronounced difference between 2026’s tech rally compared to rallies in the past is which companies have been left out of it. The names most associated with the AI trade have hardly participat
Nvidia, CXL, and the Battle to Improve AI Inference Economics
This is Part 2 of our two-part series on AI inference economics. In Part 1 — Why Nvidia's Next AI Battle Is About Tokens per Watt, we laid out why tokens per watt has become the defining metric for in
Why Nvidia’s Next AI Battle Is About Tokens per Watt
As hyperscalers move from building AI infrastructure to monetizing it, tokens per watt helps to reflect if revenue is scaling and if profitability is improving. Offload engines can increase tokens per

Micron Is Up 900%. Here’s Why the AI Memory Trade May Still Have Room to Run
Over the past 10 months, memory chip stocks have gone from being solid beneficiaries of the AI boom to capturing a massively outsized piece of the return pie. The inflection in Micron’s performance de

Why the S&P 500 Shrugged Off the Iran War — and What Could Finally Break the Rally
On February 28th, the U.S. went to war with Iran, and the market was handed the kind of shock it hasn't contended with for years. The conflict set off a chain reaction across the region: an ongoing su

Nvidia, CoreWeave, and Nebius: Inside the Circular Financing of the GPU Boom
Neoclouds are one of the more hotly debated AI business models, with CoreWeave and Nebius being the two most widely recognized names. These companies have seen their sales, backlog, and share prices s

AMD, Nvidia, Arm, Intel: Inside the $120 Billion CPU Gold Rush
CPUs have gone from an afterthought to becoming the AI trade’s next great bottleneck – and with AMD, Nvidia, Arm and Intel circling a market that is doubling nearly overnight, the only question left i
