Sentiment Puts a Floor Under this Dip
October 08, 2021

Knox Ridley
Portfolio Manager
For passive investors, this has been an easy year to be a bull. The market is up over 17% YTD in what is one of the lowest volatility years since 2017.
In 2017, we were in the first year of the Presidential Cycle, the market finished the year up over 19.4% without showing a single 5% dip. For comparison, the S&P 500, on average will experience a 10% or more correction almost every year, and has shown an average annual return over the last 30 years of 10.9%.
Similar to 2017, the S&P 500 is currently up just over 17% and has yet to provide a drawdown greater than 5%. However, unlike 2017, this year is not a broad market uptrend. In fact, the divergence we are seeing with a high number of stocks not participating in this year’s uptrend is important to note.
Big Tech Holds up a Weak Market (Again)
Please reference Knox’s previous analysis here: Upcoming Correction but Still a Bull Market

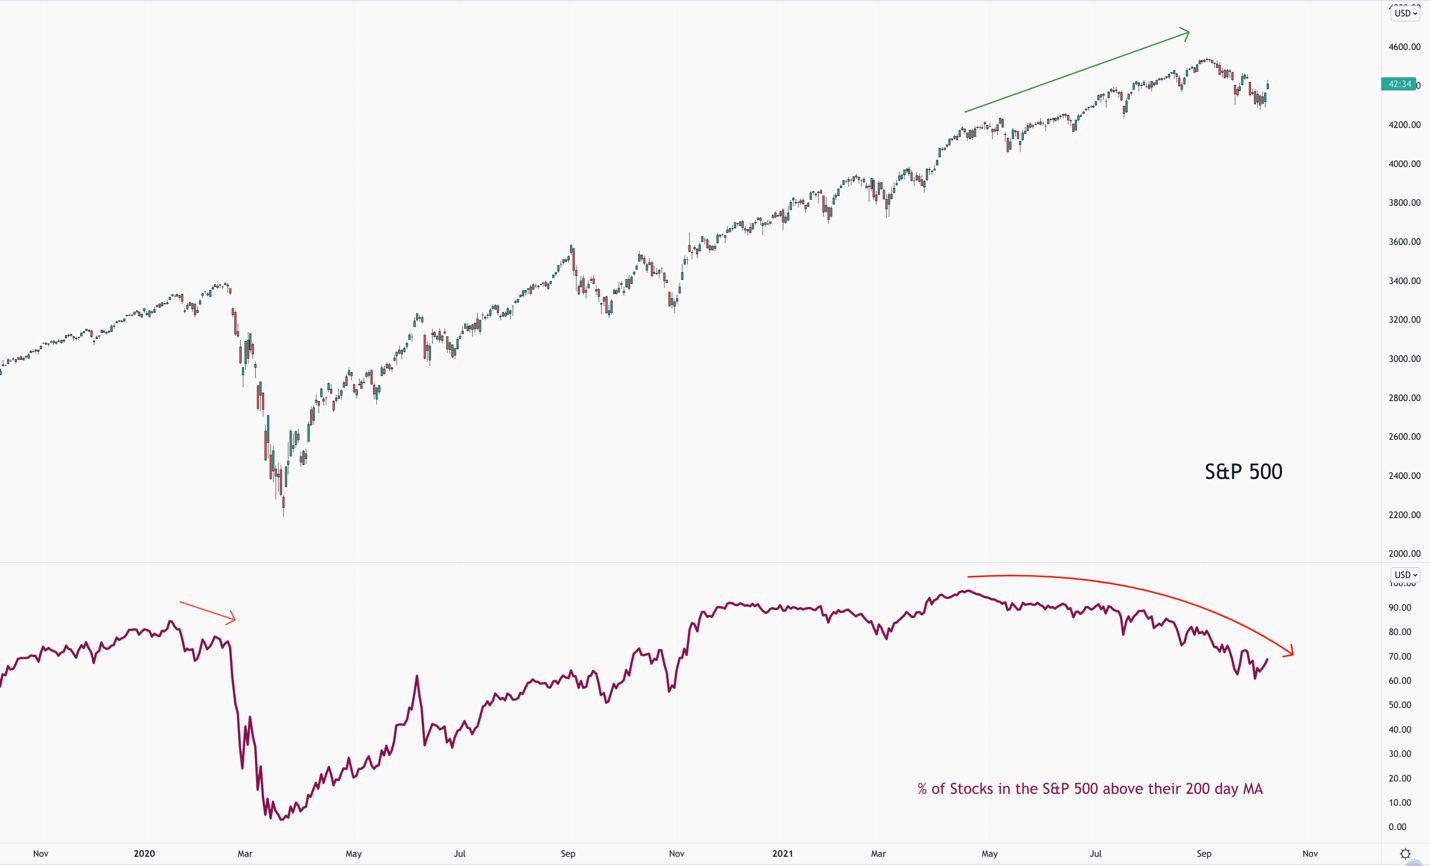
The above chart shows the price returns of the S&P 500 next to the percentage of stocks in the index that are above their Simple 200-Day Moving Average.
In a healthy market, the two graphs should be trending upward together, which would indicate more stocks across a wider variety of sectors are participating in the bull market. In an unhealthy market, we tend to see the majority of stocks in a downtrend, while the broad market keeps moving higher with narrower leadership. Note the pattern in 2020 – as the indexes makes a new high, the % of stocks above their 200-Day MA makes a lower high. This was a warning that the markets were weakening under the hood. Starting in March of this year the same divergence began, and is still playing out right now.
Sign up for I/O Fund's free newsletter with gains of up to 1100% - Click here
Because the weighting of the Index is market cap weighted, which is just price times float, it allows for narrow leadership to hold the market up while the underlying stocks move into a correction. As of now, nine of the top 10 names in the S&P500 are Big Tech. Collectively, they account for 25.18% of the entire index weighting. Some may view this concentration as a negative; however, this concentration in Big Tech is what has allowed for the underlying index to complete a covert and deep correction in 2021, without bringing the market down with it.
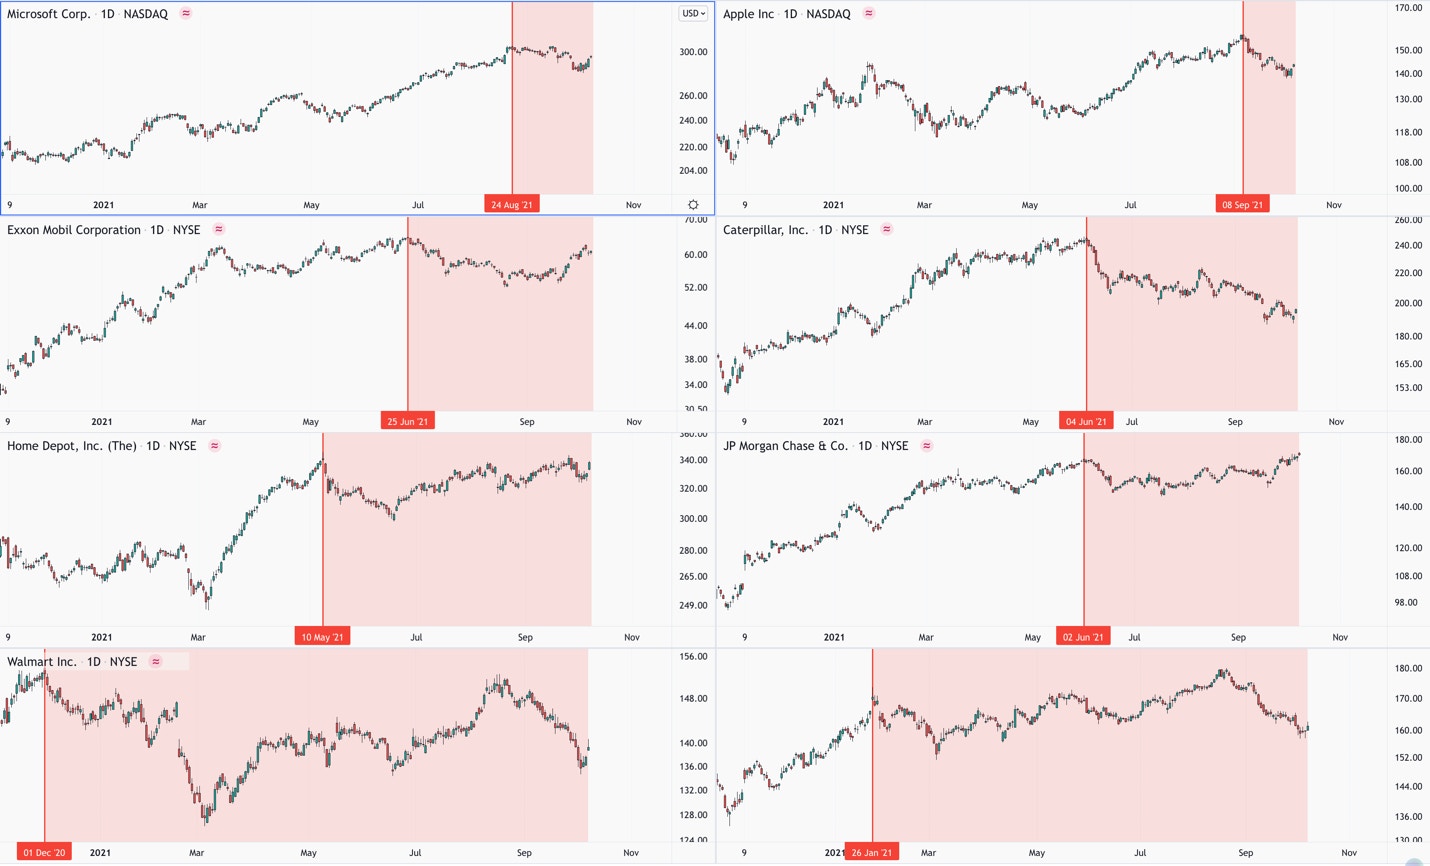
The above graph compares some of the most important companies in the US Economy since December of 2020 to now. The red area indicates when these names topped and began their corrections. Many names topped in Dec/Jan of last year while a number of names topped in May/June of this year.
The top row, Microsoft and Apple, collectively account for 11.8% of the S&P 500. The combined weighting of Exxon, Caterpillar, JP Morgan, Walmart, Home Depot and Johnson & Johnson is only 4.97%. This shows how major stocks, as well as multiple sectors, can be in a correction while just a handful of key names remain strong.
2021 Has Tested Even Seasoned Investors
The eye-opening consumer price index (CPI) numbers in February/March announced that inflation was potentially here. This led to the indiscriminate selling of risk-on assets, focused specifically in your high beta names that are priced with future cash flows in mind.
We saw this as a buying opportunity within a much larger uptrend, which we expressed both publicly and within our premium service. For one, the renewed uptrend within the bond market as well as a collapse in many commodity names was suggesting that inflation fears may be over blown. Also, the technical analysis work that we do on broad markets was further suggesting that we still had higher to go.
Over seven months after the growth sell-off, we still hold true to our original thesis.
We spoke in length about the M2 money supply and why it is key to measuring actual inflation in the economy here. In short, it is the layer of the money supply that filters into liquid assets like money market funds, savings accounts, CDs etc. This is the layer that the FED does not directly control, and it measures actual credit/money entering the economy.
Even with a 34% increase in the M2 money supply, we believe that the two one-time events of excessive global stimulus as well as the re-opening of global economies will likely outweigh the increase in M2 on a meaningful level. These are two extraordinary events that are not being factored into current CPI numbers. Inflation is likely here, as suggested by the increase in M2, however we do not believe that it will have a meaningful and immediate impact on the current bull market that is underway.
Last year was arguably one of the more extreme anomalies in market history, while this year is forcing investors to address the consequences of global policy decisions. Rising rates and commodity prices, coupled with an unexpected dovish FED, has affected growth in different ways.

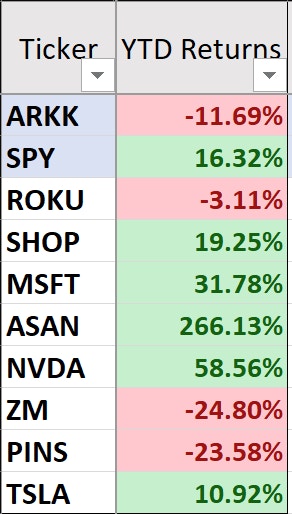
Many popular high fliers from last year, are negative for the year, as we see a rotation out of Covid names and primarily into tech stocks that surprise to the upside with strong fundamentals.
At I/O Fund, we raised cash going into the end of August due to the technical analysis that we perform on various broad market indexes. Our Elliott Wave work was suggesting that we were approaching a big top or minor top as the NASDAQ100 approached the 16000 level.
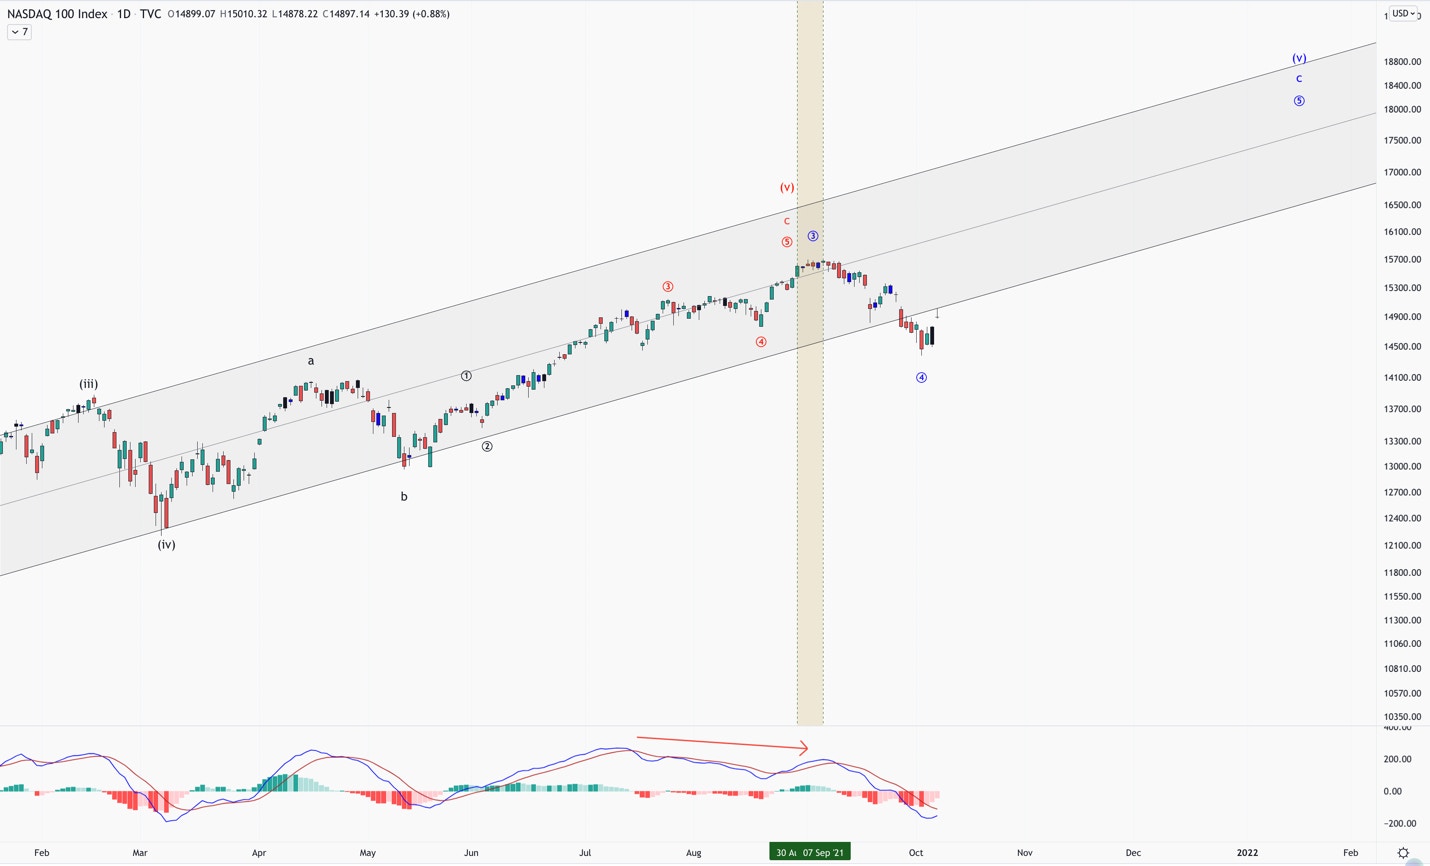
The above scenarios are what we based our broad risk management on in August. The red path had us topping in what would likely be a relatively deep correction, while the blue count had us only in a minor dip, which would be relatively brief. Keep in mind, both scenarios still had us in a much larger uptrend, which we see moving into 2022.
Through our cycle work, we had identified that Aug. 30 – Sept. 7 would likely mark an inflection point. This information coupled with fading momentum and a complete 5-wave pattern (in red), had us raise cash going into the inflection point.
In our August 19th report I stated that It’s my belief that the market is marching towards a large degree correction within a much larger uptrend. Whether that large degree correction has started or not will depend on what supports hold. Below is a visual of what I generally believe is playing out.” In other words, I was leaning towards the red count playing out, and so we prepared accordingly.
However, as we progressed in the initial dip, what had shift in real-time towards the more bullish blue count was a few data points. The primary one being sentiment, followed by seasonality trends and relative strength in key economically sensitive sectors. All of these data points were suggesting that a low was in, or at most, one more minor low was possible.
Sentiment
Implied Volatility vs. Realized Volatility
Prior to big unwinds in the market, we will typically see decelerating implied volatility while realized volatility starts ticking up. In short, sentiment is characterized by a belief that the bull market has much more room to go, which causes an increase in leveraged bullish bets.
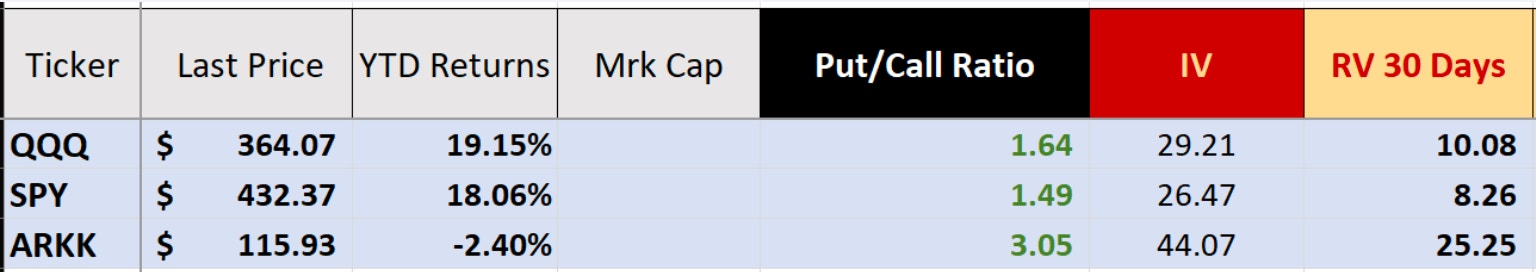
On September 9th, with the S&P 500 down just 1.1% from its high, we were seeing an unusually large separation from actual volatility over a 30-day period, and what investors were expecting within the next 30 days.

The S&P 500 had a low realized volatility of just 7.5% while the implied volatility was well over double at 18.12%. What this means is that investors were willing to pay high fees for downside protection before at the very beginning of this drawdown.
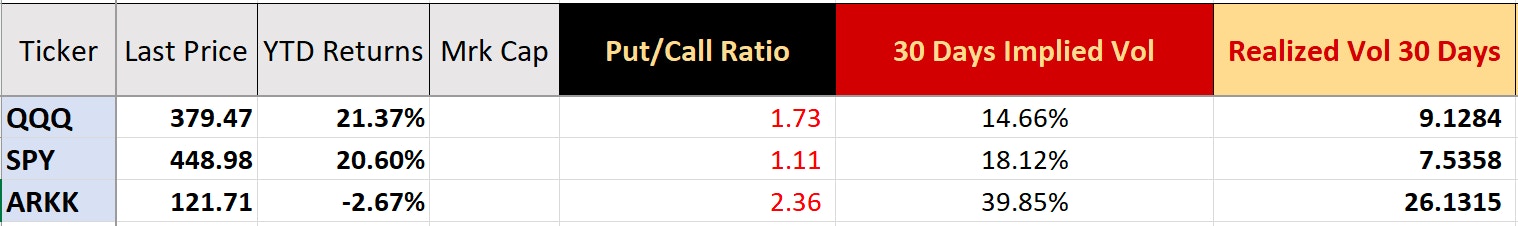
On Sept 20th, with the S&P 500 down just over 4% from its high, this trend intensified to an extreme we usually see at major bottoms.

The S&P 500 had over 200% gap between its 30-day realized volatility and the implied volatility going forward. In other words, the premium between what investors were expecting and what was going on had investors willing to pay anything for downside protection.
Put/Call Ratio vs Realized Volatility
Another way to view the unusual level of fear in the market surrounding the recent drawdown is in the Put/Call Ratio vs. Realized Volatility.

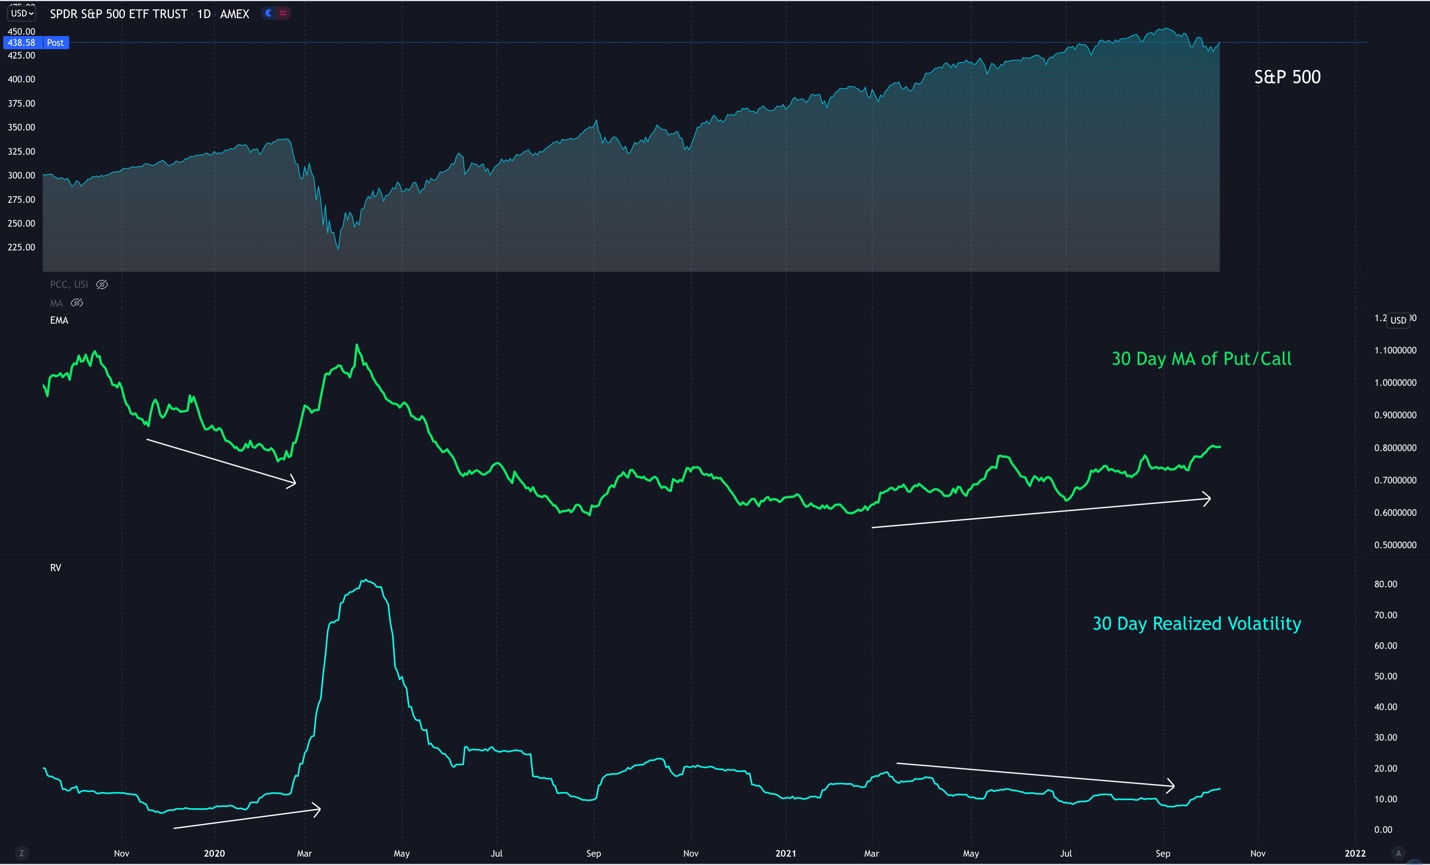
The above chart takes the 30-day moving average of the Put/Call Ratio (green) and compares it to the 30 realized volatility of the S&P 500 (Blue). Note the pattern going into the February bear market. As realized volatility was actually increasing, investors couldn’t buy enough calls compared to puts. This is the type of sentiment that usually results in overleveraged long bets, and the unwinding of this leverage is usually what fuels large drawdowns.
Sign up for I/O Fund's free newsletter with gains of up to 1100% - Click here
Compare that pattern to today. We are seeing the opposite unfold – as realized volatility continues to trend down, investors are buying more puts. This is signaling that sentiment is rather bearish to cautious as the market continues to climb higher in a low volatility environment.
The Importance of October
From our estimation, October should be strong. September is known as a seasonally weak period in the markets, while October is historically a strong month. This becomes evident when you look at the average monthly returns for the S&P 500 going back in time.

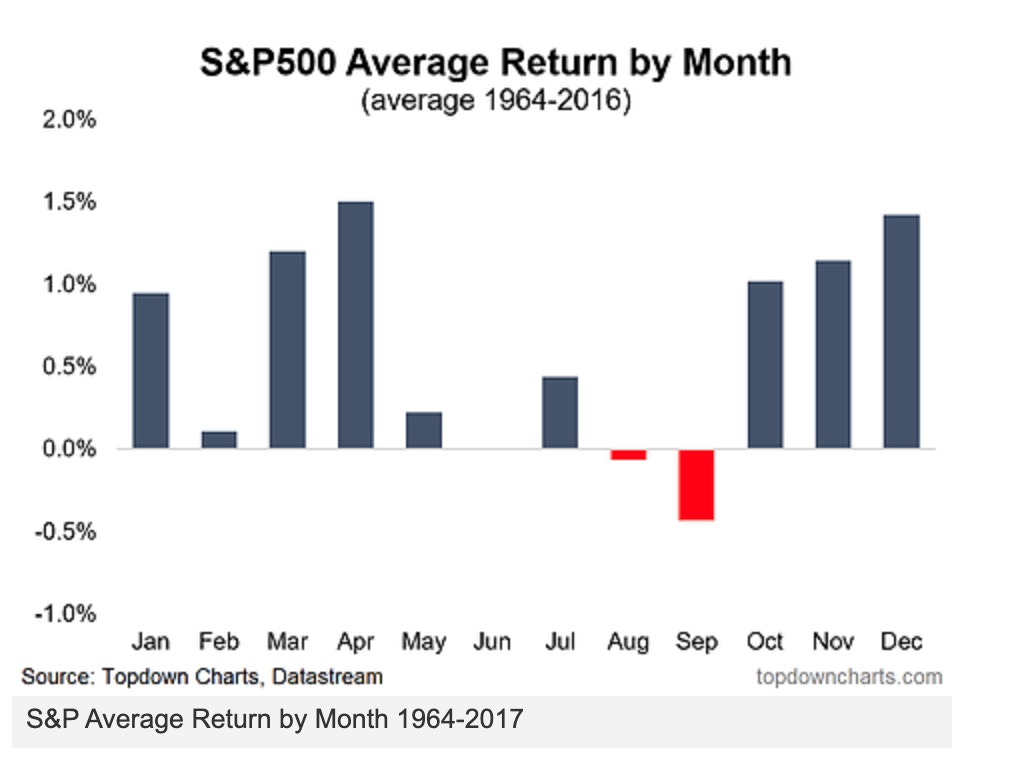
According to the same data, October has historically been a seasonally strong month. However, there is a caveat to how October tends to play out, and it is determined by how the market is trending into this month.
October has historically been a pivotal month in market history. We have seen an outsized number of major lows, and some major tops in the month of October.
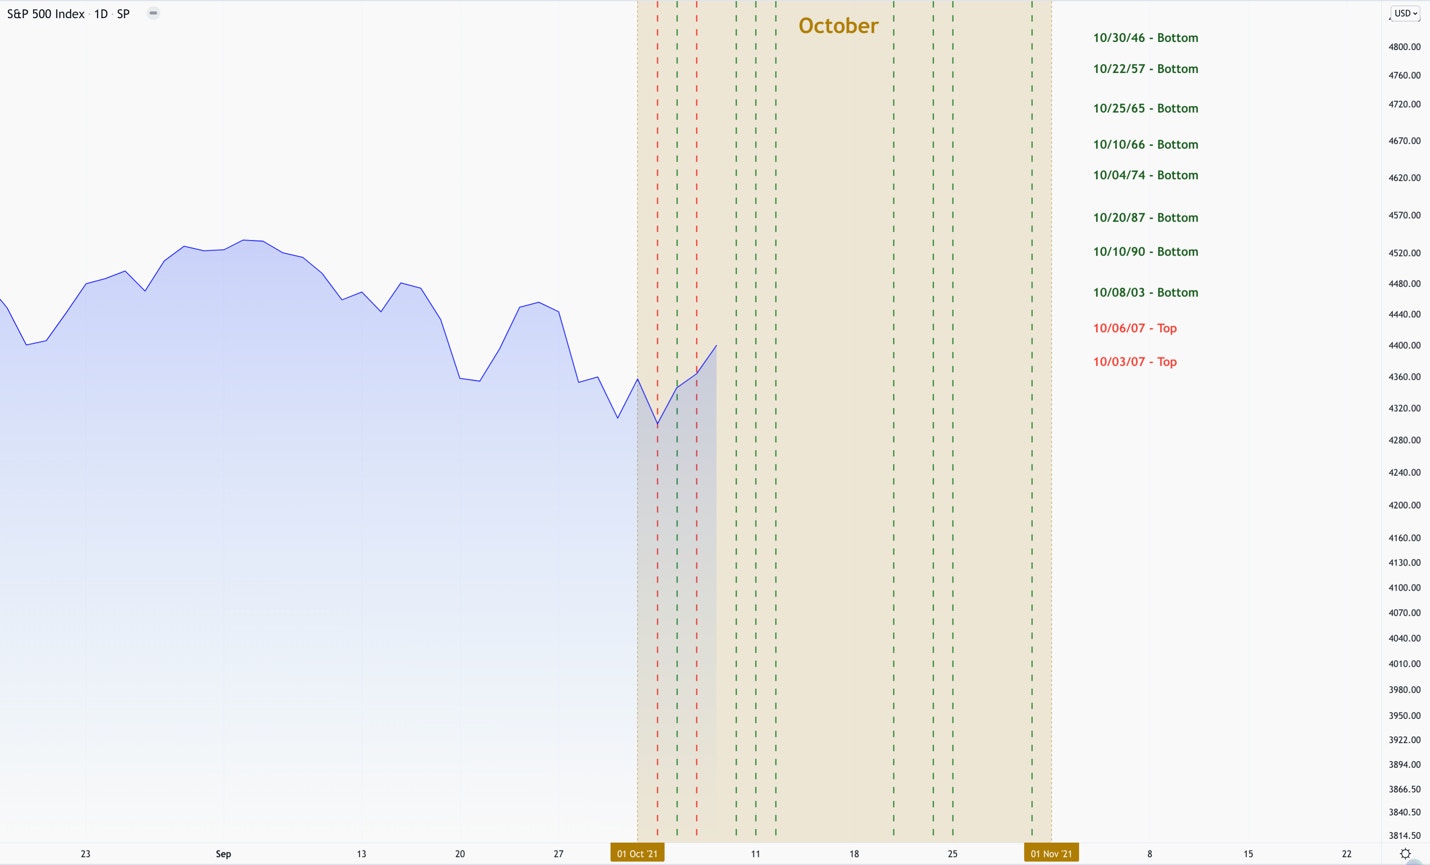
The above chart shows the history on major turning points within the month of October. We’ve had 8 bear market/deep corrections bottom in October with only two major tops occurring in the month of October. In other words, how a market is trending into October is a key factor to the year-end trend.
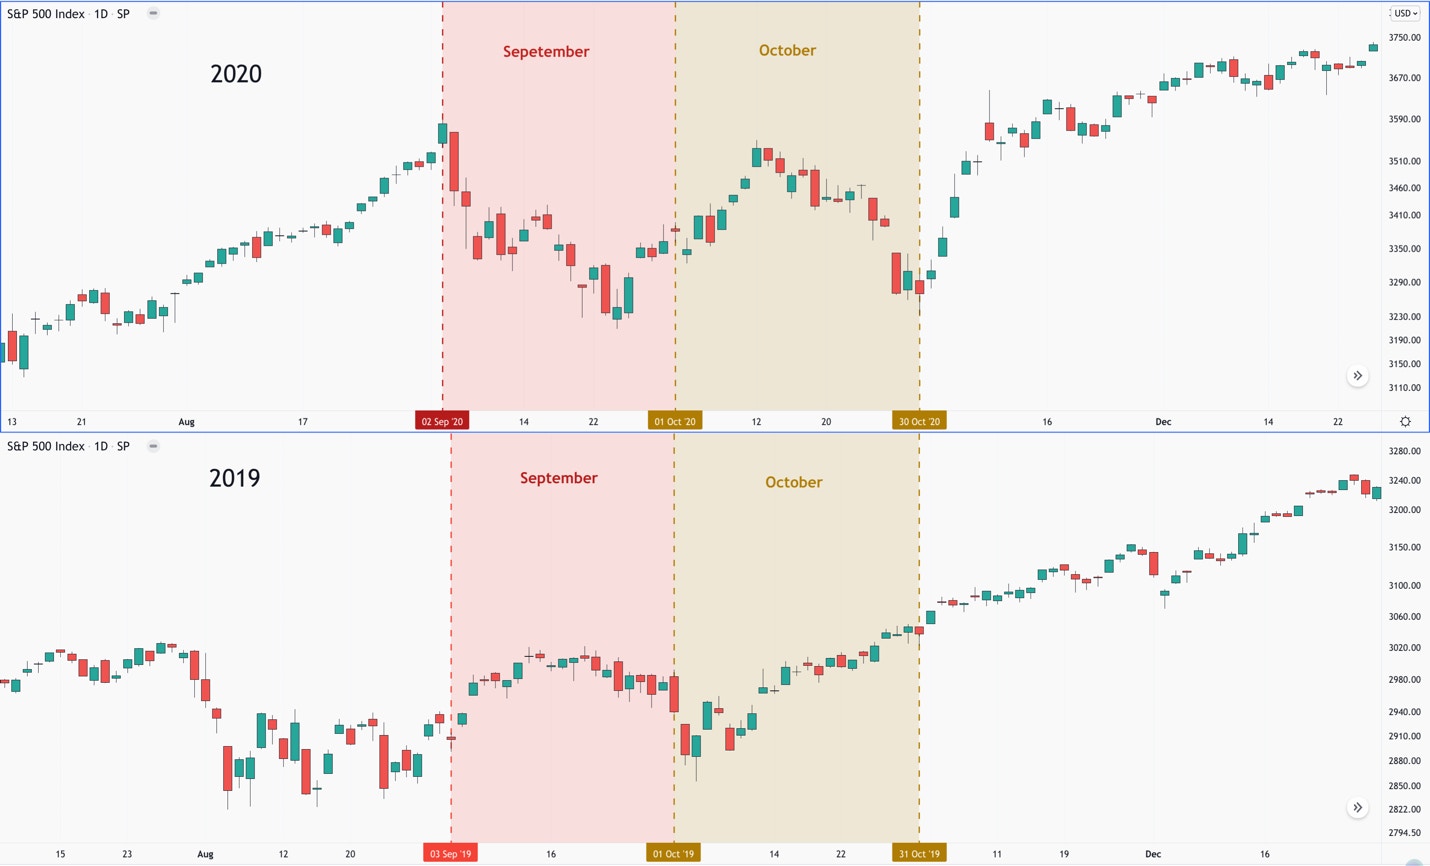
This pattern also seems to play out on smaller scales. In 2019 and in 2020, September proved to also be weak months. We then saw the market find a bottom in October, which led to a year-end rally.
Conclusion:
When you note seasonal trends and historic patterns, coupled with an unusual amount of negative sentiment and the recent relative strength in economically sensitive sectors, we believe a similar trend will unfold into year-end. For this reason, we have been accumulating high conviction names that are showing excellent relative strength. Many of these names are embedded in strong tech microtrends that we anticipate to continue into the foreseeable future.
Disclaimer: This is not financial advice. Please consult with your financial advisor in regards to any stocks you buy.


More To Explore
Newsletter

Token Growth is Surging - Here Are the Beneficiaries
The reality of AI demand growth has shattered early estimates for token processing, yet expectations continue moving up and to the right. In the second installment of our token processing series, we e

AI Token Demand is Shattering Forecasts
Total annual token processing is no longer measured in billions or trillions of tokens, but in the quadrillions and beyond. As annual token processing is now tracked in units with 15 trailing zeros, i

Nvidia and Google Are Crowding TSMC’s N3 Node - Can Intel Fill the Gap?
Nvidia is moving its next-generation Rubin GPUs from 4nm to 3nm, yet Google’s latest TPUs are already on N3 and are expected to remain there. Meanwhile, a growing number of AI CPUs from Nvidia, Amazon
Intel vs TSMC: How CoWoS Packaging Constraints Could Create an Opportunity for Intel Foundry
Taiwan Semiconductor (TSMC) is the single, most important company to the AI industry. However, to compete with the incumbent, Intel does not need to beat TSMC at leading-edge manufacturing. It only ne
Big Tech’s Free Cash Flow is Turning Negative – Who's Next?
Big Tech’s AI revenue is accelerating, but free cash flow is moving sharply in the opposite direction. Across Google, Microsoft, Meta and Amazon, capex is rising much faster than operating cash flow a
Big Tech Earnings Preview: Is AI Monetization Finally Catching Up to Capex?
The most pronounced difference between 2026’s tech rally compared to rallies in the past is which companies have been left out of it. The names most associated with the AI trade have hardly participat

Nvidia, CXL, and the Battle to Improve AI Inference Economics
This is Part 2 of our two-part series on AI inference economics. In Part 1 — Why Nvidia's Next AI Battle Is About Tokens per Watt, we laid out why tokens per watt has become the defining metric for in

Why Nvidia’s Next AI Battle Is About Tokens per Watt
As hyperscalers move from building AI infrastructure to monetizing it, tokens per watt helps to reflect if revenue is scaling and if profitability is improving. Offload engines can increase tokens per

Micron Is Up 900%. Here’s Why the AI Memory Trade May Still Have Room to Run
Over the past 10 months, memory chip stocks have gone from being solid beneficiaries of the AI boom to capturing a massively outsized piece of the return pie. The inflection in Micron’s performance de

Why the S&P 500 Shrugged Off the Iran War — and What Could Finally Break the Rally
On February 28th, the U.S. went to war with Iran, and the market was handed the kind of shock it hasn't contended with for years. The conflict set off a chain reaction across the region: an ongoing su
