AMD Stock is Approaching a 20 Year Roadblock – Will History Repeat?
December 04, 2019

Knox Ridley
Portfolio Manager
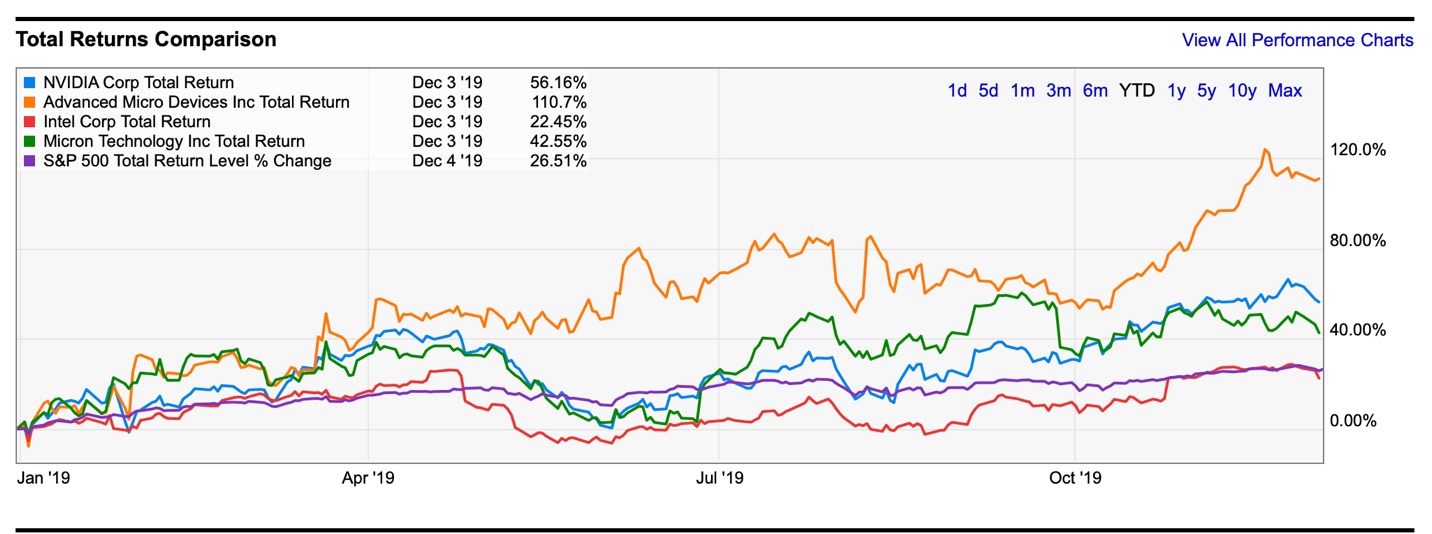
Advanced Micro Devices (AMD)’s stock price is up by 108% this year, making it the best-performing company in the S&P 500 this year. Its closest peer has been Nvidia, whose stock has climbed by 56%. Other peers like Intel, Broadcom, and Taiwan Semiconductor have gained by 22%, 24%, and 48% respectively year-to-date. As a result, AMD has helped power the Fidelity Select Semiconductors (FSELX), which has risen 48% this year, and the PHLX Semiconductor Sector Index (SOX), up 46% this year.

The main justification for the surge in AMD’s stock price is that the company is successfully taking market share from Intel – and to some extent, Nvidia. Since 2017, Intel has lost 10% of its PC CPU market share and 5% server market share to AMD.
Higher PC and graphics chips helped drive the most recent quarter’s performance, yet AMD’s strategy in the CPU-powered cloud-data center segment as the company takes on juggernaut-Intel is especially promising.
In the most-recent quarter, AMD reported revenue of $1.8 billion, which is the company’s highest quarterly sales in more than a decade. Revenue missed by $1 million on an expected $1.81 billion while the company met EPS forecasts of $0.18 EPS. Management guided fourth-quarter revenue of $2.05 billion to $2.15 billion, while analysts had forecast revenue of $2.15 billion. Factoring the past three quarters means that the company will likely generate $6.4 to $6.7 billion in revenue this year. This will be slightly flat from the $6.47 billion that was generated a year ago.
Also Read : Alteryx Stock Price
The issue is that the recent AMD share price surge and subsequent valuation multiples see it as a growth company. It has a one-year forward PE ratio of 36, compared to Nvidia’s 30, Taiwan Semiconductor at 20, and Broadcom at 12. Historically, the S&P 500 has an average forward PE ratio of 15. The current PE ratio for the AMD is 206, nearly 5x higher than Broadcom at 45, nearly 4x higher than Nvidia’s at 55 and an astonishing 8x higher than Taiwan’s current PE ratio at 25.
Meanwhile, AMD’s YoY revenue growth same quarter is at 8.95% and will be 52% growth YoY same-quarter Q4, if the company comes in at the $2.15 billion. (Hence the popularity of the stock and cyclical nature of semiconductors). YTD growth is around 20%, which is similar to Broadcom.
AMD’s fundamental story lies within the company’s margins, which historically, have been very low, and are impacted by average sales price (ASP), cost per unit and volume. The company’s trailing EBITDA margin of 8.35% is below that of peers mentioned above. However, over this past year, AMD’s non-GAAP margins have expanded even as revenue declined.
Intel, on the other hand, saw non-GAAP margins fall YoY. This helps support the bull case that AMD’s earnings are growing even while experiencing flattened revenue, and the company has forward-looking potential.
The main challenge with AMD’s current share price is market exuberance over the company’s rebound from the lowered guidance in July. In the technical analysis below, we attempt to reveal just how stretched AMD is, to make the case that now might be the time to take profits, or wait for confirmation if you are looking for an entry.
AMD’s Stock Price: Technical Analysis

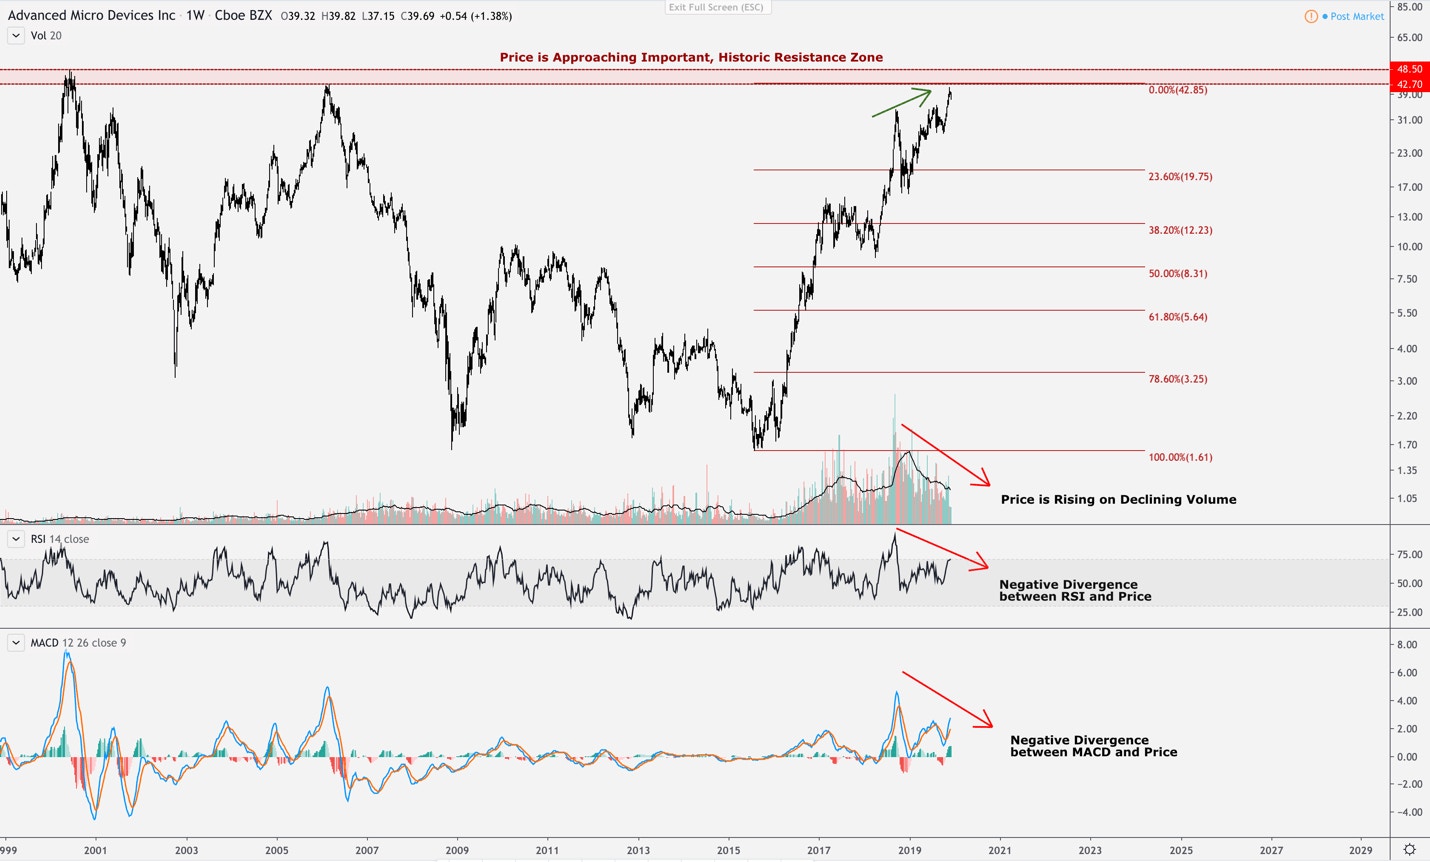
Price is approaching a resistance zone that AMD has failed to break through twice over the prior 2 decades – once in the year 2000 and then again in 2006.
Regarding resistance and supports, the longer the region has held the more important it becomes. Also, the severity of the correction from the price region usually dictates the importance of the region as well. In other words, AMD has failed to breakthrough twice over a 20-year period at this region, and what followed these failed breakouts was two drawdowns greater than 90%. Therefore, this price zone is important for AMD to break through.
Notably, the short interest in AMD is currently around 11%, which is high. So, if AMD can break through this region, it will force shorts to cover, accelerating the price even higher. However, if AMD cannot breakthrough this zone, a healthy correction should be expected. History doesn’t always repeat, but it can rhyme, and a mere retrace to the 23.6% Fibonacci retrace level, a mild correction compared to the uptrend we’ve seen in AMD since 2016, would constitute around a 50% drawdown.
Also Read : Roku’s Stock Price
AMD Stock Price: RSI and MACD
There is negative divergence between the RSI and MACD making lower highs while the price of AMD is making higher highs. The price is thus moving up while the buying pressure is fading. This is typically a sign of a fading rally and suggests a pullback is on the horizon. Furthermore, the price is rising on decreasing volume as well, suggesting that not many investors are buying at current prices.
This divergence is not only happening in AMD’s price, but across the Semis that are trading in the U.S.

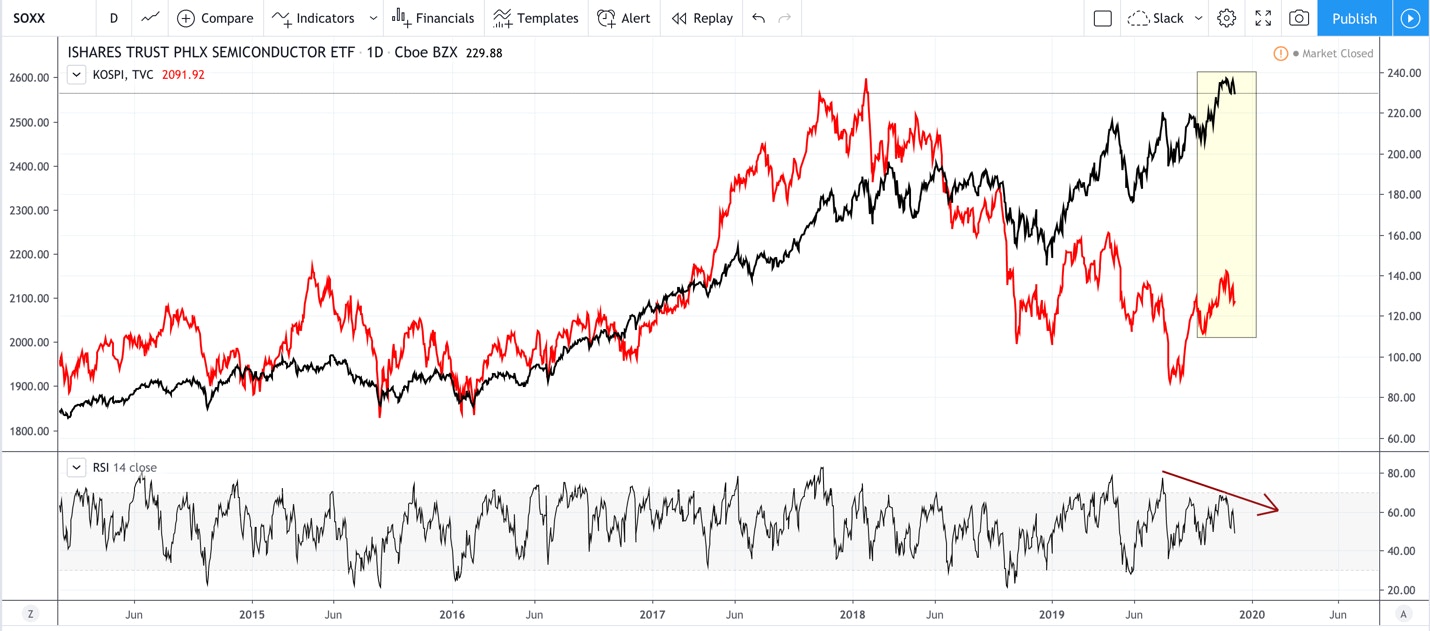
The above chart is showing the Philadelphia Semiconductor Index (SOXX) compared to the South Korean Kospi Index. South Korea is an economy that is fueled by some of the world’s largest semi-conductor companies, as well as many mid-level players. Companies such as Samsung, and SK Hynix supplied over 60% of the components used in memory chips sold globally in 2018.
Therefore, the KOSPI provides important information about the global health of semiconductors. As you can see, these indexes are historically closely correlated. Today, we are seeing a very wide divergence between the U.S. semiconductor index and the KOSPI, which is unusual. This suggests that either the PHLX or the KOSPI will need to make a move to realign. My best guess based on the evidence is the U.S. semiconductors will point downward soon.
Regarding AMD, the volume suggests buyers are drying up at current prices, which makes sense considering the overhead resistance, fundamental outlook and global slow down. If I were long, I’d be looking to take profits at current prices, or at minimum buy insurance through a put.


More To Explore
Newsletter

Nvidia, CXL, and the Battle to Improve AI Inference Economics
This is Part 2 of our two-part series on AI inference economics. In Part 1 — Why Nvidia's Next AI Battle Is About Tokens per Watt, we laid out why tokens per watt has become the defining metric for in

Why Nvidia’s Next AI Battle Is About Tokens per Watt
As hyperscalers move from building AI infrastructure to monetizing it, tokens per watt helps to reflect if revenue is scaling and if profitability is improving. Offload engines can increase tokens per

Micron Is Up 900%. Here’s Why the AI Memory Trade May Still Have Room to Run
Over the past 10 months, memory chip stocks have gone from being solid beneficiaries of the AI boom to capturing a massively outsized piece of the return pie. The inflection in Micron’s performance de
Why the S&P 500 Shrugged Off the Iran War — and What Could Finally Break the Rally
On February 28th, the U.S. went to war with Iran, and the market was handed the kind of shock it hasn't contended with for years. The conflict set off a chain reaction across the region: an ongoing su
Nvidia, CoreWeave, and Nebius: Inside the Circular Financing of the GPU Boom
Neoclouds are one of the more hotly debated AI business models, with CoreWeave and Nebius being the two most widely recognized names. These companies have seen their sales, backlog, and share prices s
AMD, Nvidia, Arm, Intel: Inside the $120 Billion CPU Gold Rush
CPUs have gone from an afterthought to becoming the AI trade’s next great bottleneck – and with AMD, Nvidia, Arm and Intel circling a market that is doubling nearly overnight, the only question left i

Google TPU v8 vs Nvidia: How Inference Is Rewriting the AI Market
In April, Google announced it would begin selling its TPUs to select third-party data center operators, which is something the market has anticipated for nearly a decade. The TPU-versus-Nvidia-GPU deb

The AI Networking Stock That Beat Nvidia by 7X YTD for Returns of 135% YTD
AI networking stock Lumentum is among the key I/O Fund winners in 2026. We allocated heavily to LITE in January—a month before Nvidia backed the company. While most investors couldn’t stomach taking a

Bloom Energy — Our 2026 Top Pick Was the Best Performing Stock in April
April was the best month in six years for the Nasdaq-100. The single best-performing large-cap stock wasn't Nvidia, Microsoft, or Meta. It was Bloom Energy, up roughly 109% in one month. As you'll rec

Inside Nvidia’s $4B Optical Strategy—and Why CPO Changes Everything
Within the AI investment theme, there is nowhere that the supply chain shifts faster than in networking, leading companies to gain content on new platforms or lose incremental share. The reason is str
