Blogs -I/O Fund Q3 2021 Cloud Stock Earnings Preview – December Edition

I/O Fund Q3 2021 Cloud Stock Earnings Preview – December Edition


November 25, 2021

author

I/O Fund

Team

Tech earnings season is long and extends over six weeks. We are finally nearing the end of Q3 earnings season as the last round of cloud companies are expected to report in early December. The I/O Fund had previously highlighted Six Cloud Stocks to Watch During Q3 Earnings, all of which have since reported Q3 results.

One of the notable performers we highlighted was Bill.com, which reported an 11% topline beat during the quarter. I/O Fund analyst Bradley Cipriano discussed the company’s strong Q3 results in a short video presentation here.   

In the analysis that follows, we provide an update on the cloud category and review cloud stocks that have yet to report Q3 earnings. We also discuss key metrics that investors should be aware of heading into the final weeks of Q3 earnings season.

Cloud Stocks: Top 10 EV/FWD Revenue Multiples

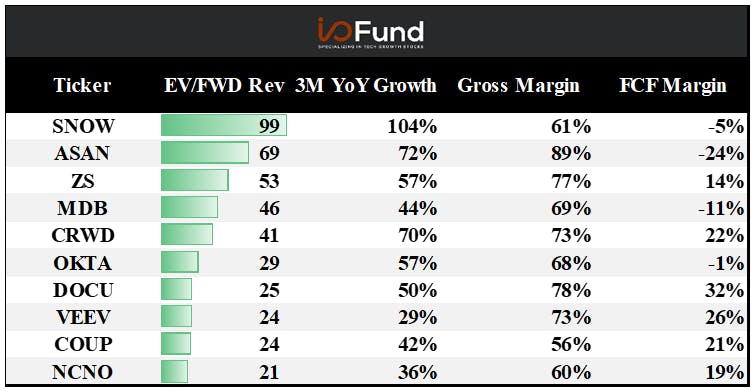
Below is a table of cloud stocks that have yet to report Q3 results, ranked by their EV/FWD sales multiples. Snowflake has the richest multiple out of the 26 remaining cloud stocks set to report in the next few weeks. As we mentioned in our initial Q3 Cloud Earnings Overview, Snowflake is benefitting from increasing rates of data consumption, a trend that will likely continue into the future.

Somewhat cheaper than Snowflake but still sporting a premium multiple are Asana, Zscaler, and MongoDB. Asana most recently grew 72% YoY, an acceleration from the 61% and 57% YoY growth rate in Q2 and Q1, respectively. Zscaler sales grew over 55% for three consecutive quarters and sales are expected to grow 50% in the upcoming quarter. MongoDB has reported an acceleration in sales for three consecutive quarters, and the most recent 44% YoY growth was the fastest pace of growth since Q1 2020. These strong growth trends help illustrate why these firms have premium valuations.
https://images.prismic.io/bethtechnology/13a86116-1ae4-46f1-a8a1-cd16c8b43584_io-fund-q3-2021-cloud-stock-revenue-multiples.png?auto=compress,format

Cloud Stocks: Top 10 Three-Month Forward YoY Growth Rates

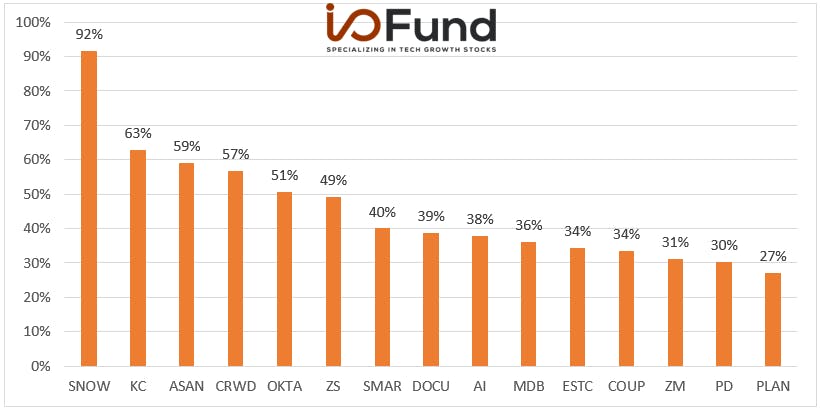
Below is a chart of forward sales growth expectations.
https://images.prismic.io/bethtechnology/b0a369d3-e7dc-486a-a952-2413735b98ca_io-fund-q3-2021-cloud-stock-yoy-growth-rates.png?auto=compress,format

Out of the remaining cloud stocks that must report Q3 earnings, Snowflake and Kingsoft are expected to grow the fastest. Snowflake is expected to grow sales 92% YoY as the company continues to benefit from rising rates of data consumption.

Chinese cloud infrastructure company, Kingsoft, is also expected to grow sales strongly in Q3 as they quickly scale their operations.

Sign up for I/O Fund's free newsletter with gains of up to 1100% - Click here

Other noteworthy mentions are CrowdStrike, Okta, and Zscaler, all of which have exposure to cyber security, a sector that has seen outsized growth recently. These three cyber security firms are expected to grow sales ~50% YoY heading into Q3 earnings, highlighting the overall strength in the cyber security market.

Top 10 Weekly Share Price Movements

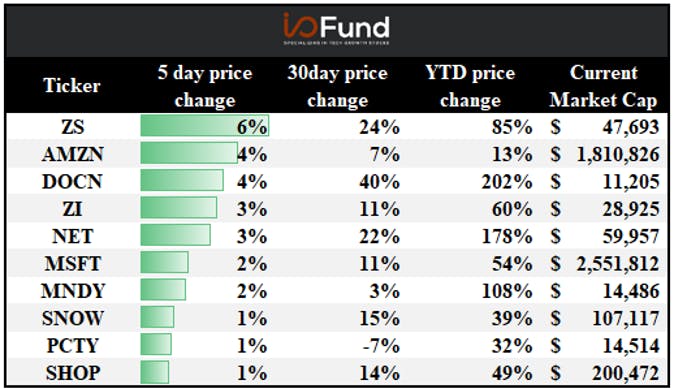
Below is a table of the weekly change in share price for our universe of cloud stocks (week ended 11/19). Zscaler is a notable stand out and increased 6% during the week. It is up 85% YTD. Out of the 26 cloud stocks that have yet to report Q3 earnings, Zscaler and Snowflake were the only stocks that advanced last week.
https://images.prismic.io/bethtechnology/6c5aabde-f023-421d-8061-081ad5139493_io-fund-q3-2021-cloud-stock-weekly-share-price.png?auto=compress,format

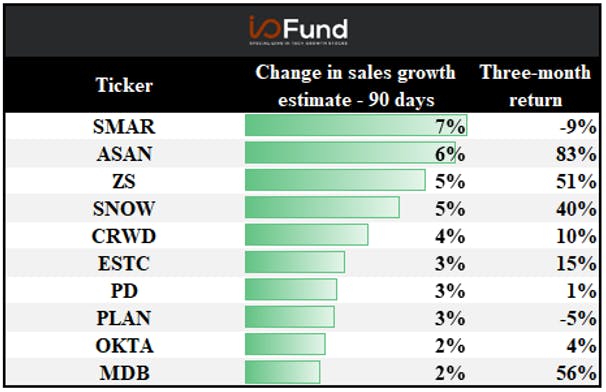
Top 10 Changes in Sales Growth Estimates – Last 90 Days

The table below ranks cloud companies that have yet to report Q3 earnings by their topline revisions over the last 90 days. An increase in topline revisions signals that the Street believes that the company will grow faster than initially believed.

Smartsheet (SMAR) has had the largest topline revision, as the company recently increased their Q3 sales guidance from 40% YoY growth to 46% YoY growth, citing a robust demand environment for its platform.

Zscaler also had its topline revisions increase 5% over the last 90 days, above other cyber security players such as CrowdStrike and Okta. This increase in expectations signals that Zscaler is likely expected to outperform its peers in the near term.
 

https://images.prismic.io/bethtechnology/f838a743-9a2b-4fdf-a683-e928721c622f_io-fund-q3-2021-cloud-stock-sales-growth.png?auto=compress,format

Update on Top 5 EV/Fwd Revenue Multiples:

Overall stats:

  • Overall Cloud forward median:    15x
  • Top 5 Cloud forward median:       69x
  • Overall Cloud forward average:  22x

OVERVIEW OF EV/FWD SALES:

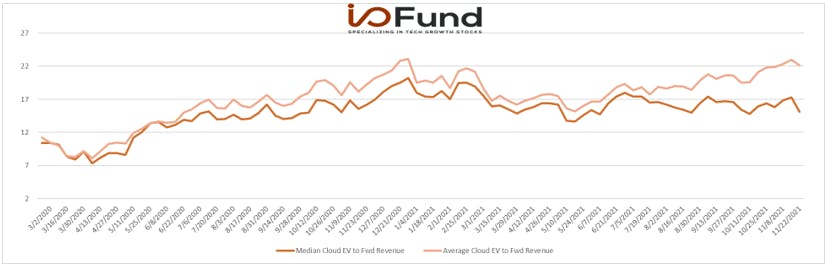
As shown below, the median and average cloud EV/Fwd revenue multiple has trended up throughout the year. Around June, the average multiple had started to increase faster than the median, and this bifurcation accelerated during Q3 earnings.

The average is being driven higher by premium valued cloud stocks (shown above). Since cloud has increasingly proven to be a sector where the leader ‘wins most’, this bifurcating trend may very well continue into the future.  


https://images.prismic.io/bethtechnology/aac74075-9490-4dc4-9acc-743c551ac90a_io-fund-q3-2021-cloud-stock-ev-fwd-sales.png?auto=compress,format

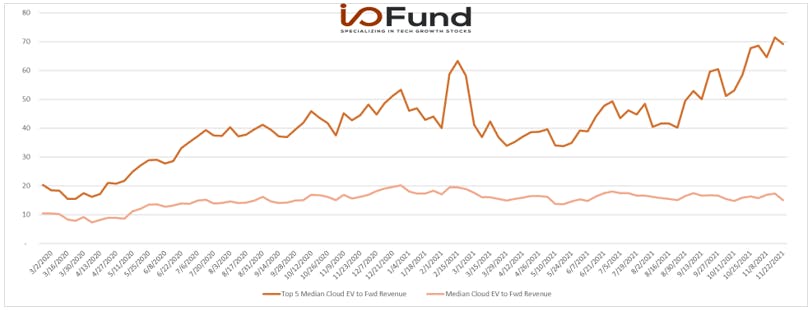
TOP 5 HIGH-RANKING EV/FWD SALES:

In the chart below, we can more clearly see the large dispersion in cloud valuations, as the top 5 premium valued cloud stocks have had their EV/Fwd sales multiples rapidly expand through Q3 earnings. Investors likely continue to believe that cloud is a “winner gets most” market, where the market leader captures the majority of the addressable market. This dynamic helps explain why the top 5 valued cloud stocks have grown their multiples much faster than the median.

https://images.prismic.io/bethtechnology/947c2a2c-ebfc-4d4d-b739-f20d4f2a36c2_io-fund-q3-2021-cloud-stock-high-ranking-ev-fwd-sales.png?auto=compress,format

EV TO FWD SALES - Growth Buckets:

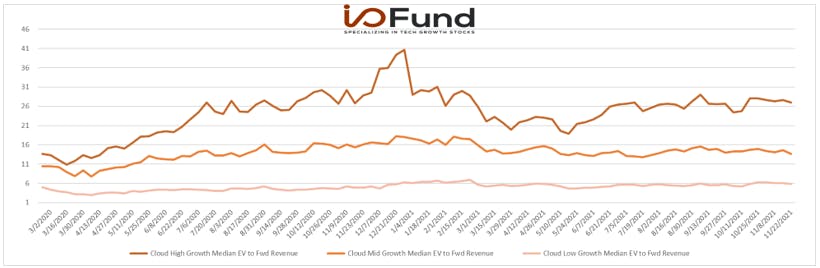
We can further dissect the changes in cloud valuations by breaking up the group into high growth (>30% growth), mid growth (>15% and <30%), and low growth (<15%). The below chart shows that higher growth cloud stocks receive a higher multiple from the Street. Furthermore, high growth stocks used to be valued more richly back in Q4 2020 but have since seen their valuations normalize to a lower multiple. If Q3 cloud earnings come in strong, then the market may push valuations back up to their historic highs.  

https://images.prismic.io/bethtechnology/334d253a-dde1-4e85-8744-6746577c37d0_io-fund-q3-2021-cloud-stock-growth-buckets.png?auto=compress,format

WHO DELIVERS SUPERIOR EV TO FWD SALES?

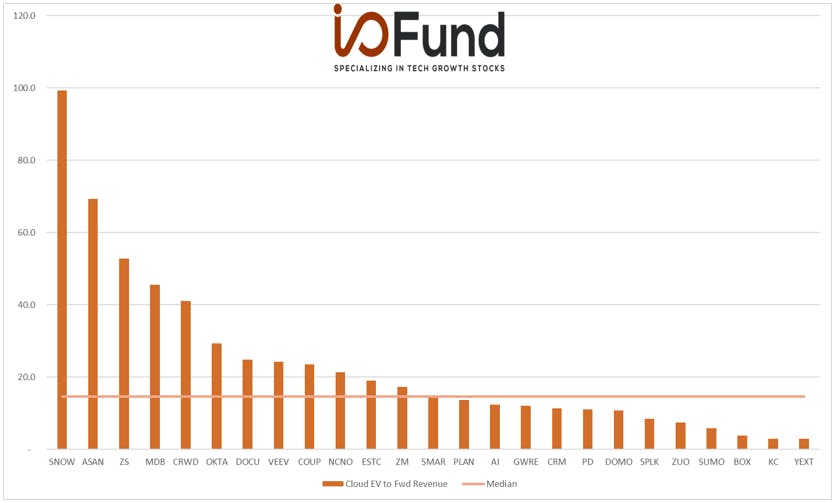
The below chart provides a more holistic view of the remaining cloud stocks that have yet to report Q3 results, sorted by their EV to Fwd revenue multiples.

https://images.prismic.io/bethtechnology/f0bad0fa-fd9d-4bc0-b04f-57baf9c5a04d_io-fund-q3-2021-cloud-stock-superior-ev-fwd-sales.png?auto=compress,format

As highlighted in the above tables, Snowflake (SNOW) has the highest valuation of the group and its multiple is more than 600% higher than the cloud median of 15x.

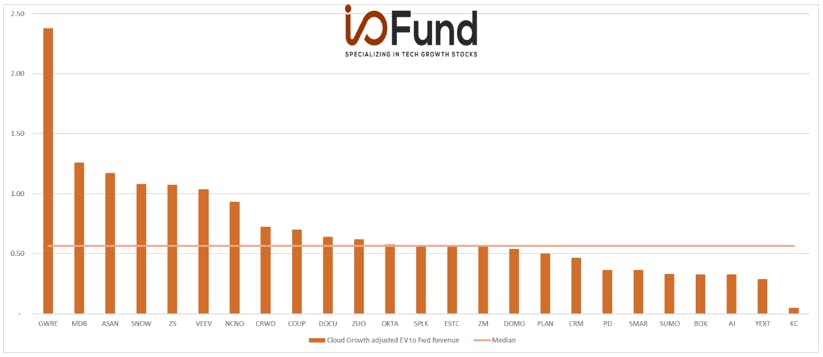
Growth Adjusted EV/Fwd Revenue (EV/Fwd Rev/Fwd Growth)

The last chart (below) is based on EV to FWD sales but also takes into account forward growth expectations.

By scaling valuation relative to forward growth, we can more clearly see which companies are cheapest, based on their expected growth rate. A low value in the chart below means that a company is cheap relative to growth.

For example, Snowflake can be considered cheaper than Asana once we consider its strong growth rate expected next quarter.

Kingsoft (KC) is evaluated as the cheapest; given its robust growth rate and low valuation, the company has very low margins, which warrants a cheaper valuation.


https://images.prismic.io/bethtechnology/349074cc-57b9-444e-a5c5-5e56b9b17892_io-fund-q3-2021-cloud-stock-growth-adjusted-ev-fwd.png?auto=compress,format

CLOUD OUTLOOK

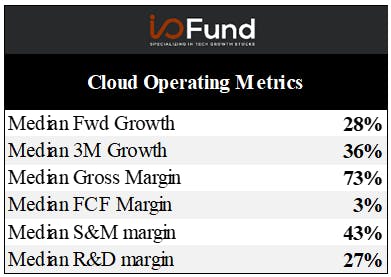
Finally, the last table we will be discussing includes aggregate cloud operating metrics.

The below table shows that cloud is performing strongly as the median forward growth rate is above 20%, while gross margins are high at over 70%. The median cloud company is also FCF positive with a 3% FCF margin.

https://images.prismic.io/bethtechnology/434f3c9b-6de5-4a86-a8b6-298fefb05312_io-fund-q3-2021-cloud-outlook.png?auto=compress,format


Strong growth and positive cashflows signal that the cloud category is healthy and performing well. I/O Fund expects this strength to progress going forward.

Find out which cloud stocks I/O Fund will be watching, heading into the final weeks of Q3 earnings, in analyst Royston Roche’s piece, “I/O Fund’s Q3 Earnings Preview of Cloud Stocks -December Edition.

I/O Fund is comprised of a team of analysts who share their research publicly as they build a portfolio of 30 stocks. Our team has record results for a retail Fund and we also have four-digit gains on some of our free newsletter coverage. You can learn more about our premium service by clicking here or sign up for our free newsletter here.

Disclaimer: This is not financial advice. Please consult with your financial advisor in regards to any stocks you buy.

head bg

More To Explore

Newsletter

Data center illustration showing Google, Microsoft, Meta, and Amazon with AI revenue and capex spending trends. Capex spending rises faster than AI revenue between 2021 and 2026.

Big Tech’s AI Revenue Is Surging, but Suppliers Will Still Be the Bigger Winners 

Big Tech’s AI Capex has stomped estimates for multiple years and analysts are now calling for capex to surge to $1 trillion in 2027. However, hyperscalers have long battled investor concerns around wh

August 06, 2026
Futuristic AI data center filled with server racks and glowing network pathways, representing large-scale AI infrastructure investment and rising capital expenditures to meet growing demand.

AI Capex to Hit $1 Trillion – And Estimates Are Still Too Low

Big Tech capex is the driving force behind the AI infrastructure trade, yet Wall Street has repeatedly underestimated the sheer scale of the buildout. Currently, in 2026, the guidance for $732.5 billi

August 05, 2026
Abstract illustration of layered AI computing hardware processing digital tokens, symbols, and data streams representing AI infrastructure and inference demand growth.

Token Growth is Surging - Here Are the Beneficiaries 

The reality of AI demand growth has shattered early estimates for token processing, yet expectations continue moving up and to the right. In the second installment of our token processing series, we e

July 31, 2026
Abstract visualization of a flowing stream of digital tokens, numbers, and symbols representing AI token processing and inference demand growth.

AI Token Demand is Shattering Forecasts 

Total annual token processing is no longer measured in billions or trillions of tokens, but in the quadrillions and beyond. As annual token processing is now tracked in units with 15 trailing zeros, i

July 30, 2026
TSMC N3 wafer technology connected to Intel EMIB advanced packaging in an AI semiconductor manufacturing graphic.

Nvidia and Google Are Crowding TSMC’s N3 Node - Can Intel Fill the Gap?

Nvidia is moving its next-generation Rubin GPUs from 4nm to 3nm, yet Google’s latest TPUs are already on N3 and are expected to remain there. Meanwhile, a growing number of AI CPUs from Nvidia, Amazon

July 26, 2026
Illustration of Intel EMIB-T advanced packaging connecting AI compute dies and HBM memory as an alternative to TSMC CoWoS.

Intel vs TSMC: How CoWoS Packaging Constraints Could Create an Opportunity for Intel Foundry 

Taiwan Semiconductor (TSMC) is the single, most important company to the AI industry. However, to compete with the incumbent, Intel does not need to beat TSMC at leading-edge manufacturing. It only ne

July 24, 2026
Amazon, Meta, Microsoft, and Google displayed with financial charts, illustrating rising AI capex and growing free cash flow pressure across Big Tech.

Big Tech’s Free Cash Flow is Turning Negative – Who's Next? 

Big Tech’s AI revenue is accelerating, but free cash flow is moving sharply in the opposite direction. Across Google, Microsoft, Meta and Amazon, capex is rising much faster than operating cash flow a

July 19, 2026
Illustration of Google, Microsoft, Meta, and Amazon stock dashboards against a digital circuit-board background, symbolizing Big Tech earnings, AI growth, and investor performance.

Big Tech Earnings Preview: Is AI Monetization Finally Catching Up to Capex?

The most pronounced difference between 2026’s tech rally compared to rallies in the past is which companies have been left out of it. The names most associated with the AI trade have hardly participat

July 17, 2026
Side-by-side image of an NVIDIA CMX server and a CXL memory expansion card against a data center background.

Nvidia, CXL, and the Battle to Improve AI Inference Economics

This is Part 2 of our two-part series on AI inference economics. In Part 1 — Why Nvidia's Next AI Battle Is About Tokens per Watt, we laid out why tokens per watt has become the defining metric for in

July 12, 2026
NVIDIA BlueField networking platform card shown on a green digital network background.

Why Nvidia’s Next AI Battle Is About Tokens per Watt 

As hyperscalers move from building AI infrastructure to monetizing it, tokens per watt helps to reflect if revenue is scaling and if profitability is improving. Offload engines can increase tokens per

July 10, 2026
newsletter

Sign up for Analysis on
the Best Tech Stocks


Copyright © 2010 - 2026