Apple Vs. The FAANGs (Technical Analysis)
July 18, 2022

Knox Ridley
Portfolio Manager
Apple Inc. (NASDAQ:AAPL) became the most valuable company in the world through creating and dominating the smart phone/mobile microtrend. As the majority of the global community went from zero smart phones to it becoming a necessity in their lives, Apple became the most valuable company in the world. However, like all trends, eventually it reaches the point of saturation. Instead of hypergrowth, we see competitors fight over existing customers on lower cost goods as revenue growth moves into a more consistent yet slower rate of change.
Apple epitomizes what it means to be both a good value stock and a good tech stock with its strong margins, outsized cash flows, stable balance sheet, and a loyal base of customers supporting the brand.
Apple has been very consistent with its margins and cash flows. The company's operating margin of 30.82% and the net profit margin of 25.71% are excellent, while most tech companies are currently struggling with the bottom line. It also has an outstanding free cash flow margin of 26.37%. The company has also been shareholder-friendly since it consistently repurchases shares.
We have not owned Apple because it is simply not involved in any of the new tech microtrends that will likely give us the next Google (GOOG, GOOGL), Apple, or Amazon (AMZN). However, this does not mean that Apple does not deserve a place within a portfolio.
Apple is an outsized beneficiary to passive investing. For those that do not want to pick stocks, and instead just own the index, Apple takes up the largest portion of this money. For example, if you don't want to own tech companies and instead want simply exposure through Technology Select Sector SPDR ETF (XLK), 23.47% of that money goes to Apple.
In regards to the S&P 500, which is the most passively owned index through various mutual funds and ETFs, Apple currently takes up 6.85% of the weighting in the S&P 500, and therefore gets 6.85% of funds going into the S&P 500. This is more than UnitedHealth Group, Berkshire Hathaway (BRK.A, BRK.B), Johnson & Johnson (JNJ), Nvidia (NVDA), and Exxon (XOM) combined!
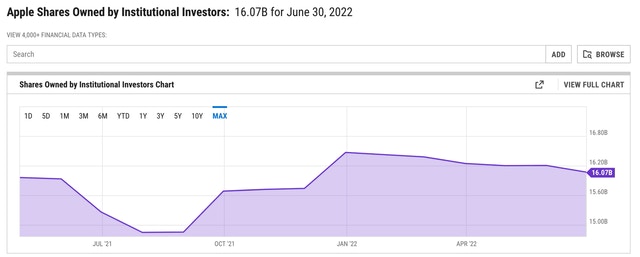
Because of how its history of share buybacks, healthy Free Cash Flow, and its very large market cap, it remains a darling within institutional funds that are managing billions. In fact, as of June 30th, 16.07 billion shares outstanding are owned by institutions. This means that roughly 98% of all shares outstanding are owned by institutions.

Even though it is not in the forefront of AI, Machine Learning, Cloud or Big Data, it is uniquely setup to capture an outsized portion of passive investors' funds as well as institutional funds. Therefore, it is difficult to imagine the broad markets making new highs without Apple.
Technically, Apple has exhibited a level of relative strength in this bounce that is what you want to see in confirming a broad market trend reversal. It has reclaimed the $145 resistance level, which is a key supply zone to take back. Whether it will hold it is the question?

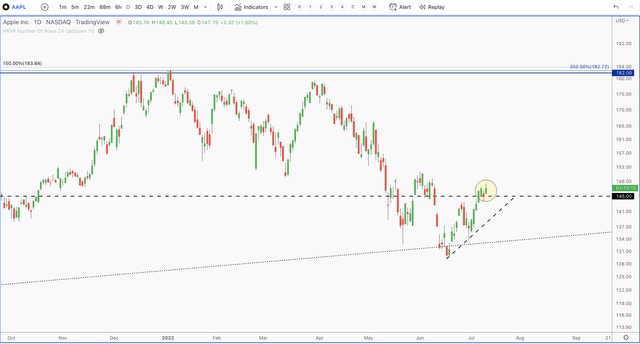
The fact that Apple has reclaimed the $145 level is a show of strength, regardless of the weakness in the momentum. If the other FAANGs were showing the level of strength APPL is right now by reclaiming key resistance levels, that would be encouraging that a meaningful low is underway. However, we are just not seeing that right now.
We recently wrote about how Google (Alphabet) is our second favorite FAANG. In a cookie-less world due to Apple's notable change to its IDFA, owners of 1st party data, like Google, are setting themselves up to further dominate. This catalyst, coupled with its positioning within the AI microtrend, is the reason why it reserves a position within our portfolio.
Sign up for I/O Fund's free newsletter with gains of up to 403% - Click here
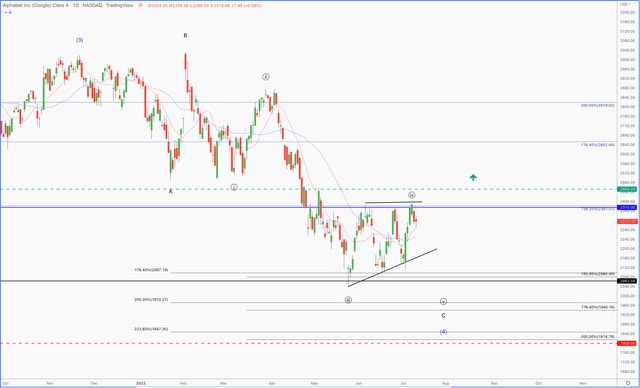
This also lines up with the technical chart on a long-term basis. Google is the healthiest chart amongst the FAANGs, as it is comfortably above its critical support zone at $1800. As long as any additional weakness is seen here, above this critical support suggests that GOOGL is one of the FAANGs that is likely to make a new high.
However, over the next month, it appears that Google is tracing a bear flag pattern. This is a common pattern that we see in 4th waves, which suggests we need one more wave to complete the 5 wave pattern in Google's drawdown.

Netflix
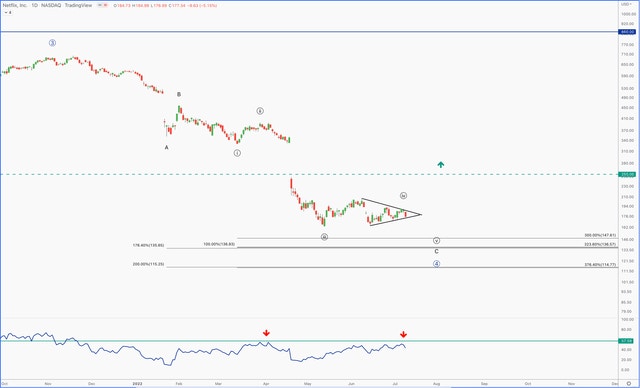
NFLX is another FAANG that we believe has a higher probability of making a new high in the next growth cycle than most believe. While market was focused on NFLX reporting a subscriber miss of 200,000, it failed to recognize that NFLX is on track to monetize around 100 million new subscribers who are sneaking onto the platform through shared passwords. We wrote about this extensively in a recently report, and as a result has entered into our matrix of potential positions to own going into the next growth cycle.
We believe NFLX is undervalued based on where this monetization will take its revenue in the coming quarters, and this is showing up in the chart on a long-term basis. However, over the next month, Netflix looks to be tracing a bear pennant pattern/triangle pattern. These are common in 4th waves, suggesting one more push lower to complete the drawdown.
Microsoft
Microsoft (MSFT) is one of the FAAMGs that we believe will continue to exhibit dominance into future tech trends. It is one of the leaders in the on-going cloud trend, and is also setting itself up to lead in edge computing and machine learning. We believe Microsoft has multiple catalysts to maintain its growth, which is why we own it within our portfolio.
We think Microsoft is the best risk/reward mega-cap tech stock due to its firm foundation in the cloud and its diversified cloud products. It's also positioned for outsized growth due to its exposure to secular tailwinds such as Artificial Intelligence (AI), Machine Learning (ML), and the build out of the 5G network edge. We think Microsoft will take a substantial share of these markets at the infrastructure level due to its relationships with the Fortune 500 and Global Fortune 2000.
The company's business relationships with Fortune 500 companies, brand image, and wide user base are the moats that will help the company drive revenues in the hybrid cloud, machine learning, and artificial intelligence segments. Microsoft Azure is used by more than 95% of the Fortune 500 companies, which shows the company's dominance across enterprises.
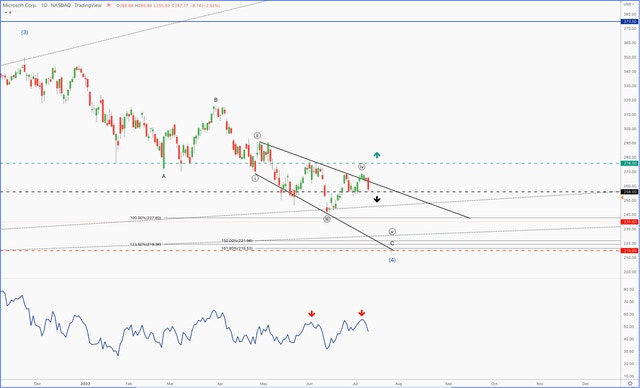
This is also present within the long-term chart of Microsoft, as it is another FAANG that has a high probability of making a new high in the next growth cycle. As long as it critical support holds at $215, this will remain our primary outlook. However, like the rest of the FAANGs, it looks like it is setting up for one more push lower before we can start looking up.
Amazon
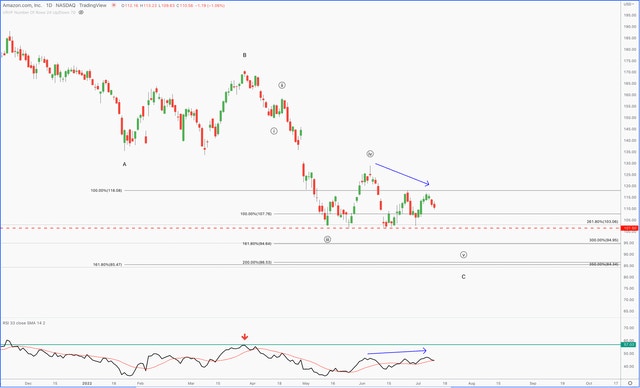
Amazon also looks ready to break the $101.50 support zone in what looks like a 4th wave top. The RSI continues to fail under the key bear market resistance at 57. We also have a confirmed Negative RSI Reversal Signal, which is when the RSI makes a higher high while price makes a lower high. This is happening well underneath the bear market resistance of 57 on the RSI. The odds favor one more push lower.
Meta
Meta Platforms (META) is the one stock within the FAANGs that has a high probability of not seeing new highs in the next growth cycle. Fundamentally, the effects of Apple's changes to IDFA has finally caught up with META. We have been warning about this shift in META since early 2020. In short, Audience Network is what allowed META to become the advertising behemoth that it is. Not only was META capturing 1st party data through Facebook, but Audience Network allowed it to capture a large portion of 3rd party data.
Sign up for I/O Fund's free newsletter with gains of up to 403% - Click here
We had also said back in 2018 that we think Audience Network contributed $5 Billion to $10 Billion in ad revenue (the third-party data ad exchange FB uses). Three years later, that's what Facebook stated in their February 2nd earrings call - "we believe the impact of iOS overall as a headwind on our business in 2022 is on the order of $10 billion."
Simply put, the metaverse is simply not big enough to fill this revenue gap. This is showing up in the chart of META. For one, we have a confirmed 5 wave drop from the all-time high. For one, note how the 3rd wave, which is the most powerful move in a trend, happened on peak volume and peak momentum. This is because traders/investors realized that they are on the wrong side of the herd. They sell at any price, creating an intense moment of sentiment. The 5th waves are always on weaker volume and momentum, which is what we are seeing. Here, the shorts always press their luck, exhausting sellers for this move down.

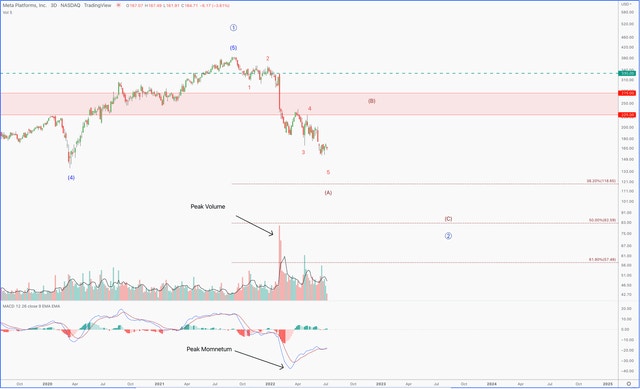
Why this is significant is that the only corrective pattern that starts with 5 waves down is a Zig-Zag pattern. This is 5 waves down, a 3 wave retrace that fails around half way, then another 5 wave pattern down to new lows. If accurate, the next growth cycle will have META making a move back towards $225-$275 before failing.
For this to invalidate, META must reclaim the $330 resistance zone. This is unlikely due to the fundamental problems META now faces.
In conclusion, there are simply too many divergences between Apple's strength and the rest of the FAANGs to signal a meaningful low is in. I think the odds are high that we at least attempt a double bottom, if not a push towards 3500 SPX before we can start looking up. I do believe that if we do see a push to new lows, it will likely be the 5th wave in this correction. So, it should be on weaker momentum and less volume than prior moves. If so, we will continue to add to beaten down tech stocks that primed to become the next FAANGs.
Please note: The I/O Fund conducts research and draws conclusions for the Fund’s positions. We then share that information with our readers. This is not a guarantee of a stock’s performance. Please consult your personal financial advisor before buying any stock in the companies mentioned in this analysis.


More To Explore
Newsletter

Nvidia and Google Are Crowding TSMC’s N3 Node - Can Intel Fill the Gap?
Nvidia is moving its next-generation Rubin GPUs from 4nm to 3nm, yet Google’s latest TPUs are already on N3 and are expected to remain there. Meanwhile, a growing number of AI CPUs from Nvidia, Amazon

Intel vs TSMC: How CoWoS Packaging Constraints Could Create an Opportunity for Intel Foundry
Taiwan Semiconductor (TSMC) is the single, most important company to the AI industry. However, to compete with the incumbent, Intel does not need to beat TSMC at leading-edge manufacturing. It only ne

Big Tech’s Free Cash Flow is Turning Negative – Who's Next?
Big Tech’s AI revenue is accelerating, but free cash flow is moving sharply in the opposite direction. Across Google, Microsoft, Meta and Amazon, capex is rising much faster than operating cash flow a
Big Tech Earnings Preview: Is AI Monetization Finally Catching Up to Capex?
The most pronounced difference between 2026’s tech rally compared to rallies in the past is which companies have been left out of it. The names most associated with the AI trade have hardly participat
Nvidia, CXL, and the Battle to Improve AI Inference Economics
This is Part 2 of our two-part series on AI inference economics. In Part 1 — Why Nvidia's Next AI Battle Is About Tokens per Watt, we laid out why tokens per watt has become the defining metric for in
Why Nvidia’s Next AI Battle Is About Tokens per Watt
As hyperscalers move from building AI infrastructure to monetizing it, tokens per watt helps to reflect if revenue is scaling and if profitability is improving. Offload engines can increase tokens per

Micron Is Up 900%. Here’s Why the AI Memory Trade May Still Have Room to Run
Over the past 10 months, memory chip stocks have gone from being solid beneficiaries of the AI boom to capturing a massively outsized piece of the return pie. The inflection in Micron’s performance de

Why the S&P 500 Shrugged Off the Iran War — and What Could Finally Break the Rally
On February 28th, the U.S. went to war with Iran, and the market was handed the kind of shock it hasn't contended with for years. The conflict set off a chain reaction across the region: an ongoing su

Nvidia, CoreWeave, and Nebius: Inside the Circular Financing of the GPU Boom
Neoclouds are one of the more hotly debated AI business models, with CoreWeave and Nebius being the two most widely recognized names. These companies have seen their sales, backlog, and share prices s

AMD, Nvidia, Arm, Intel: Inside the $120 Billion CPU Gold Rush
CPUs have gone from an afterthought to becoming the AI trade’s next great bottleneck – and with AMD, Nvidia, Arm and Intel circling a market that is doubling nearly overnight, the only question left i
