Can Uber Become Profitable This Year? Deep-Dive Analysis
April 15, 2020

Beth Kindig
Lead Tech Analyst

This article was originally published on Forbes on Mar 25, 2020,09:10am EDT
Uber burns over $4 billion annually yet the company is stating it will be profitable by the end of 2020.
Further analysis is required to look deeper into whether Uber is able to accomplish what it has promised or if the company is buying time and appealing for a more promising valuation before it has to raise more cash. The latter is something Uber is incredibly skilled at as the company now trades well below its last private valuation of $76 billion with a current market cap of $35 billion.
Despite the coronavirus causing the company to cut back operations nation-wide with declines of up to 80% in ride-sharing volume, Uber is receiving analyst upgrades based on the company’s variable cost structure. These analyst upgrades come despite slowing growth and $7 billion in debt on the balance sheet while being deeply unprofitable with record-setting adjusted net losses of $4 billion in 2019.
The overall financial performance defies the CEO’s statements, which are based on a single non-GAAP reporting measure “Rides Adjusted EBITDA.” This non-GAAP reporting measure is new to Uber as of Q3 2019 and replaces the less favorable contribution margin.
Overview of Uber:
Uber’s revenue in the fourth quarter of 2019 grew 37% to $4.07 billion. However, it reported a net loss of -$1.1 billion compared to a net loss of -$887 million in the same period last year. EPS was negative -$0.49 compared to -$0.52 expected.
Full-year 2019 revenue grew 26% to $14.1 billion and net loss was -$8.5 billion compared to a net profit of $997 million for 2018. Stock-based compensation was $4.6 billion in 2019 for a net loss of $4.1 billion and adjusted EBITDA of negative -$2.73 billion.
Notably, Uber sold some operations in Russia and Asia, which provided one-time income, and caused the company to post the $1 billion in net income in 2018. In 2017, Uber posted similar losses at $4 billion.
Monthly Active Users (MAU) increased 22% to 111 million in the fourth quarter of 2019 helping to boost the company’s revenues. The Uber Eats promotional expenses continue to drag the company’s profits despite being the segment with the most growth.
Earlier this year, the company sold its food-ordering business in India to a local company Zomato in exchange for a stake in the company.
Uber investors are encouraged by the non-GAAP Rides Adjusted EBITDA metric, which breaks out the profitability of Uber’s ridesharing business separate from Uber Eats and other bets, such as autonomous vehicles. Uber reported a 281% increase in Rides Adjusted EBITDA from $195 million to $742 million in Q4 and a 34% increase from $1.54 billion to $2.07 billion in full year 2019. The company’s overall EBITDA margin is -57.58% compared to the sector median of 12.99%.
The company stated on a recent call to investors that they have $10 billion in unrestricted cash. Uber carries long-term debt of $5.7 billion and a capital lease obligation of $1.5 billion, or about $7 billion total in obligations. Despite the combination of steep losses and ample debt, the CEO stated the balance sheet is “incredibly strong” due to the absence of short-term debt.
There is clearly a sharp contrast between the financials and the CEO’s statements, which means Uber has a lot to accomplish this year in the face of coronavirus shutdowns.
Analysis of Adjusted Rides EBITDA:
Uber has been opportunistic in breaking out adjusted EBITDA for rides as a means for reaching profitability. In the 10Q details, Uber does not break out the number of ridesharing trips and monthly active users separately from Uber Eats and Freight although there is a statement in the summary that Gross Bookings grew 20% and Eats grew 73% year-over-year.
Gross Bookings is defined as “the total dollar value” including taxes, tolls, fees and without an adjustment for consumer discounts and refunds. Essentially, Gross Bookings is similar to Ride Revenue, the metric that Lyft reports. Uber’s Gross Bookings growth is actually quite low at 20% compared to Lyft’s Ride Revenue at 52%.
Some of Uber’s weaknesses and risks are known to the market. This is one reason the price-to-sales ratio is very low at 2.3 with a forward price to sales of 1.7. Compare this to other companies that went public last year, such as Zoom Video with price to sales of 53 and a forward price to sales of 39, or Slack with a price to sales of 17 and a forward price to sales of 14.
Uber may look attractive to some investors at this current valuation given the risks. However, this is a company that is far from true profitability across all revenue segments.
Subsidies Inflate Demand
I’ve been critical of the ride-sharing business model since pre-IPO when the media speculated Uber would reach $100 per share.
The problem with the ridesharing business model is that the more money the business makes, the more the business loses. This is reflected in the past three years of financials between 2017-2019. Essentially, Uber and Lyft used private funding to subsidize rideshare demand in the year leading up to their public filings.
In 2017, Reuters published that Uber passengers pay only 41% of the actual cost of their trips, citing research from transportation consultant Hubert Horan. At the time, Reuters warned that this creates an “artificial signal about the size of the market” after Uber had released limited financial data as a private company that showed losses of $708 million per quarter.
The cost of the ride is not high enough to cover the cost of the ride, therefore, we see unusual losses. However, if the companies raise prices, demand will decrease. These companies must chose between subpar growth in order to become profitable or subpar earnings in order to drive demand.
The markets did not reward Uber for driving demand at the expense of its bottom line. Instead, Uber became the biggest IPO loss in history. Uber is attempting a new path, which is to pare back on losses while accepting lower demand and revenue at 20%. This is most evident in the
The problem with this scenario is that the market may not like slowing growth either. In fact, we see “Trips” growing 32% year-over-year, which is much lower than the 100% growth reported in the S-1 Filing when trips had doubled from 5 billion trips in September of 2017 to 10 billion trips in September of 2018. (Revenue should be aligned with number of trips, and also doubled, unless subsidies were very steep.)
It’s also important to note that Uber removed the original non-GAAP measurement “Contribution Profit (Loss)” and replaced it with Adjusted Rides EBITDA. This is because the Contribution Margin was too revealing of Uber’s losses with a declining rate from 14.7% in Q2 2018 to 8.2% in Q2 2019.

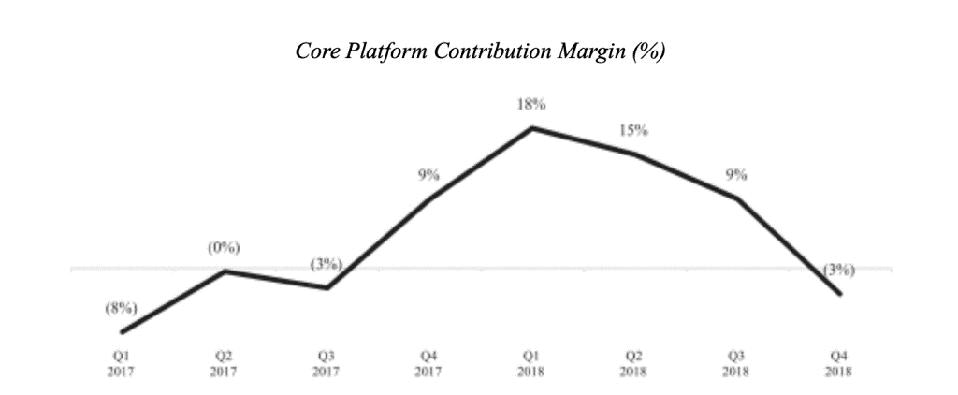
In an effort to appear profitable in the ridesharing segment, Uber has stopped reporting on contribution margin. - UBER
Lyft: Pureplay Model
Lyft provides a model for a pureplay ridesharing company with a reported 52% year-on-year increase in its fourth-quarter 2019 revenue to $1.01 billion up from $669 million. This is much higher growth than the 20% Uber reported for its ridesharing segment.
For the full-year 2019, revenues increased 68% year-over-year to $3.6 billion
Net loss increased to $356 million from a net loss of $248.9 million in the same period last year, yet on an adjusted basis, the net loss margin was slightly higher in the current year at 35% compared to 37.2%.
Adjusted EBITDA loss margin improved from 37.5 percent in Q4 2018 to 12.9 percent in Q4 2019. More importantly, Lyft has remained consistent with its non-GAAP metrics and reports a contribution margin of 54% up from 45.5%.
In my opinion, Lyft’s financials are more straight forward in how the ridesharing model can achieve profitability while maintaining enough growth to satisfy tech investors.
Beware of a Changing Story
The last thing to note, which is quite important, is the story for Uber is changing frequently. Uber Eats is driving the growth and is the more stable part of the business in the current coronavirus economy, yet a portion was sold off in India to lower expenses and achieve profitability.
Autonomous vehicles were a major part of Uber’s story due to concerns around drivers who bring never-ending legal battles on the misclassification of employment. In as recent as January, autonomous driving was the most likely path to profitability for Uber. This story has changed entirely in two months’ time, yet it will be quite challenging for Uber to separate autonomous vehicle R&D from its financials.
CEO Dara Khosrowshahi highlights the “variable cost structure” of the business, which translates to not having to pay drivers employment benefits. Notably, the misclassification of employment is receiving renewed criticism with the ride-sharing business shut down from the Coronavirus.
The workforce of 5 million drivers have no unemployment, sick leave or health care. Although company is offering sick pay for drivers who test positive for the coronavirus, this does little for the majority of the drivers who are ordered to stay home to avoid the spread of the virus. Now, the company is now asking the government to offer the drivers benefits while Uber highlights its variable cost structure to investors.
Conclusion
The statement that Uber will be profitable is confusing at best as the company cannot simply separate the ride-sharing segment in order to make this claim. Even if this was possible, the ride-sharing growth is the lowest across all segments at 20% and ignores the catalysts of Uber Eats and the autonomous driving division.
In a recent call, Khosrowshahi stated the company has $10 billion in unrestricted cash, yet the CEO also stated the company could lose up to $6 billion from the Coronavirus quarantines. I believe Uber will need to raise more money in the near future and will do (and say) whatever necessary to raise its market cap before doing so.


More To Explore
Newsletter

Nvidia, CXL, and the Battle to Improve AI Inference Economics
This is Part 2 of our two-part series on AI inference economics. In Part 1 — Why Nvidia's Next AI Battle Is About Tokens per Watt, we laid out why tokens per watt has become the defining metric for in

Why Nvidia’s Next AI Battle Is About Tokens per Watt
As hyperscalers move from building AI infrastructure to monetizing it, tokens per watt helps to reflect if revenue is scaling and if profitability is improving. Offload engines can increase tokens per

Micron Is Up 900%. Here’s Why the AI Memory Trade May Still Have Room to Run
Over the past 10 months, memory chip stocks have gone from being solid beneficiaries of the AI boom to capturing a massively outsized piece of the return pie. The inflection in Micron’s performance de
Why the S&P 500 Shrugged Off the Iran War — and What Could Finally Break the Rally
On February 28th, the U.S. went to war with Iran, and the market was handed the kind of shock it hasn't contended with for years. The conflict set off a chain reaction across the region: an ongoing su
Nvidia, CoreWeave, and Nebius: Inside the Circular Financing of the GPU Boom
Neoclouds are one of the more hotly debated AI business models, with CoreWeave and Nebius being the two most widely recognized names. These companies have seen their sales, backlog, and share prices s
AMD, Nvidia, Arm, Intel: Inside the $120 Billion CPU Gold Rush
CPUs have gone from an afterthought to becoming the AI trade’s next great bottleneck – and with AMD, Nvidia, Arm and Intel circling a market that is doubling nearly overnight, the only question left i

Google TPU v8 vs Nvidia: How Inference Is Rewriting the AI Market
In April, Google announced it would begin selling its TPUs to select third-party data center operators, which is something the market has anticipated for nearly a decade. The TPU-versus-Nvidia-GPU deb

The AI Networking Stock That Beat Nvidia by 7X YTD for Returns of 135% YTD
AI networking stock Lumentum is among the key I/O Fund winners in 2026. We allocated heavily to LITE in January—a month before Nvidia backed the company. While most investors couldn’t stomach taking a

Bloom Energy — Our 2026 Top Pick Was the Best Performing Stock in April
April was the best month in six years for the Nasdaq-100. The single best-performing large-cap stock wasn't Nvidia, Microsoft, or Meta. It was Bloom Energy, up roughly 109% in one month. As you'll rec

Inside Nvidia’s $4B Optical Strategy—and Why CPO Changes Everything
Within the AI investment theme, there is nowhere that the supply chain shifts faster than in networking, leading companies to gain content on new platforms or lose incremental share. The reason is str
