Uber Stock Had Disappointing Q1 Earnings: So Why Did the Price Go Up?
June 13, 2019

Beth Kindig
Lead Tech Analyst

Uber’s CEO, Dara Khosrowshahi, is blaming timing and the trade war for the stock’s poor performance in its public market debut rather than focusing on the company’s unprofitability. When Uber filed to go public, the S-1 filing showed a massive operating loss of $3 billion per year. The most recent earnings report on May 30th showed the losses are getting worse at $1 billion per quarter for the “deeply unprofitable” company. Revenue is slowing down with growth of 20 percent to $3.1 billion in the most recent quarter compared to 25 percent revenue in the year-prior quarter. This was Uber’s slowest growth since it began disclosing results in 2017.
Meanwhile, Uber stock has received a unanimous buy rating from financial analysts and many positive press headlines. This analysis will look closer as to why the current stock price does not reflect the clear evidence of diminished value as of the Q1 earnings report.
Uber Stock: Prospectus and S-1 Filing
If you’ve read my previous analysis on Uber’s IPO and Lyft’s IPO, then you can skip this section on the prospectus and S-1 filing. Notably, I provided accurate predictions on both of these public offerings before the market knew how the companies would perform – and I was very clear on the risks around these two stocks prior to Lyft dropping 20% from its IPO price and Uber stock becoming the worst IPO performance in history.
My newsletter subscribers get this information first. Sign up here.
In years prior, Uber’s prospectus points towards “an accumulated deficit of $7.8 billion” in the years ending December 31, 2017 and 2018. In 2017, Uber posted $4 billion in operating loss and negative $2.6 billion in adjusted EBITDA with losses of about $3 billion in 2018. This upcoming year of 2019, Uber is on track to reverse backwards on operating losses to the $4 billion mark with no improvement in profitability despite demanding a large cap valuation.
Notably, for anyone glancing over the prospectus, Uber sold some operations in Russia and Asia, which provided one-time income, and caused the company to post $1 billion in net income. This is why net income should be ignored when looking at the financials as it does not reflect the operating income or adjusted EBITDA.
Uber’s Core Platform Contribution Margin also worsened, dropping from negative 3% in Q4 2018 to negative 4.5% in Q1 2019 (most recent quarter not shown on the graph below).

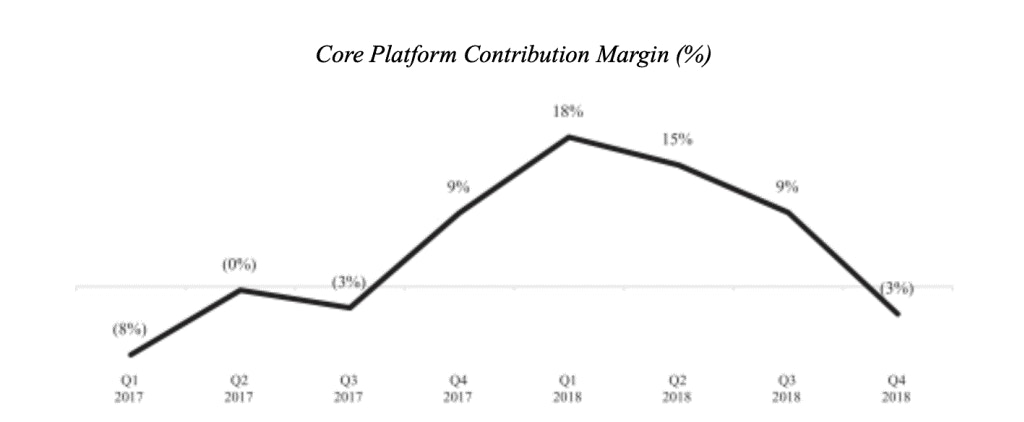
Uber states that the reason the Core Platform Contribution Margin goes through periods of decline is due to competition in ridesharing. As my previous analysis pointed out, Uber has to subsidize rides in order to drive demand. This causes artificial supply and is the primary risk for investors.
Uber Eats is mentioned often in earnings reports and in the press. To be clear, Uber Eats only contributed $165 million in adjusted net revenue in Q4 2018 compared to ride sharing at $2.3 billion in adjusted net revenue; which again, the ridesharing is what places the profitability in question.
Evidence That Uber Stock Price is Too High
The primary risk of the ride-sharing business cannot be offset by new ventures, although the company has attempted to offset these losses by lumping users from Uber Eats and Uber Freight into a “platform.” These native apps are not a platform; this is a loophole to hide the numbers on ride-sharing as Uber Eats likely has a healthy user base, totaling $7 billion in sales annually.

Uber and Lyft subsidize rides which is why revenue grows and losses accelerate. The more business these companies do, the more money they lose. We do not know the true cost of ride-sharing as customers are not paying fair market value, and instead venture capital dollars are providing a cheaper ride than what supply and demand dictates. This is essential to understanding the metrics pictured below.

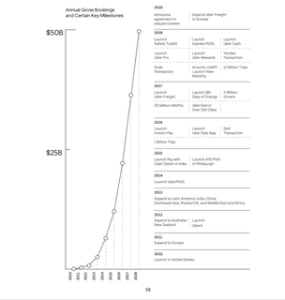
Mobile applications typically break down a few key metrics for investors to analyze. Uber does not offer monthly active users or daily active users. The company focuses on gross bookings, which is at a staggering $50 billion gross bookings annually, although this does not address why there are also staggering losses.
Data can easily be presented in favorable terms, and therefore, more than one source is recommended when drawing conclusions. In February, Adam Blacker of Apptopia, a provider of app intelligence, wrote a blog on various modes of transportation and estimated “decreases in active usage for Uber and Lyft, while seeing increases in public transportation.” The article goes on to state “From January 2018 to January 2019, Uber and Lyft lost a combined 1.2 million average DAUs in the United States.”
The majority of the DAU loss would have come from Uber due to the relative size of the company compared to Lyft, therefore, we can generously assume Uber lost 600,000 DAU, or about half the amount Apptopia reported. According to other sources, Uber completes about 14 million trips per day, so losing 600,000 DAUs is substantial as it represents a minimum loss of about 5% (this percentage of DAU likely higher as not all 14 million trips come from DAUs).
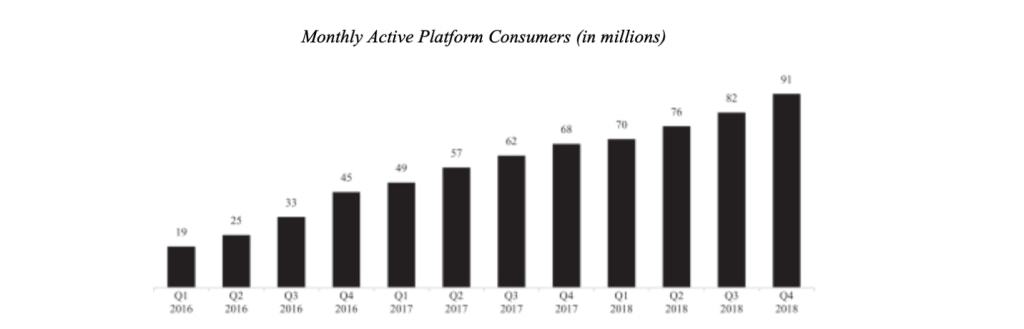
Former Uber growth marketer, Andrew Chen, has pointed out that DAU and MAU for Uber is not a meaningful number as infrequent airport rides are a strong driver of revenue growth, for instance, and these users are not reflected in DAU or MAU. However, when looking at past DAU compared to current DAU, this is a very meaningful number as it shows us relative churn and retention.
Uber Stock Lock-up Expires in November – Mark Your Calendar
If the S-1 numbers show massive losses of $3 billion and the Q1 earnings reports even worse losses of $1 billion per quarter, then why is Uber stock trading higher? My theory is that just like bitcoin, Uber has whales keeping the price steady until the lockup period expires. Before either ride-sharing company went public, I emphasized both IPOs would be liquidity events and to be especially cautious of the press, as PR is a cheap expense to protect the $60 billion that has been sunk into this startup.
When Uber’s lock-up expires in November, the true valuation of Uber will surface in the months that follow. It can take up to two years for a public offering to settle after the lock-up period. While I do not expect an immediate dump on day one of the lock-up expiring in November, I believe there will be a noticeable unwinding in the months that follow. As more shares become available, the stock price will undergo dilution. If you think I’m wrong about the overall fundamentals, and you want to invest in Uber and Lyft, I would urge you to wait beyond the lock-up.
Check out my analysis on Zoom published prior to the IPO, where I called it the Best Silicon Valley IPO of the Year.


More To Explore
Newsletter

Nvidia and Google Are Crowding TSMC’s N3 Node - Can Intel Fill the Gap?
Nvidia is moving its next-generation Rubin GPUs from 4nm to 3nm, yet Google’s latest TPUs are already on N3 and are expected to remain there. Meanwhile, a growing number of AI CPUs from Nvidia, Amazon

Intel vs TSMC: How CoWoS Packaging Constraints Could Create an Opportunity for Intel Foundry
Taiwan Semiconductor (TSMC) is the single, most important company to the AI industry. However, to compete with the incumbent, Intel does not need to beat TSMC at leading-edge manufacturing. It only ne

Big Tech’s Free Cash Flow is Turning Negative – Who's Next?
Big Tech’s AI revenue is accelerating, but free cash flow is moving sharply in the opposite direction. Across Google, Microsoft, Meta and Amazon, capex is rising much faster than operating cash flow a
Big Tech Earnings Preview: Is AI Monetization Finally Catching Up to Capex?
The most pronounced difference between 2026’s tech rally compared to rallies in the past is which companies have been left out of it. The names most associated with the AI trade have hardly participat
Nvidia, CXL, and the Battle to Improve AI Inference Economics
This is Part 2 of our two-part series on AI inference economics. In Part 1 — Why Nvidia's Next AI Battle Is About Tokens per Watt, we laid out why tokens per watt has become the defining metric for in
Why Nvidia’s Next AI Battle Is About Tokens per Watt
As hyperscalers move from building AI infrastructure to monetizing it, tokens per watt helps to reflect if revenue is scaling and if profitability is improving. Offload engines can increase tokens per

Micron Is Up 900%. Here’s Why the AI Memory Trade May Still Have Room to Run
Over the past 10 months, memory chip stocks have gone from being solid beneficiaries of the AI boom to capturing a massively outsized piece of the return pie. The inflection in Micron’s performance de

Why the S&P 500 Shrugged Off the Iran War — and What Could Finally Break the Rally
On February 28th, the U.S. went to war with Iran, and the market was handed the kind of shock it hasn't contended with for years. The conflict set off a chain reaction across the region: an ongoing su

Nvidia, CoreWeave, and Nebius: Inside the Circular Financing of the GPU Boom
Neoclouds are one of the more hotly debated AI business models, with CoreWeave and Nebius being the two most widely recognized names. These companies have seen their sales, backlog, and share prices s

AMD, Nvidia, Arm, Intel: Inside the $120 Billion CPU Gold Rush
CPUs have gone from an afterthought to becoming the AI trade’s next great bottleneck – and with AMD, Nvidia, Arm and Intel circling a market that is doubling nearly overnight, the only question left i
