In August 2025, we warned that the U.S. dollar was closer to a major low than most thought, and that this reversal would line up with a major top in Bitcoin. Two months later, Bitcoin peaked, and it has since fallen by 54%.
Now the dollar is back in an uptrend, Treasury yields are also climbing, and the bond market is signaling more Fed hikes ahead. Our system, which called the 2021 top, the 2022 low, and most recently the 2025 top, says global liquidity is tightening again, and that this bear cycle may not be over.
While the long-term outlook for Bitcoin remains promising, the intermediate time frame could see another 50% drop in the coming months. In this report, we discuss the importance of global liquidity, why it correlates to Bitcoin, and why it suggests more volatility ahead. We then outline the sentiment patterns Bitcoin is most likely tracing, along with the key levels we are watching, including the level that will entice us to buy.
How a Rising U.S. Dollar and Tightening Global Liquidity Drive Bitcoin Bear Cycles
“The U.S. dollar is closer to a major low than most think. While it can extend further, once we get evidence of a trend reversal, this should line up with a topping process in Bitcoin.”
The reason that we track the U.S. Dollar is because it acts as a general proxy for global liquidity, a term that is spoken frequently, yet is often misunderstood. It simply means the aggregate availability of money, credit, and collateral across the global financial system that can fund real economic activity. The more expensive the cost of money is, the less money is available to fund economic activity, including purchasing risk assets like Bitcoin.
The Cost of Money and Collateral Is Rising
The global economy runs on debt. In fact, three out of every four financial transactions in the world is rolling over existing debt. So, the cost of money is a crucial factor when tracking global liquidity trends. This is generally marked by global central banks’ policy rates – the higher rates are, the more expensive money is to borrow.
However, it’s not just the cost of money, but the collateral used to access money. Today, over 80% of this debt requires collateral, typically in the form of high-quality, low-volatility assets like U.S. Treasuries.
How cheaply one can access money (interest rates), and how cheap the collateral is for new debt (low volatility in the Treasury markets) will determine how much one pays to access debt markets.
The first issue within the current global liquidity equation is that the cost of accessing collateral is going higher. As the Federal Reserve raises rates in an attempt to quell inflation, it increases the yields on the front end of the curve with T-Bills. Furthermore, because the US economy is growing well above trend based on recent GDP revisions, the U.S. bond market is breaking down from a 3-year support level, forcing yields higher on the long end of the curve.
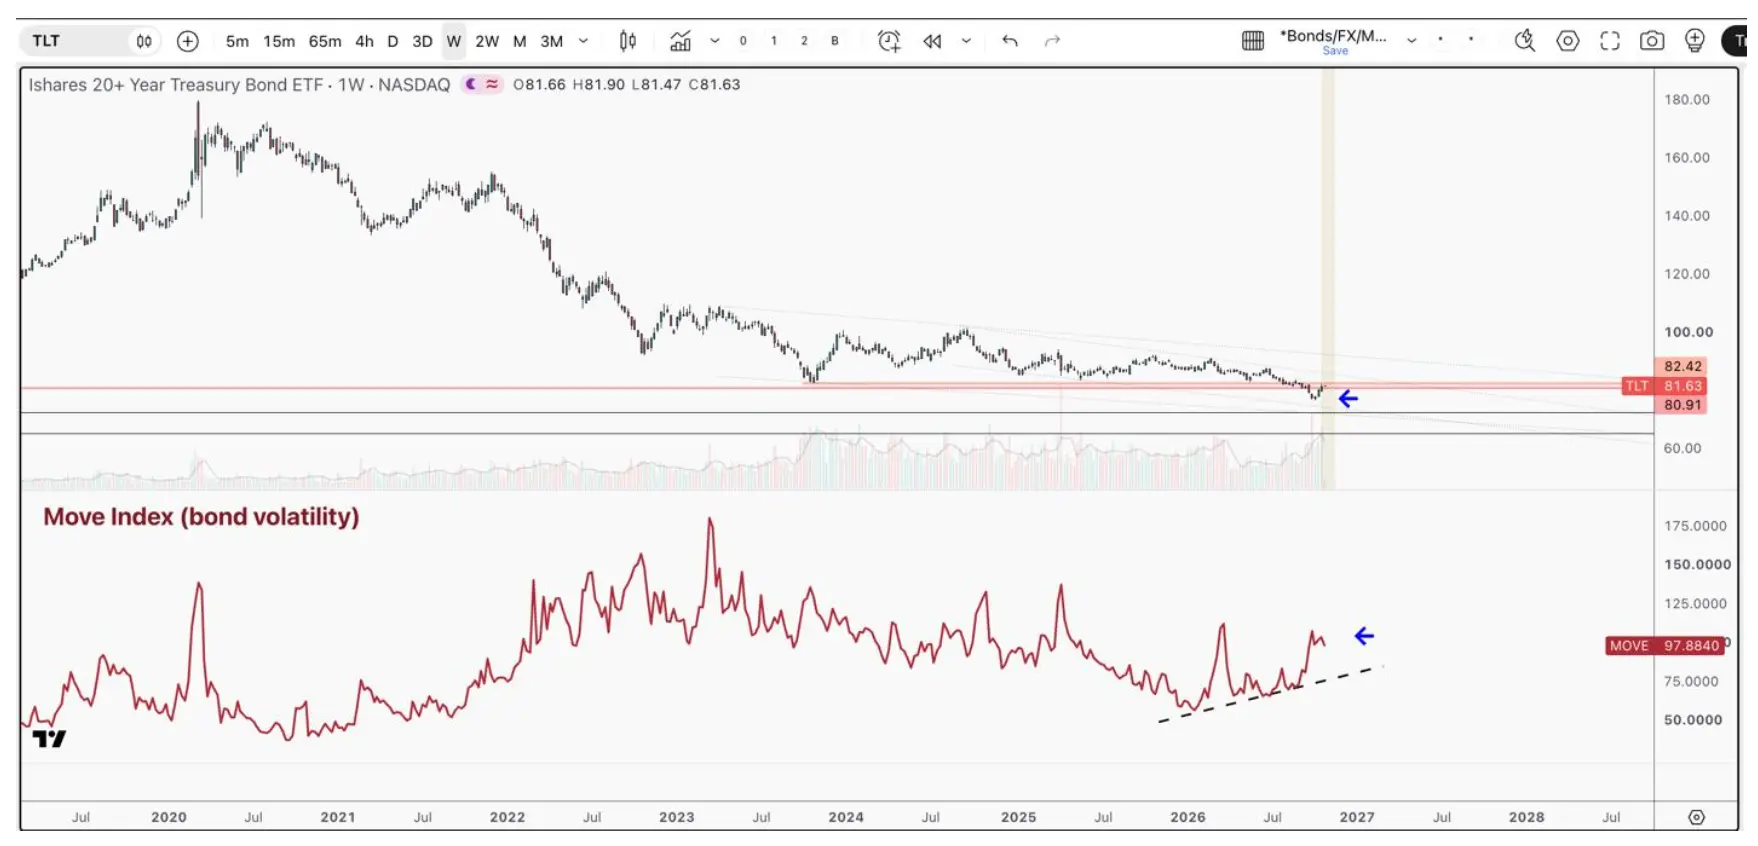
Bonds across the curve are moving lower, as yields move higher. This brings volatility and fear back into the bond market, as measured by the Move Index.
As long-duration U.S. Treasury bonds (TLT) test support near 81, the MOVE Index has climbed to 97.9, signaling rising volatility in the Treasury market. Higher bond-market volatility can increase collateral costs and tighten financial conditions, reinforcing pressure on global liquidity.
This forces a repricing of cheap collateral, which means the cost to borrow is getting more expensive. The more money one must spend on collateral, the less money in the system there is to buy risk assets like Bitcoin.
A Stronger U.S. Dollar Tightens Global Liquidity
However, it’s not just the collateral that is getting more expensive, but the currency that most of the world is trying to borrow. The U.S. Dollar is the most important asset in global finance, and understanding this fact is paramount in understanding global liquidity dynamics.
As stated, collateral is needed for most loans, and the primary asset for collateral is U.S. treasuries, which is priced in dollars. However, it goes much further than just the needed collateral.
There is currently $84 trillion dollars in U.S. denominated debt outside of the United States. This comes to roughly 64% of all global debt denominated in dollars. If abundant global liquidity is defined by cheap debt and cheap collateral, this means that there must be an endless stream of cheap dollars to keep global liquidity expanding. If the U.S. dollar moves higher against a foreign currency, then debt holders must use more of their local currency to service the same debt. This depletes the aggregate capital in the system that can be used to fund economic activities, as well as fund higher prices in equites and crypto markets.
When we analyze the Dollar Index, which tracks the U.S. dollar against six major currency pairs, the downtrend that started in the U.S. Dollar in September 2022, just one month before the low in equities, has clearly ended.
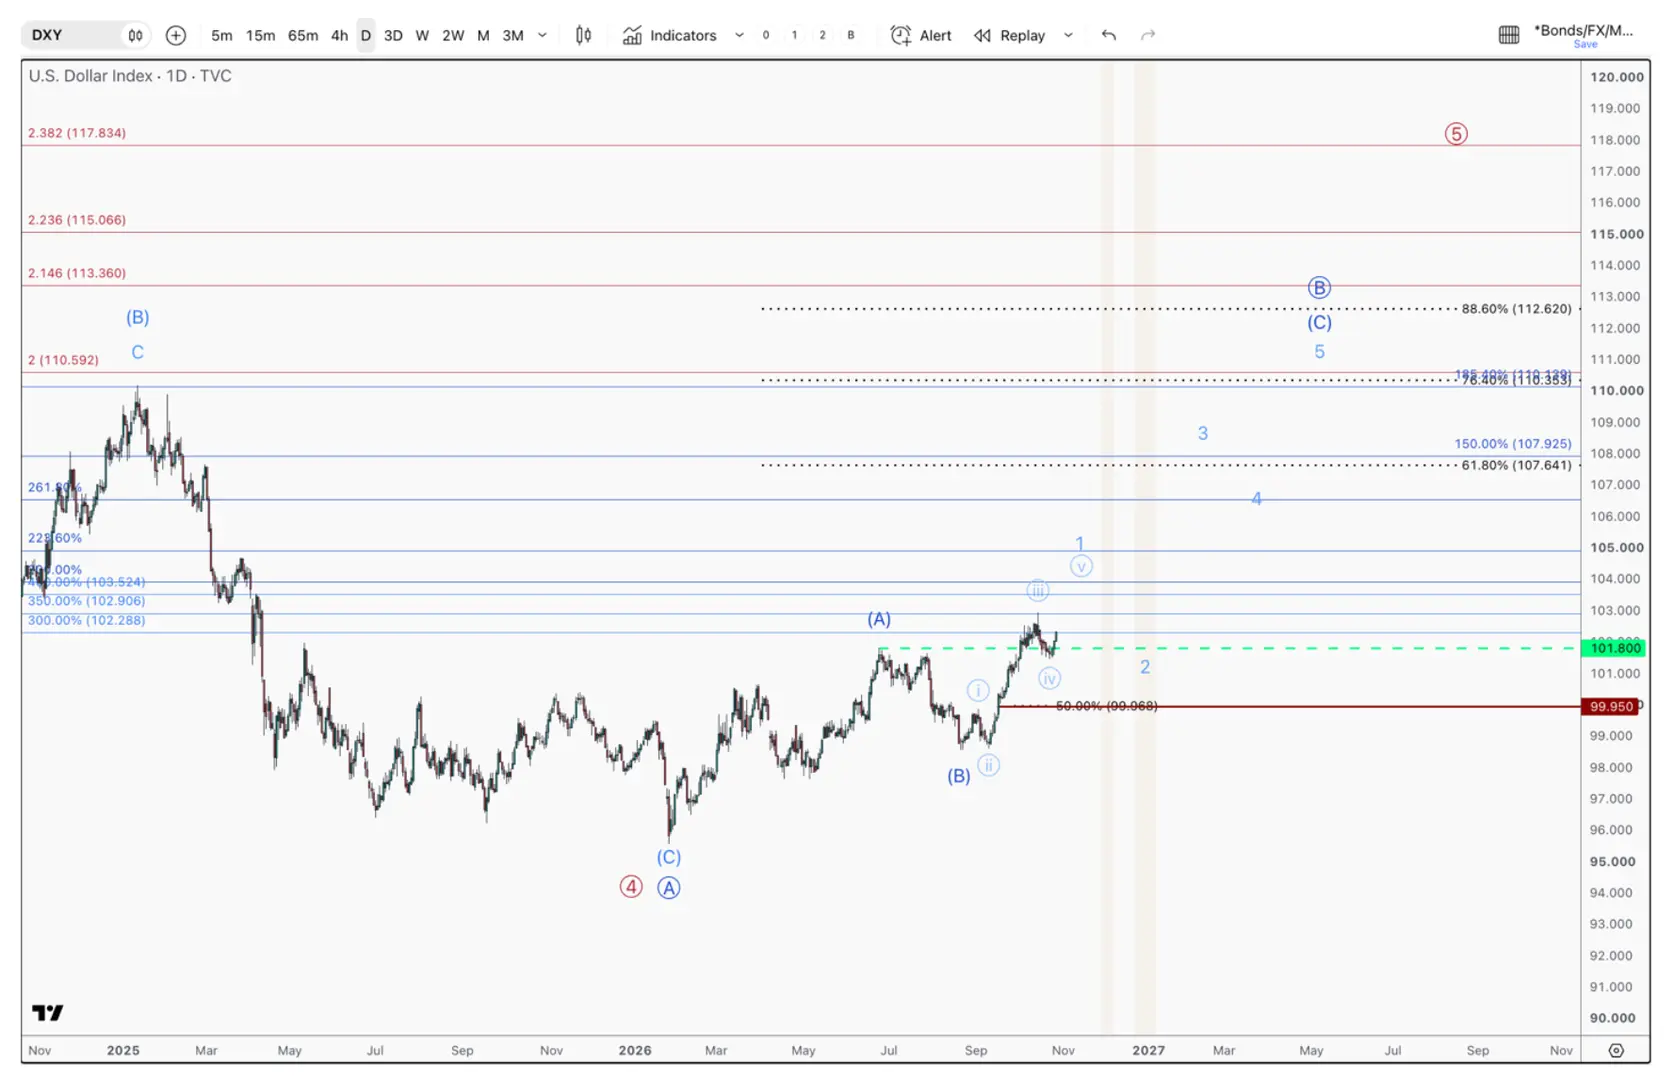
The U.S. Dollar Index (DXY) has established a series of higher highs and higher lows since its January low and is holding above 100. Technical projections on the chart point toward targets between 107.6 and 112.6, supporting the view that further dollar strength could continue to pressure global liquidity and risk assets such as Bitcoin.
Since the low in January of this year, we have seen three higher highs in DXY, which were met with two higher lows. In basic technical analysis, this constitutes a renewed uptrend. When we take this analysis further, the Elliott Wave count suggests that as long as any further weakness in DXY holds $95.95, we should continue to trend well above $100 in the coming months. A move this high in the dollar would put significant strain on global liquidity, and in turn risk assets like Bitcoin.
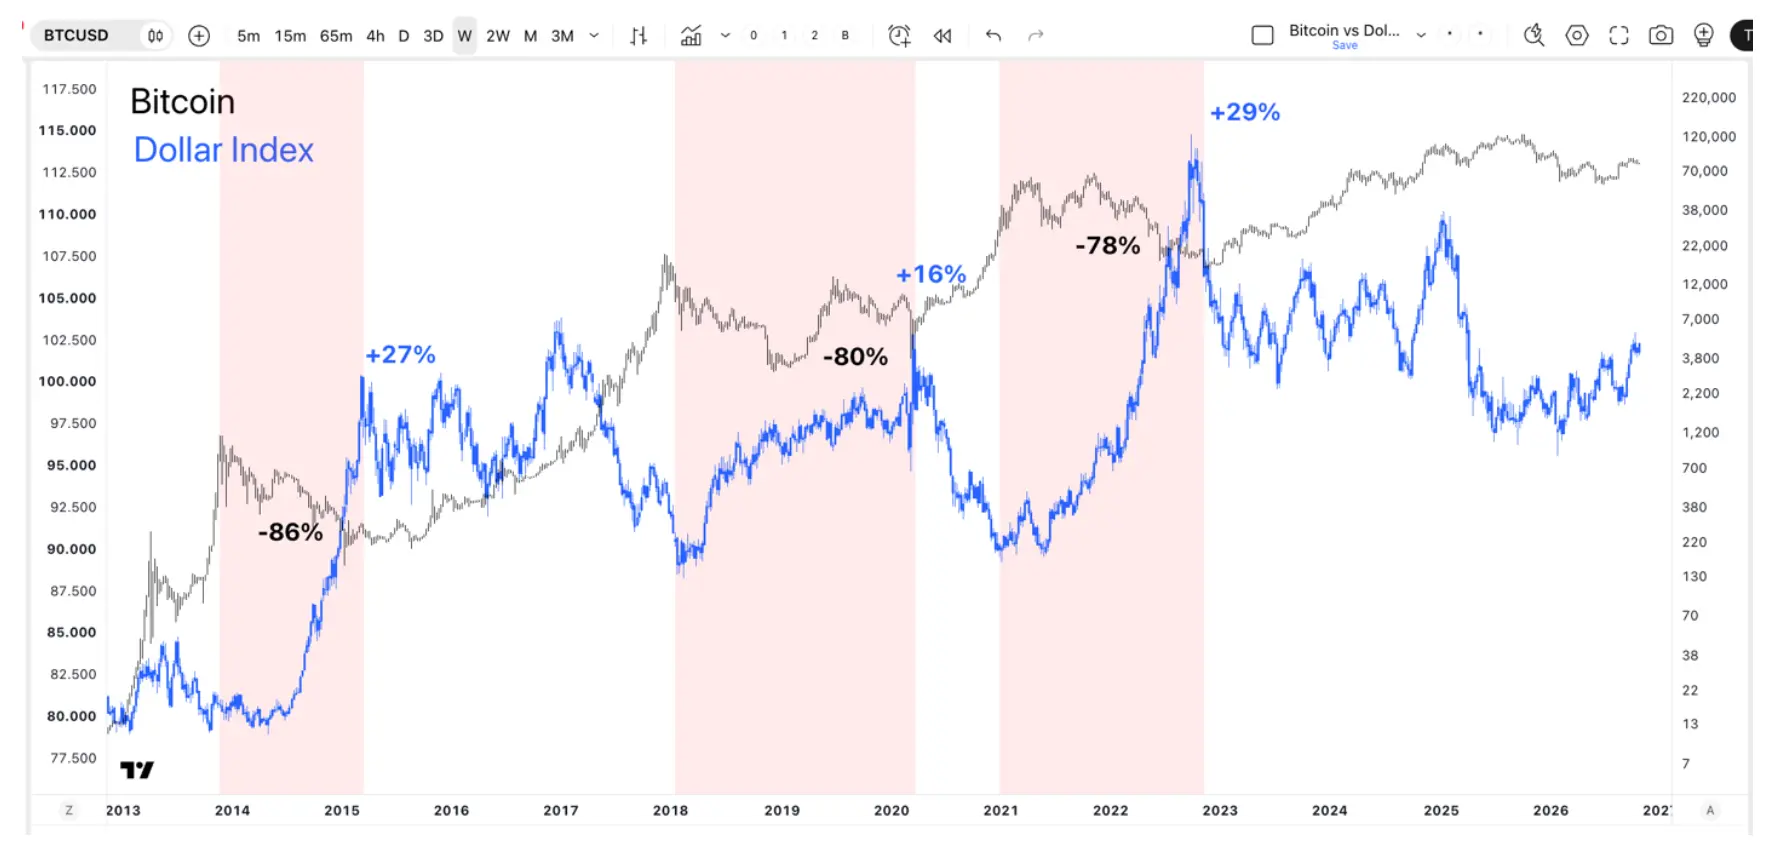
The U.S. dollar is one of the most important elements that defines liquidity trends. If we just compare Bitcoin with DXY, there is a clear inverse correlation, at times, between the two.
Major DXY rallies of 16% to 29% coincided with Bitcoin drawdowns of roughly 78% to 86%, while periods of dollar weakness often aligned with Bitcoin bull markets. Although the relationship is not perfect, sustained dollar strength has historically been associated with some of Bitcoin’s deepest bear market declines.
Get Our Free Weekly Stock Newsletter
Get weekly stock insights, market analysis, and technology updates straight to your inbox.
Weekly stock insights
Market analysis
Technology updates
While the inverse correlation between DXY and Bitcoin is not perfect, every time the U.S. dollar went into a strong uptrend – making the cost of collateral and servicing existing foreign debt more expensive – Bitcoin saw its harshest drawdowns.
Fed Policy Points to Further Liquidity Tightening
There are many factors that cause an increased demand for dollars, including strong growth, a booming stock market, or a flight to safety; however, one of the primary causes is Central Bank policy.
The FOMC began its first-rate hiking campaign in nearly five years. Even though they kept the policy rate stable going into an election, according to the bond market, the FOMC has, at least, two more hikes in the future.
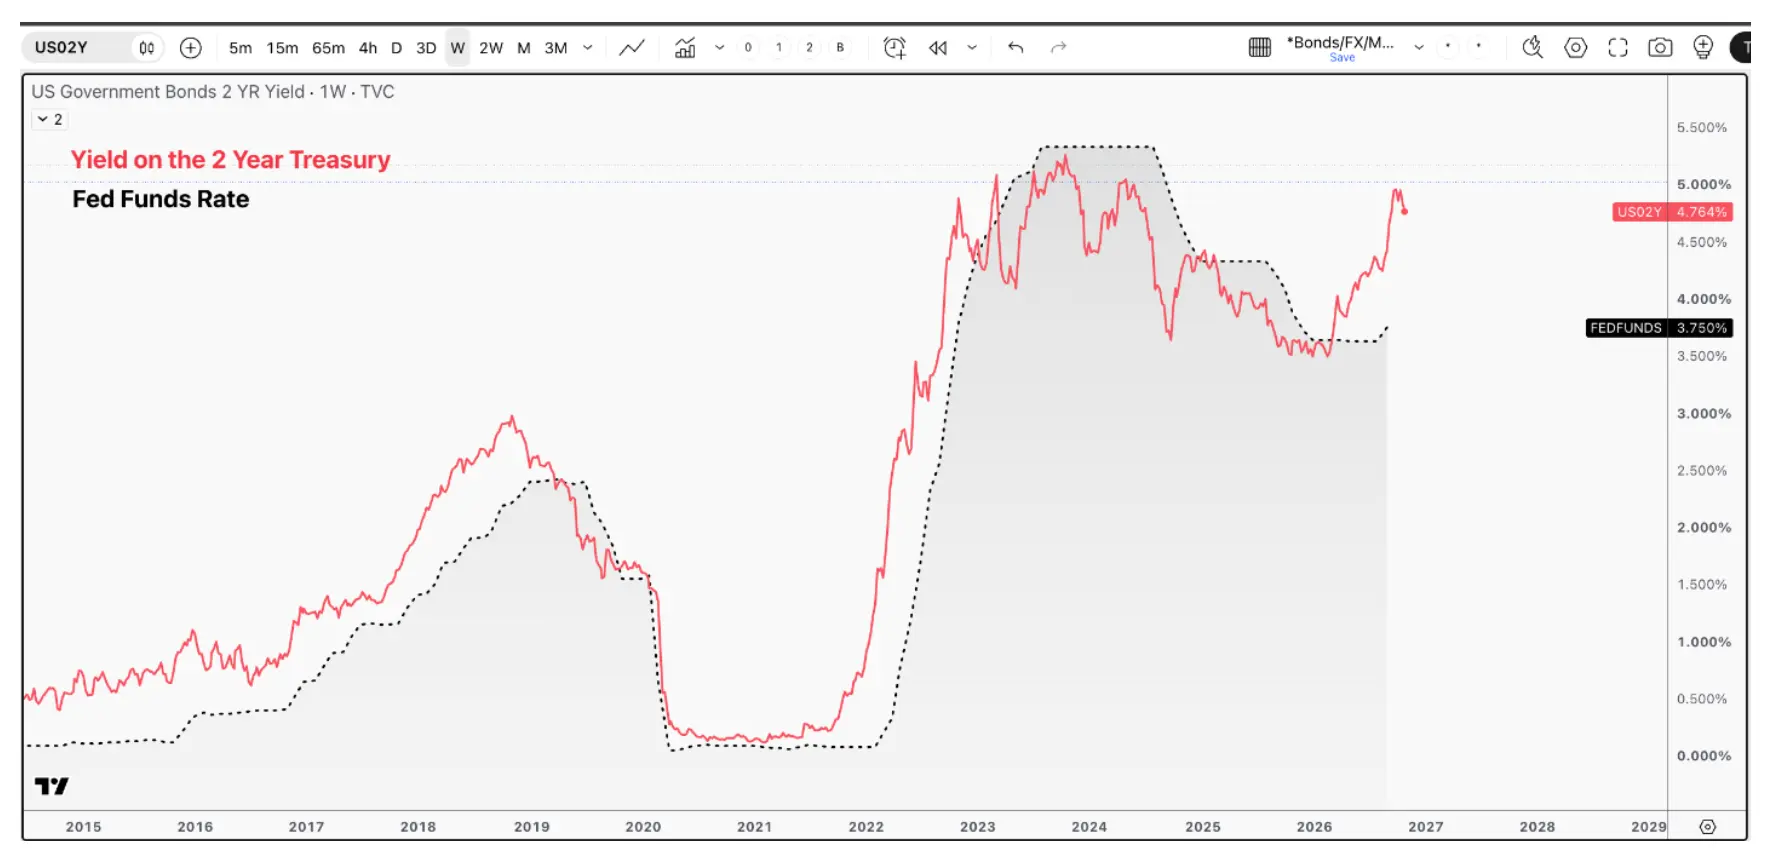
While growth and inflation expectations dictate the long end of the yield curve, what dictates the front end is where the bonds market perceives the Fed Funds rate should be. For example, the yield on the two-year treasury consistently leads to the FED, not the other way around, and the two-year yield is clearly flashing that the FED is too accommodative. This implies that the FED has likely not paused in this hiking campaign but has further to go.
The 2-year Treasury yield has climbed to approximately 4.76%, well above the 3.75% Fed funds rate, indicating that bond markets expect monetary policy to remain tighter than current Federal Reserve projections. Historically, the 2-year yield tends to lead changes in Fed policy, supporting the view that liquidity conditions may continue to tighten.
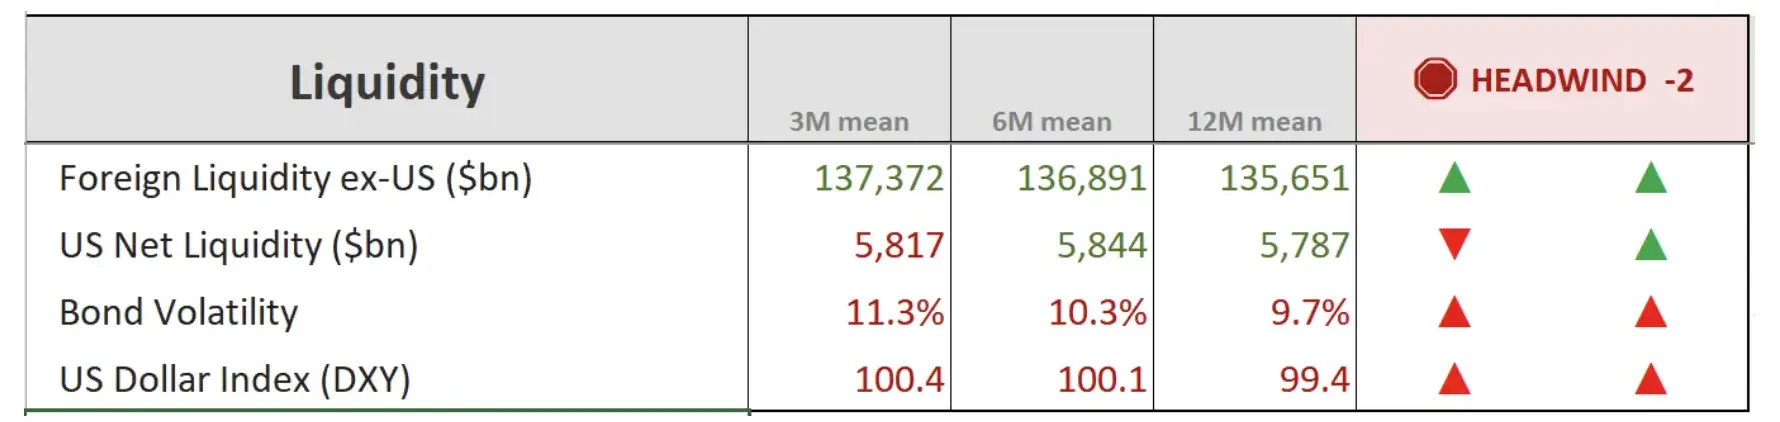
When we put all elements together into a simple composite, there is a notable trend reversal underway in terms of global liquidity.
Global Liquidity is clearly contracting.
When the FOMC is forced to raise rates due to strong growth and inflation concerns, it increases the cost to access U.S. markets. This means the cost of collateral in the form of U.S. treasuries goes higher, while the cost to access dollars globally goes higher. This restricts excess capital in the system, which is always felt with risk assets around the margins – Bitcoin being one of the most consistently correlated.
As the Dollar Rises, Where Does Bitcoin Fall? Key Levels and Price Targets
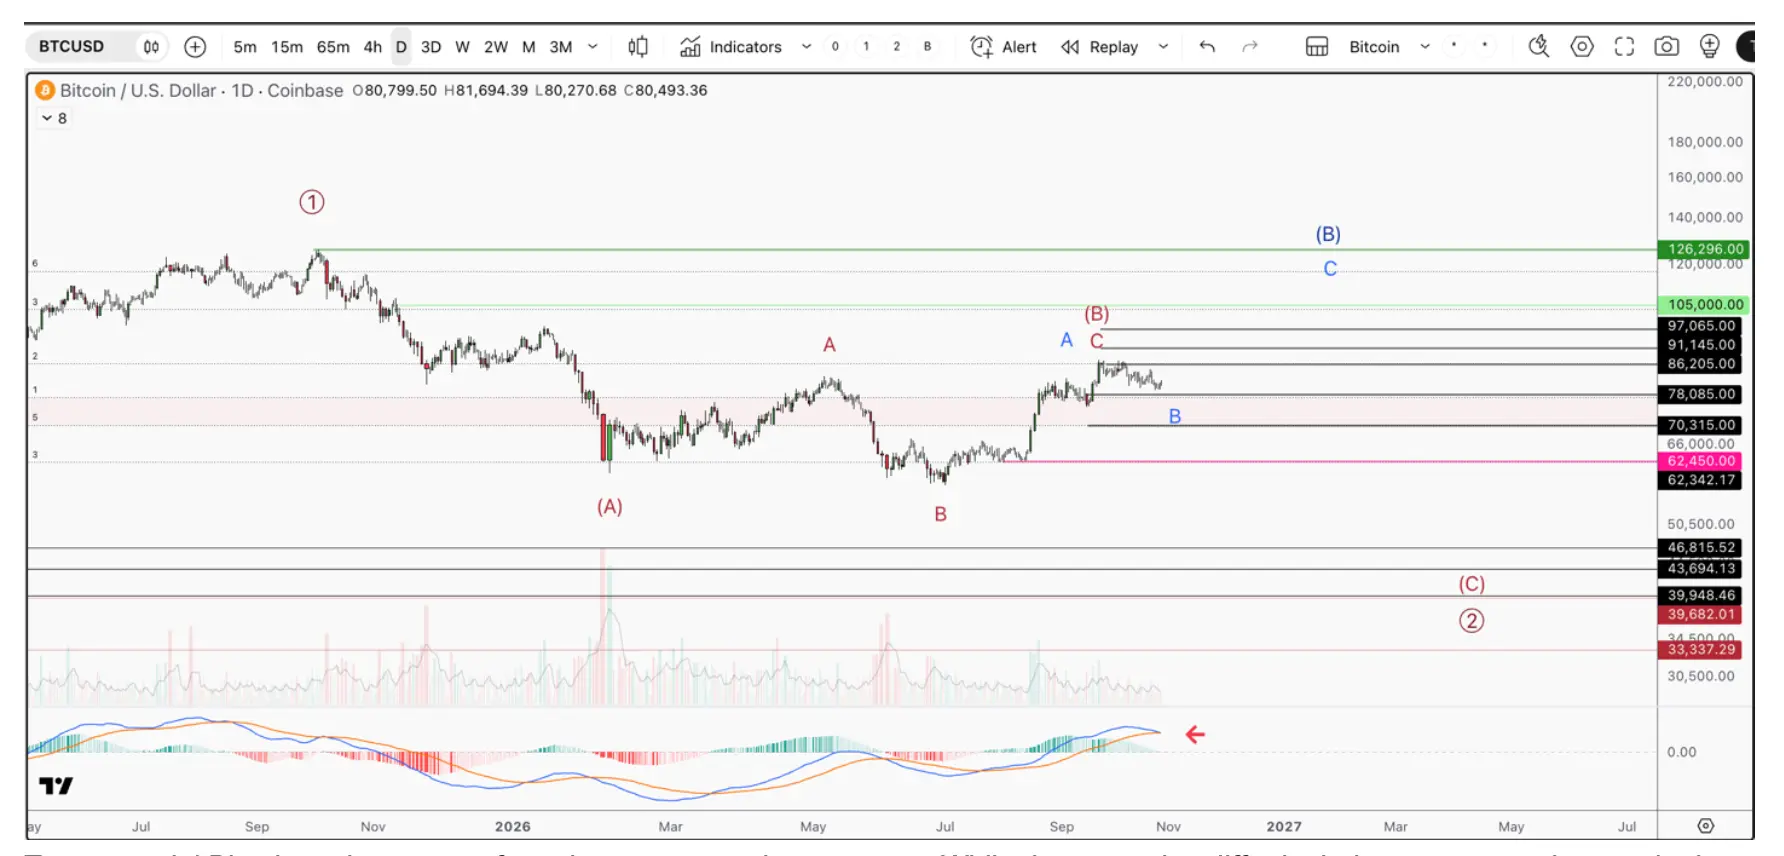
If we analyze the sentiment pattern in play with Bitcoin, we can see inherent risk in the current bounce that is in play. As shown above, it appears that the U.S. Dollar is in a renewed uptrend, with higher levels on the horizon. This will undoubtedly put a further strain on global liquidity, which will likely hurt Bitcoin.
There are two price scenarios that I am tracking, which I believe are the most probable based on the combined evidence:
Two potential Bitcoin paths emerge from the current market structure. While the scenarios differ in their near-term trajectory, both ultimately point to the possibility of a deeper decline toward the $40,000-$30,000 region unless Bitcoin breaks above $126,296.
Red – We just completed a 5-wave uptrend off the July 1st low. This is the final move in a corrective bounce that started in early February. We will now see a direct drop that first breaks through $70,315 and finally $62,450. This will confirm that we are in the final swing of this bear cycle, which will be generally targeting the $30,000 region. Once this is confirmed, we will be able to get a more precise buy zone.
Blue – The corrective bounce started off the July 1st low. We have the first leg in this bounce completed and are now in the retrace. This retrace should target $78,000 – $70,315 but must hold $62,450. We will then turn higher toward $105,000 – $117,925. If we hold below $126,300, we will then turn lower toward the $40,000 – $30,000 region.
Conclusion
Our long-term thesis for Bitcoin reaching $2 million remains intact, but the path there is unlikely to be a straight line. Global liquidity, the most consistent driver of Bitcoin’s cycles, is tightening. The U.S. Dollar has reversed its downtrend, while treasury yields are climbing across the curve. More concerning is that the bond market suggests the Fed still has further to hike. Together, these forces raise the cost of both the dollars and collateral, leaving less capital for risk assets like Bitcoin.
Both price scenarios we are tracking point to the same destination: a final swing lower into the $40,000 – $30,000 region. The Red scenario gets there directly, confirmed by a break below $70,315 and then $62,450. The Blue scenario allows for one more rally toward $105,000 – $117,925, before turning lower. If we instead see a breakout to new highs, over $126,300, that will be our signal that the bear cycle ended early, and we will buy into that.
Our approach focuses on protecting capital through crypto bear cycles, then rebuilding a position with the lowest possible risk. We will refine our buy zone as the structure is further confirmed. Our system has successfully guided us through every major turn since 2021, and we intend to do the same for the next cycle.
For I/O Fund members, we will continue tracking both scenarios closely and provide buy alerts when our signals confirm that timing has improved.
Don’t Miss Bitcoin’s Next Major Buying Opportunity. Get access to I/O Fund’s real-time trade alerts and join Knox’s live webinar this Thursday at 4:30 p.m. ET, where he discusses potential trades across crypto and AI stocks. Knox and the I/O Fund have 41 positions beating the Nasdaq-100 since the start of the AI boom on Jan 1st, 2023 and 13 positions beating the Nasdaq-100 this year alone.
Please note: The I/O Fund conducts research and draws conclusions for the Fund’s positions. We then share that information with our readers. This is not a guarantee of a stock’s performance. Please consult your personal financial advisor before buying any stock in the companies mentioned in this analysis.
Knox Ridley is the Technical Portfolio Manager at I/O Fund, where he leads technical analysis and risk management. He started his career in 2007 as a licensed ETF consultant and has worked with hundreds of financial advisors and large institutions. Knox is trained in Fibonacci trading, Elliott Wave Theory, and Gann Cycles.