Bitcoin Vs Banks: Here's Where the Price Goes Next
April 05, 2023

Knox Ridley
Portfolio Manager

On December 9th, we announced that we are buying Bitcoin and laid out the reasons why in a free article that was quite clearly named: “Bitcoin is Going to Rally Again: Here’s What You Need to Know.” Since stating that in that article that Bitcoin was at a meaningful low, Bitcoin is up ~62%. Here is what I said:
“Though we are in the 4th bear cycle in Bitcoin's history, the prior 3 cycles suggest where we are is a rare buying opportunity. There is ample evidence to support the $15,500 level is either a major low or very close to a major low. Both the technical and on-chain analysis support this.”
We then followed up that article on January 9th, stating that Bitcoin is likely in the early stages of a cyclical uptrend, and that we are continuing to buy at current prices. Since then, the price is up ~40%.
Not only is the on-chain analysis lining up with our technical analysis, but the fundamental story behind Bitcoin’s intended purpose is starting to manifest. Most forget that Bitcoin’s white paper was first introduced on the heels of a banking crisis that nearly brought down the global financial system. The intended purpose of Bitcoin was to be a hedge against failing banks, as stated by its creator in 2009.
“The root problem with conventional currency is all the trust that's required to make it work. The central bank must be trusted not to debase the currency, but the history of fiat currencies is full of breaches of that trust. Banks must be trusted to hold our money and transfer it electronically, but they lend it out in waves of credit bubbles with barely a fraction in reserve.”
The recent decoupling of Bitcoin from equities, we believe, is the start of a new uptrend that appears to be inversely correlated to the financial sector.
The financial media would have us believe that the current banking crisis is mostly US centric, and localized to regional banks. However, as we look at various charts from these banks, a different story emerges. This is not just a US problem, and it is not limited to regional banks. As more and more investors realize their deposits, once again, may not be safe, we should see an increase in Bitcoin’s demand, which is supported by the on-chain and technical analysis provided below.
Bitcoin and Banks
On Friday, March 10th, Silicon Valley Bank (SIVB) failed. With over $200 Billion in deposits, SIVB was one of the largest banks in the US, and therefore one of the largest bank failures in US history. This was quickly followed by the failure of Signature Bank in New York, with deposits of over $110 Billion. What followed was a mini panic out of regional bank stocks, as we soon saw depositors fleeing the more vulnerable regional banks and into the Too Big to Fail banks.
Interestingly, on March 10th, Bitcoin bottomed and began one of the sharpest jumps we’ve seen since 2021.


This may seem like a random occurrence, yet this move lines up with Bitcoin’s original white paper, first published on the heels of the Great Financial Crisis (GFC) by the mysterious Satoshi Nakamoto. The original intent of Bitcoin was to create a true peer-to-peer electronic payment network that did not rely on centralized institutions to facilitate transactions. In short, it was the first real attempt to disrupt the banking system, and remove the inherent risks in a centralized banking system.
Coincidentally, this white paper was released in February, 2009, which was at the height of despair from the global banking system melting down. Most people assumed their money was safe in a bank and that it would be there when they need it. Most people had no idea about fractional banking, let alone credit default swaps and collaterized debt obligations. What they did realize on a primal level in 2008 was that their money was at the mercy of a centralized system that was much more complex than they thought and not as safe as they previously believed.
What we are seeing today is a repeat of the same realization, only with different details. The popular narrative regarding the current banking crisis is that deposits are fleeing regional banks at a record pace and moving into the “Too Big to Fail” banks, like JP Morgan, Citigroup, Bank of America. Therefore, any additional weakness in banks should be localized to regional banks while the big banks continue to thrive, which should offset the current weakness.
This sounds plausible, and fits within the relative calm we’ve had since the FED has fenced off the problem banks. However, if we look at the big banks that should be receiving this tailwind of deposits, another picture emerges.
Bank of America (BAC) is one of the largest and most important banks in the US. After the epic consolidation from the GFC in 2008, it was deemed, along with a handful of other banks to be Too Big to Fail, and it remains so today. Just a simple glance at the price chart and we can see that BAC is comfortably below its October low with no buyers stepping in at a critical support level.

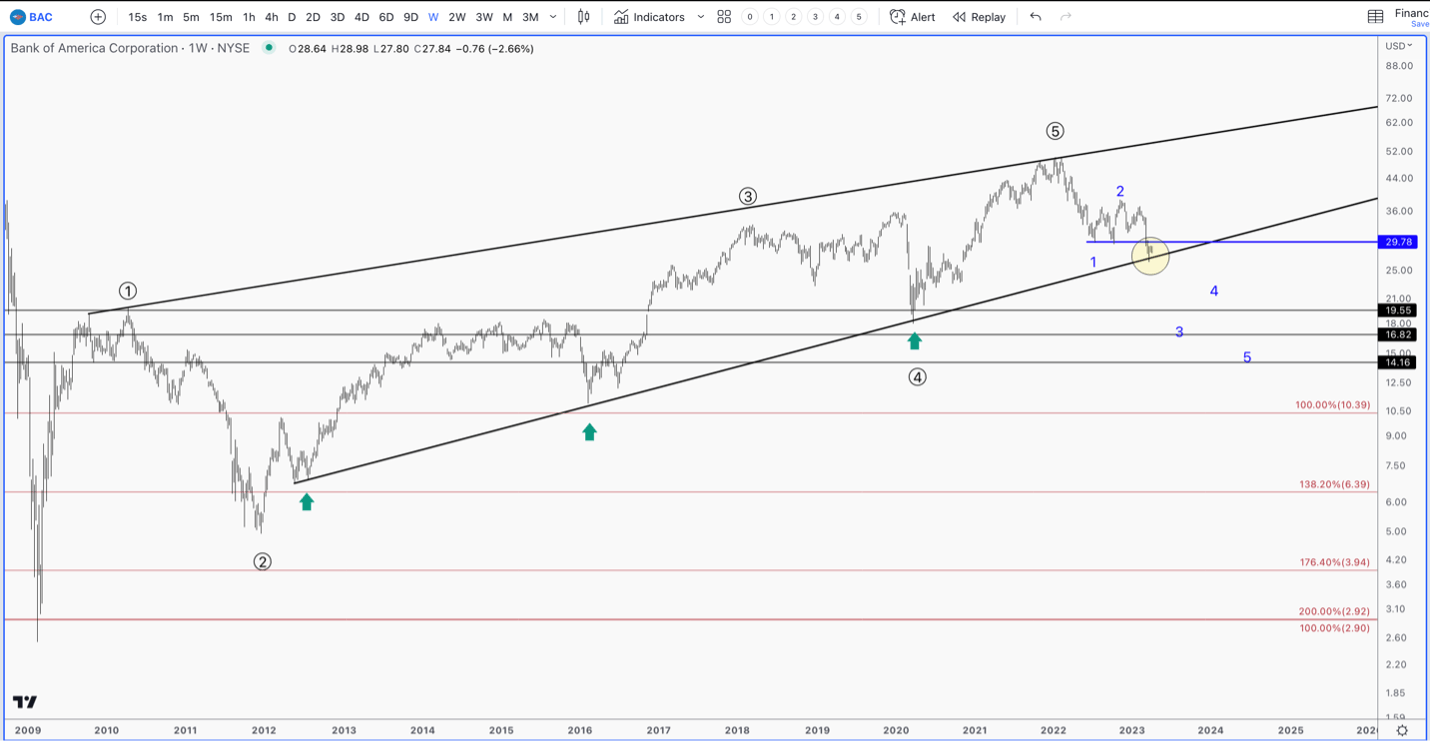
BAC is threatening to break a trendline that has kept the stock trending up since 2012. What is also concerning is that BAC has completed a large degree 5 wave uptrend off the 2009 low. Furthermore, the corrective pattern that began in late 2021 is incomplete and suggesting a test of the COVID lows is needed before some kind of meaningful low can be found. The failure to find buyers at such important support is alarming.
Another “Too Big to Fail” Bank is Citigroup (C). This chart is significantly weak, and has basically trended sideways since the 2009 low.

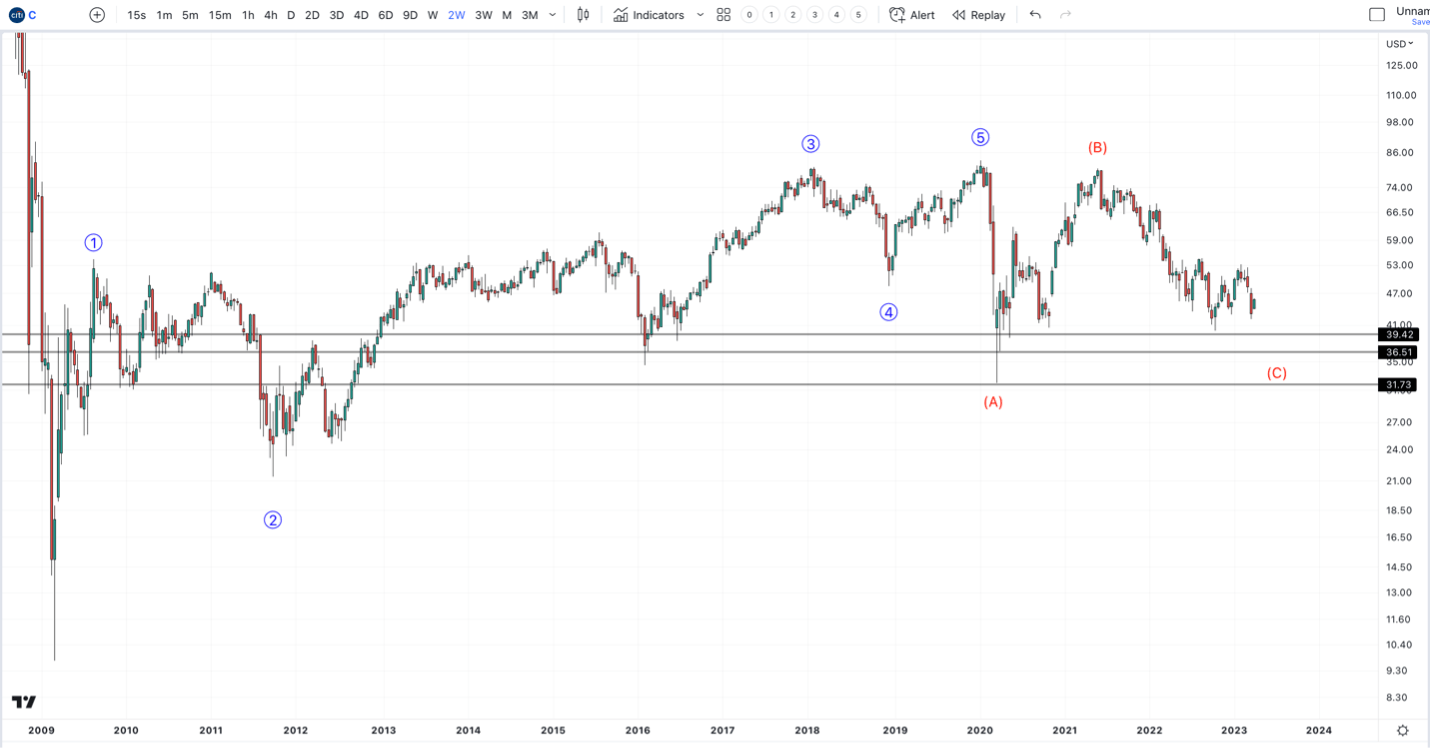
Like BAC, it has completed 5 waves up off the 2009 low; however, it topped in 2019, failing to make a new high during the COVID bull market. Also, like BAC, it appears to be pointing towards the COVID low to complete a large degree correction.
Another Bank deemed “Too Big to Fail” is Morgan Stanley (MS). It is also in a precarious position.

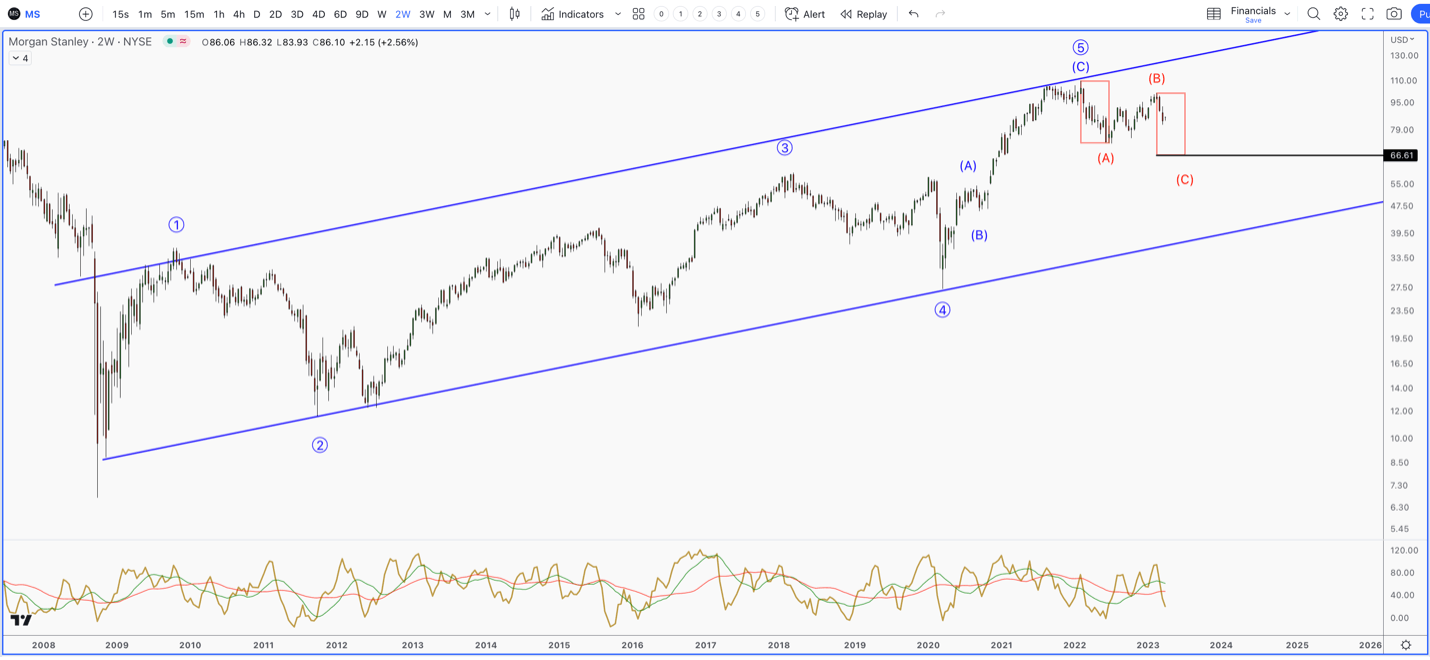
Though it is relatively stronger than BAC and C, it has also completed a large 5 wave uptrend off the 2009 low. The following correction, like most bank stocks, has not completed its corrective pattern and looks to be targeting a price below the October low of 2022.
These large banks have quite unhealthy and concerning charts. They suggest that what is going on in the banking sector may not be a tailwind for them, but in fact, a headwind that will offset any increase in deposits.
What’s more concerning is that the banking issues do not seem to be localized to just the banks. The below chart is Metlife (MET), one of the largest insurance providers in the US.
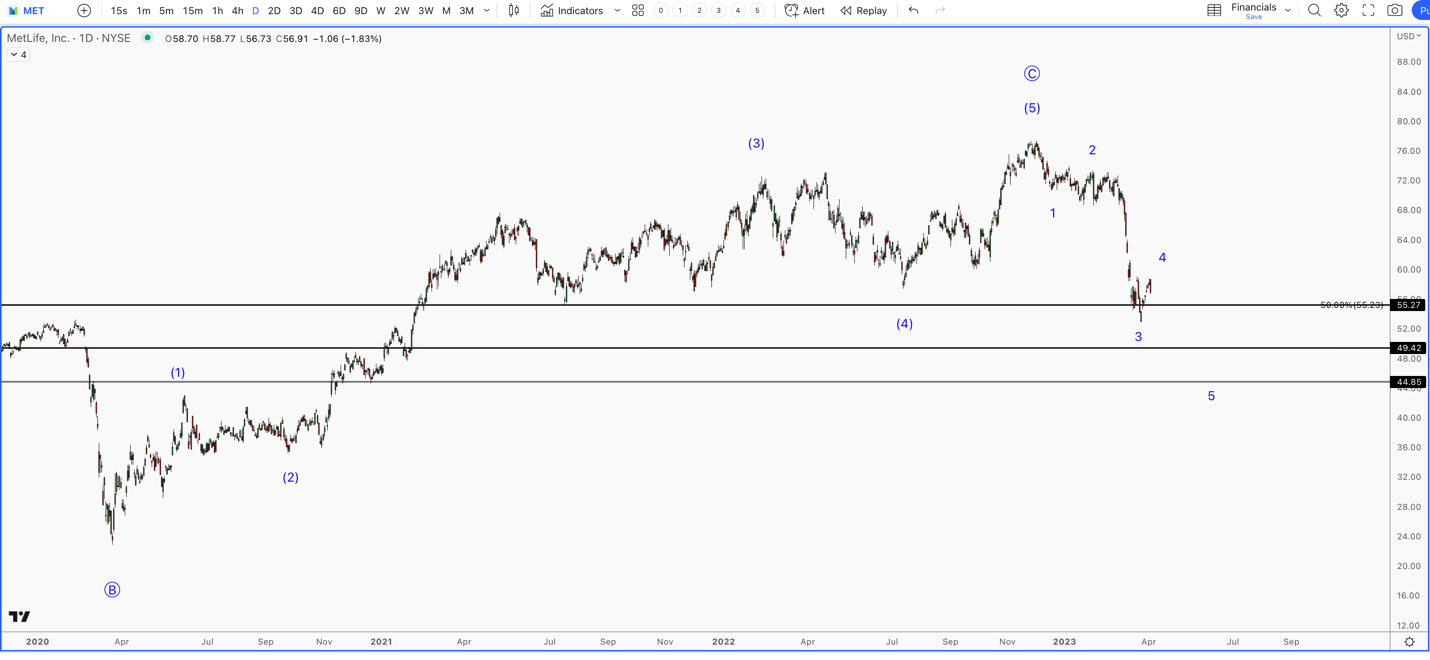
This is one of the weakest charts in the mega cap financial spaces, as the stock cannot catch a bid at major support. The corrective pattern looks to be a 5 wave move down that is incomplete. If accurate, it suggests that MET has put in a major top.
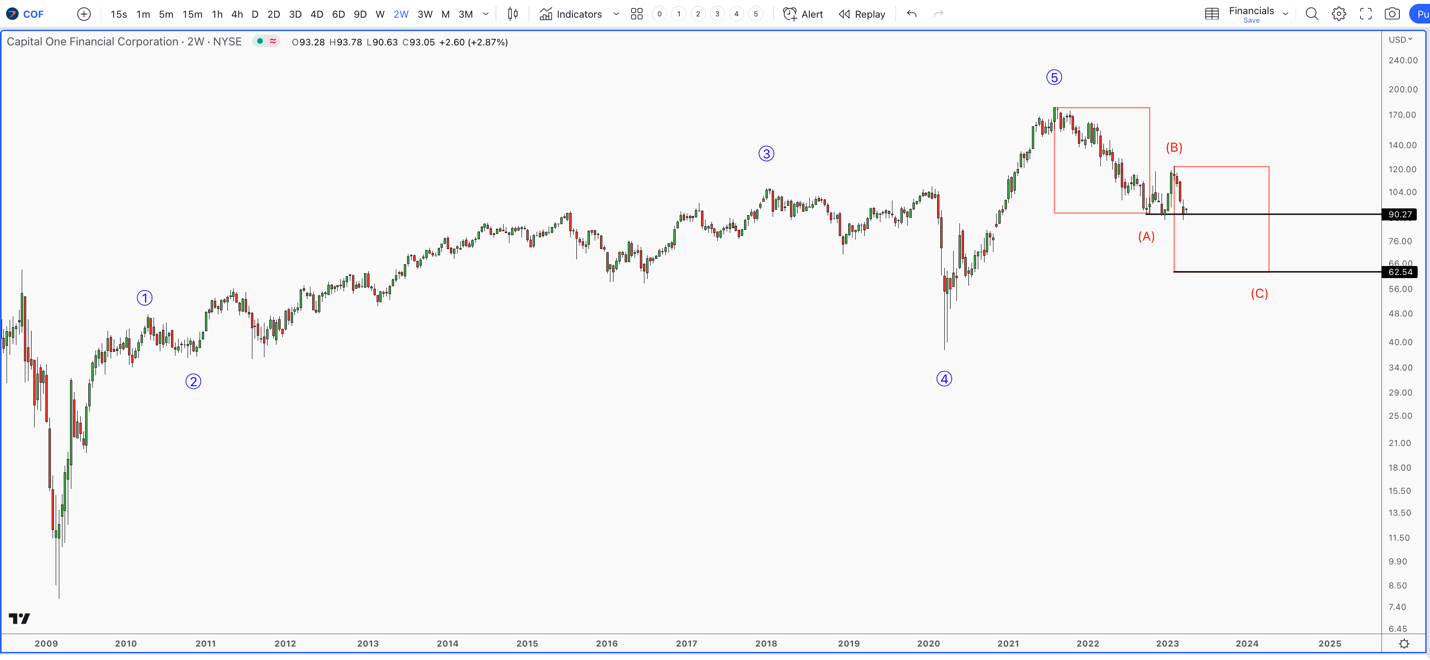
Capital One (COF) is another big financial stock that looks like it is in trouble. As a credit card and banking company, its chart looks to be heading much lower, as it attempts to find buyers at a key support level.
Furthermore, the issue is obviously not localized to the US, proven by the collapse of Credit Suisse. However, if we look at various charts from global banks, a similar pattern emerges.
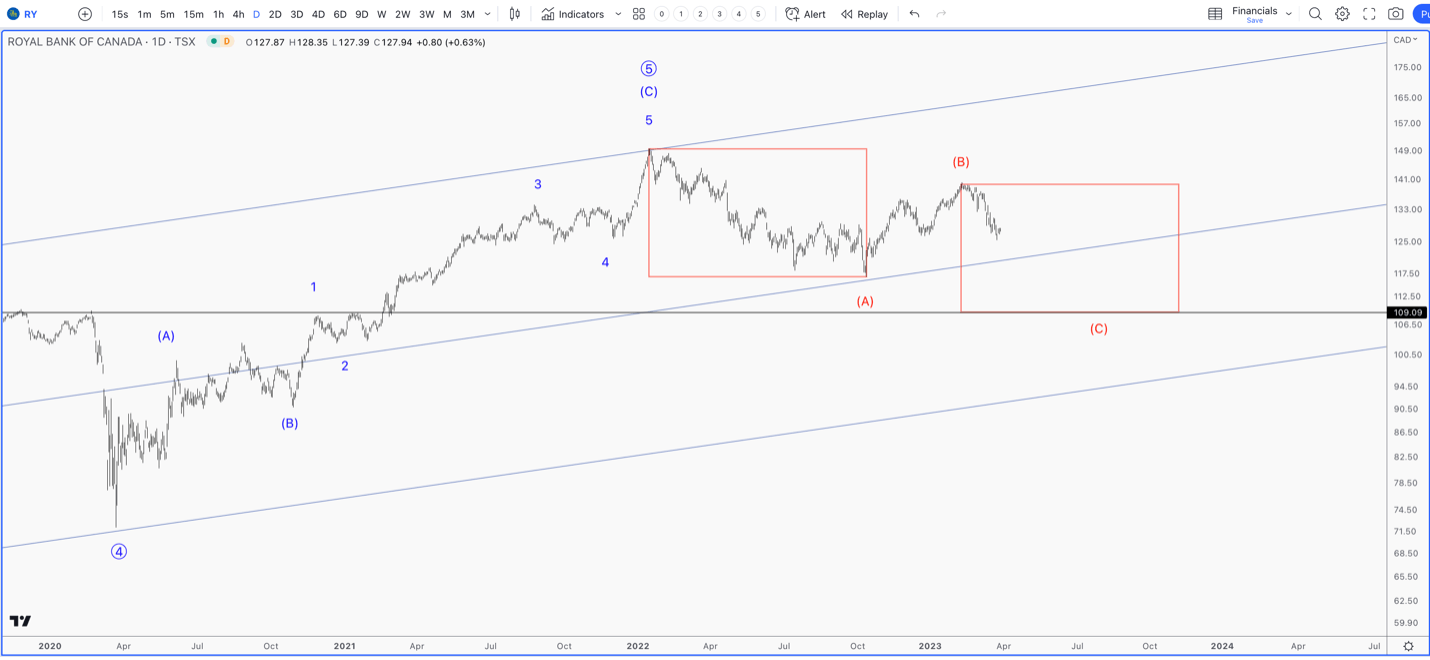
The Royal Bank of Canada (YT) looks a lot like some of the bigger banks in the US. After completing a large 5 wave uptrend into the late 2021 high, we have an incomplete corrective pattern that should take us well below the October 2022 low.
A few additional bullets on the global banks:
- Deutsche Bank announced that they will redeem $1.5 Billion of notes due in 2028. As a result, the cost of their credit default swaps increased sharply, much like we saw with Credit Suisse prior to their collapse. European banks have been down across the board on this news, as Deutsche Bank saw a 14% drop that day, and is down ~25% from its February high.
- The French CAC has been one of the stronger indexes in Europe; however, under the hood, the banking sector is the weakest sector, much like in the US. BNP Paribas, Frances largest bank, for example, is down ~18% from its March high.
- Now, UBS is being probed and possibly sanctioned due to their support of Russian Oligarchs.
- Two of Japan’s largest banks, Mitsubishi UFC Sumitomo and Mitsui Financial, are down between 14% - 17% from March 9th.
- The largest bank in Australia, the Commonwealth Bank of Australia, is down ~13% since March 14th, while England’s largest bank, HSBC, is down ~14% since late February.
- Itaú Unibanco, Brasil’s top bank, is down ~15% since late February and over 25% since last November.
The point is that whatever is unfolding in the banking sector is not localized to US regional banks, and is certainly a global concern. The more uncertainty in the centralized banking system, the more that Bitcoin will fulfill its true purpose.
In our last free article, we discussed that inflation pressures are still quite high, especially within the service sector. Evidence is building that crude and gasoline are looking to breakout to higher levels, which was confirmed with OPEC announcing surprise production cuts this week.
Sign up for I/O Fund's free newsletter with gains of up to 221% -Click here
While the market is pricing in a FED pivot, we are getting mixed messages from the prior hawkish FOMC statement and a dovish speech that followed by the FED chair. If energy does break out, as we believe it will, we could see an unexpected inflation impulse at the worst time. With a Global Debt-to-GDP sitting at 338%, and an on-going global campaign to aggressively fight stubborn inflationary pressures, it’s no wonder that we are seeing cracks within the system.
If what the charts are suggesting does unfold, once again, most people will be confronted with the harsh reality their deposits are possibly not safe, which will only bolster the underlying purpose of Bitcoin. Not only is it a hedge against inflation, but it’s a simple and efficient means to store wealth, which can provide an alternative to gold.
Bullish Until
Analyzing price action is especially important in Bitcoin. It does not have earnings reports, and rarely has news events to move price. So, the majority of swings that we see in this asset happens based on sentiment. Because of this, it lends itself well to technical analysis. Our firm outperforms in this regard with active management and real-time trade alerts.
The big picture has Bitcoin starting its final 5th wave of a large degree uptrend that started in late 2018.
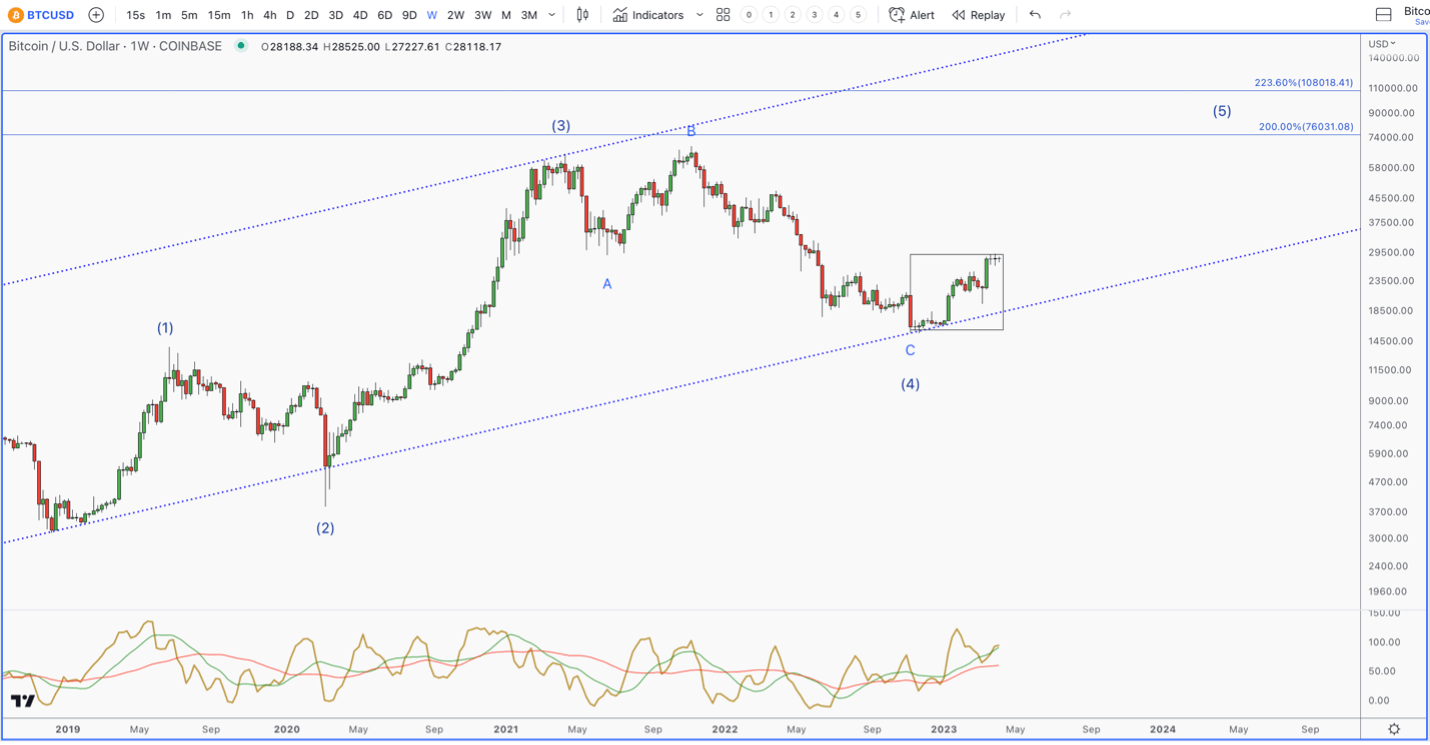
This will remain my thesis as long as any weakness holds above $19,550. We’ll now zoom in on the current uptrend, which is the boxed off region on the chart above.

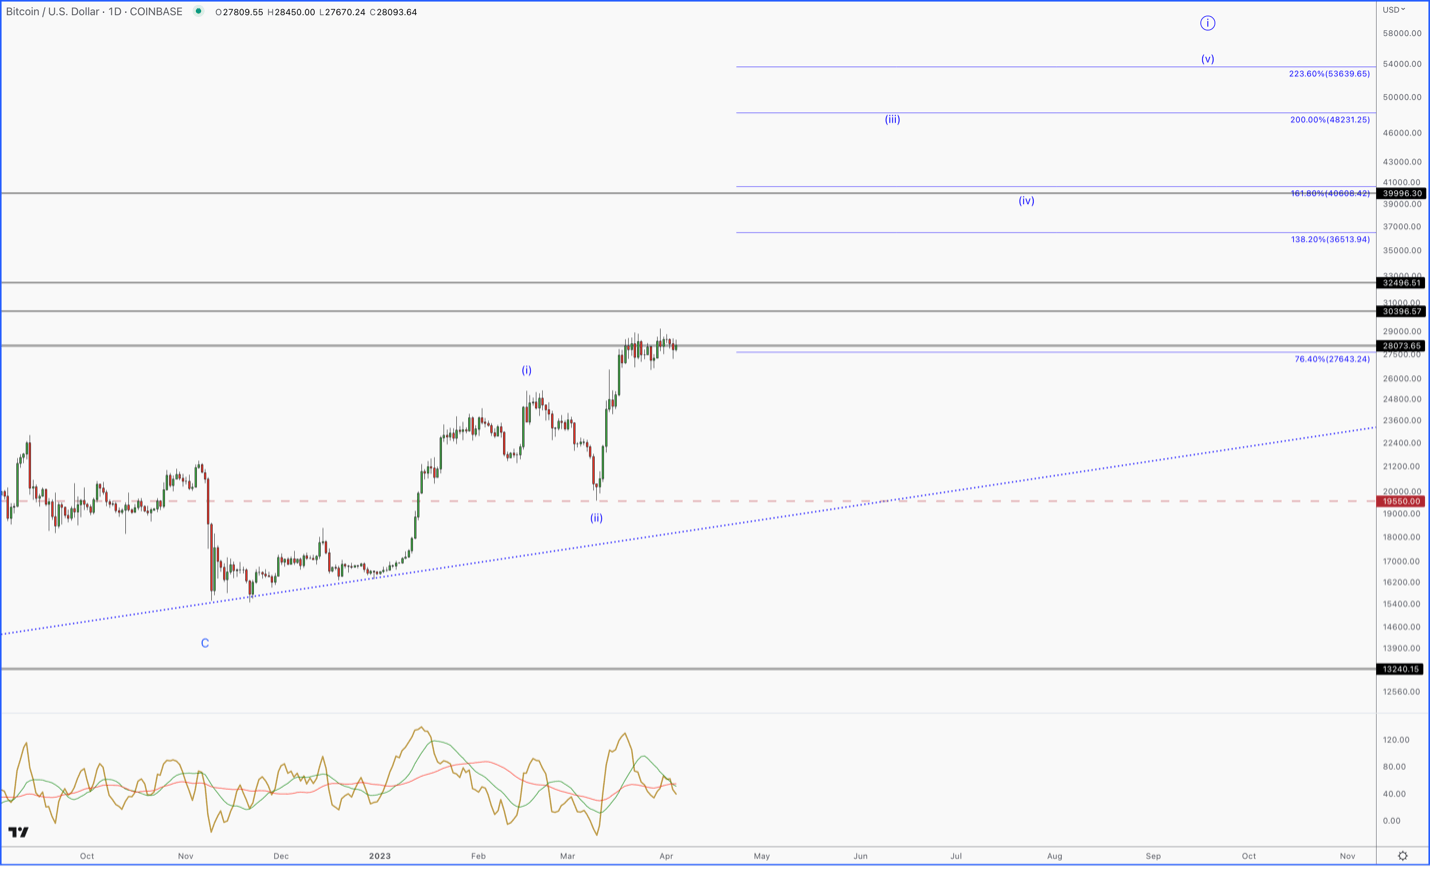
What you can clearly see is a completed 5 wave pattern off of Bitcoin’s low. This is usually bullish. As long as $19,550 holds, any breakout above the current consolidation would be considered a buy from our analysis.
On-Chain Analysis
Our risk management partners, WealthUmbrella, are a team of AI and Machine Learning engineers and professors who have spent months analyzing all of the on-chain metrics in Bitcoin. The net result of their research led to a rather advanced risk-on/risk-off signal available to retail investors. The below analysis is the conclusion from their research.
We previously mentioned that many of our on-chain indicators suggested that the November 2022 low might be the cyclical bottom. Since then, the price surge in Bitcoin has confirmed this low, as we have now moved into what we call the “green environment.”
This environment has historically been where we see the start of a new cyclical uptrend. In such an environment, it's generally better, from our research, to stay in the market. However, just because we believe that the bear market is likely over, doesn't mean we are ready for a moonshot. Historically, once we initially move into our green environment, what follows has typically been quite uneventful. We tend to see price action trade sideways-to-up for many months with relatively low volatility.
This doesn't mean that, given the context, we couldn't see another black swan event interrupt the green environment. We saw this when COVID suddenly pushed us back into our “red environment” in 2020. This was an unusual event that is accounted for in probabilities, which are historically low.
That being said, now that we have a nearly 90% increase from the November low, we must conclude that this appears to be more than just a bear market bounce. In fact, many of our on-chain metrics (InvestorCap, RealizedCap, ThermoCap) are now out of their bottoming zone. This is telling us that the overall ecosystem's economic has recovered significantly.
What Our On-Chain Metrics Are Signaling
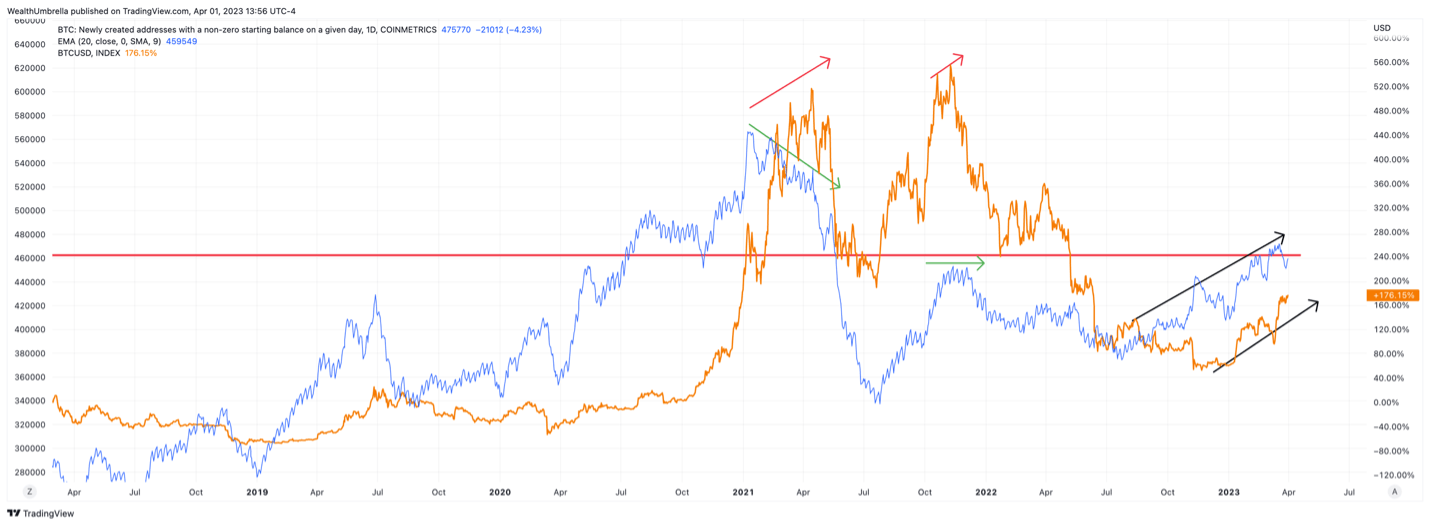
There is a popular saying in finance - “when there is no one left to sell, there is only direction the asset can go” Interestingly, this saying can be quantified through analysis of on-chain metrics and patterns. One way to monitor this is by looking at the number of newly created BTC addresses.
After the 2018 bear market, large upward moves in price were accompanied with a sharp increase of first time buyers in Bitcoin. The below chart measures newly created Bitcoin addresses with a starting balance of $0 (in blue) compared to Bitcoin’s price (in orange).
After a small dip in price in late 2021, we returned almost to the local high, but this time the number of new addresses decreased significantly. The same pattern occurred with the 2020 cyclical top, which saw a progressive loss of interest from newcomers. However, this is currently not the case, as we continue to see an upward trend in this metric in sync with the price action.

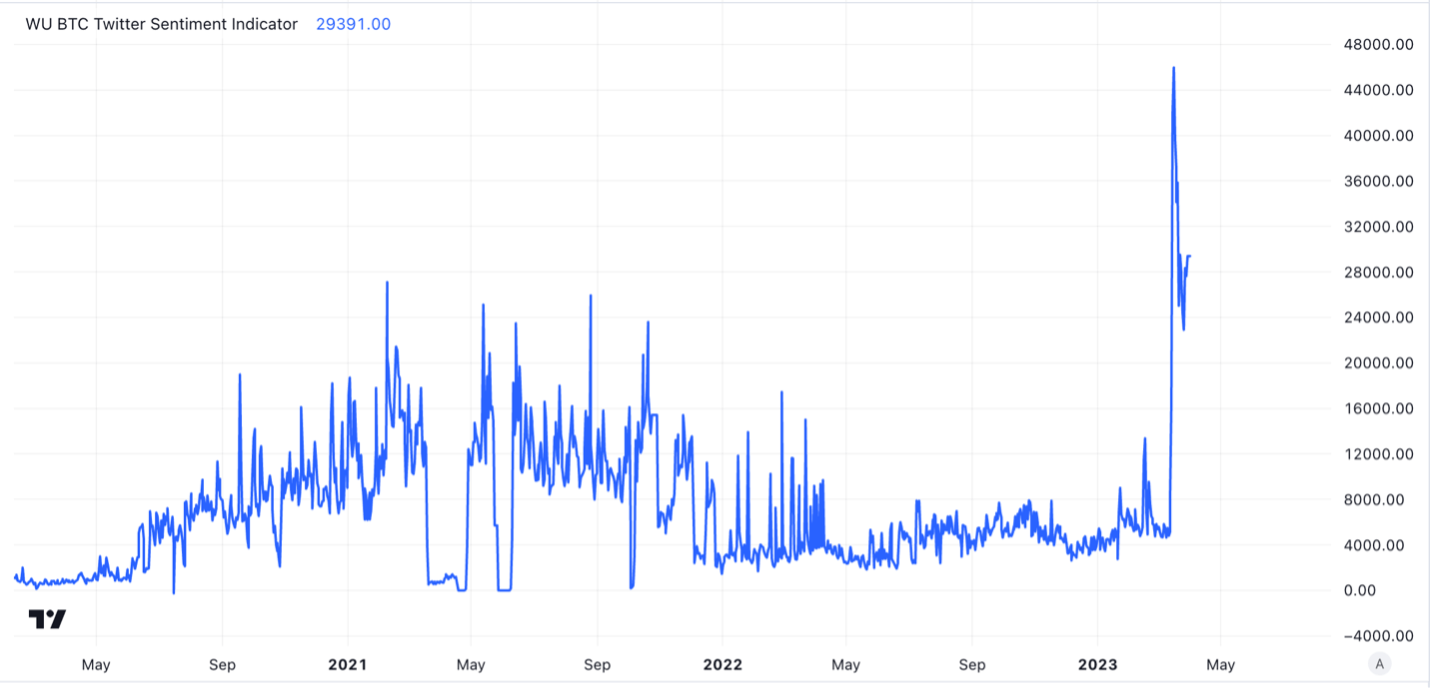
This increase in interest with Bitcoin is being accompanied with the largest spike in net positive posts about Bitcoin. Our Bitcoin Twitter Sentiment indicator recently clocked all-time record of 46,000 net positive Twitter posts about Bitcoin on March 16th, which was around the time the banking crisis in the US was at its peak.

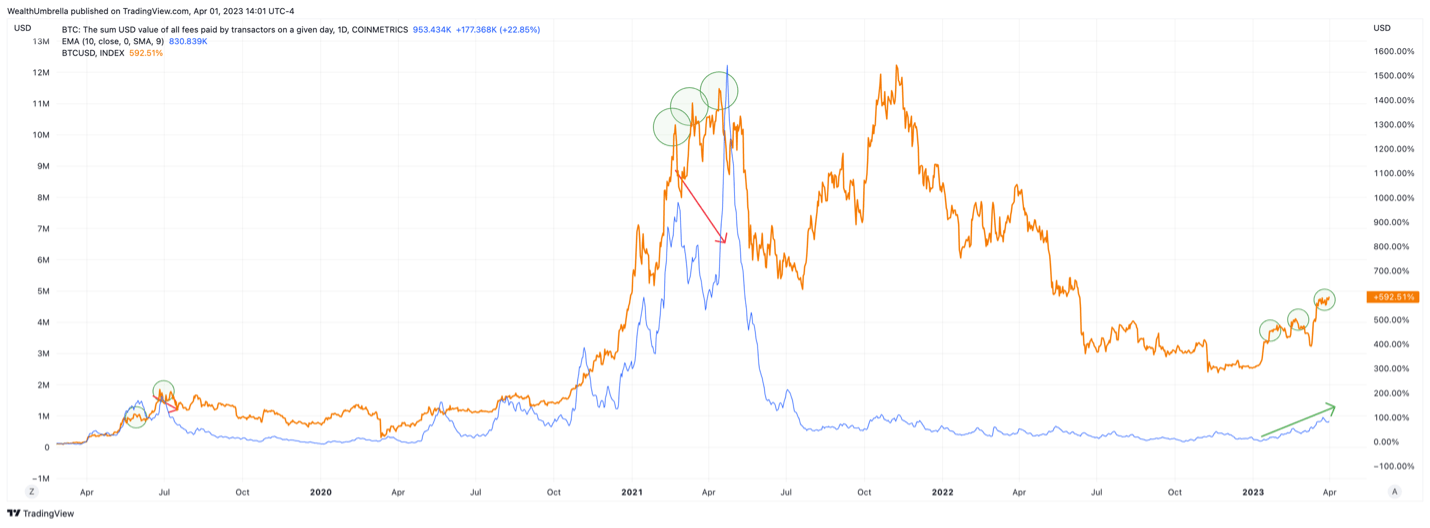
Another interesting pattern can be found by analyzing the daily cost in US dollars to complete a Bitcoin transaction. Usually, as the price of Bitcoin rises, the cost to complete that transaction rises as well. Near a top, these fees often diverge and trend downward while the price continues higher. This is caused by fewer transactions being processed on the network. The current setup regarding this metric is supporting the bullish narrative, as both the price and this metric are trending in the same upward direction.
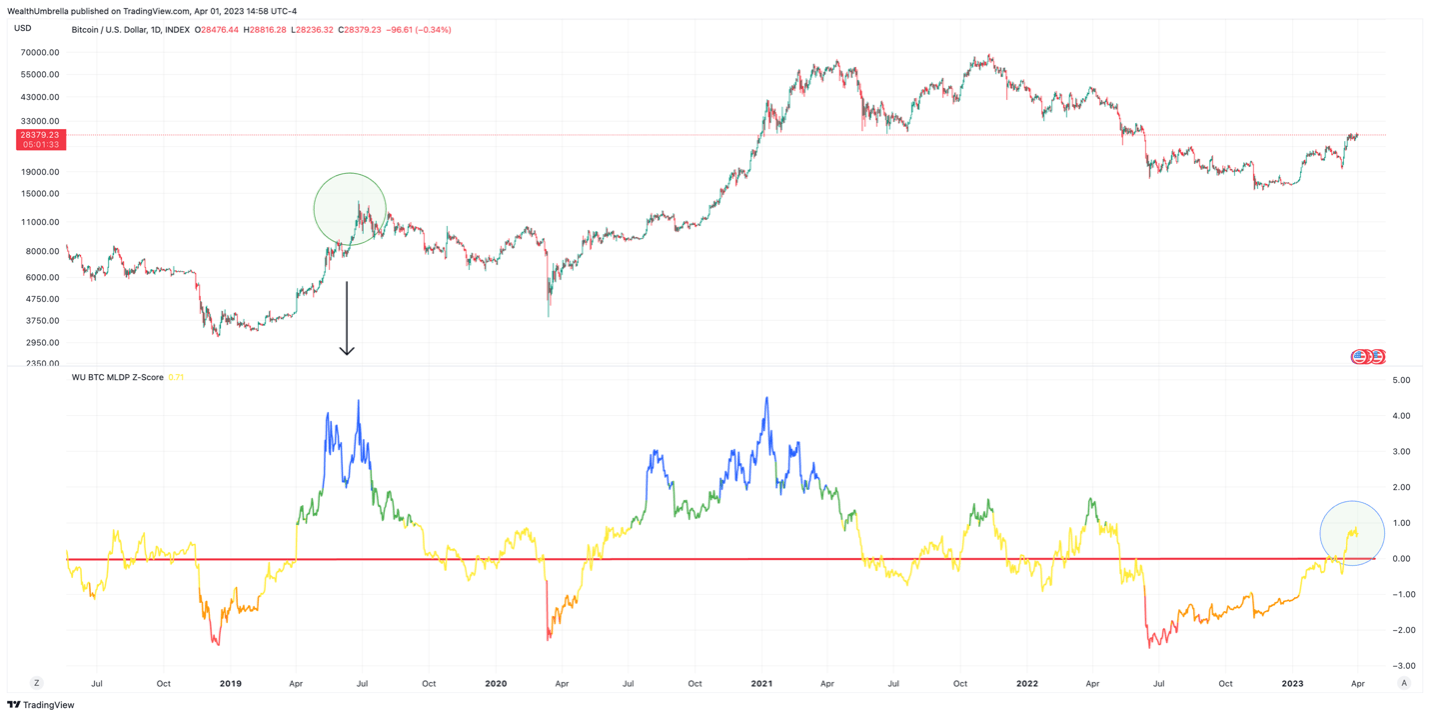
One of our personal metrics that we created to help us identify normal overbought/oversold conditions vs. cyclical tops/bottoms is called the Metcalfe Law premium/discount metric. This indicator is telling us that Bitcoin is currently priced just slightly above its fair value, and that it has ample room to run before we should get concerned.

Another interesting phenomenon going on right now is that as price has been pushing up, we consistently made new all-time highs in the percentage of supply that hasn't moved in more than a year. This is encouraging because it not only signals a reduction in Bitcoin’s supply, but follows the same pattern we have seen throughout history during each significant price increase in Bitcoin.
When Bitcoin starts to rise, this number tends to rise with price, further decreasing supply. As of recently, 68.09% of the supply in Bitcoin hasn't moved in more than a year, which is encouraging.
Also worth noting, the supply that hasn’t moved in over a year came down to 67.17% on Thursday, March 30th, 2023, due to a whale dumping around 20,000 bitcoins.

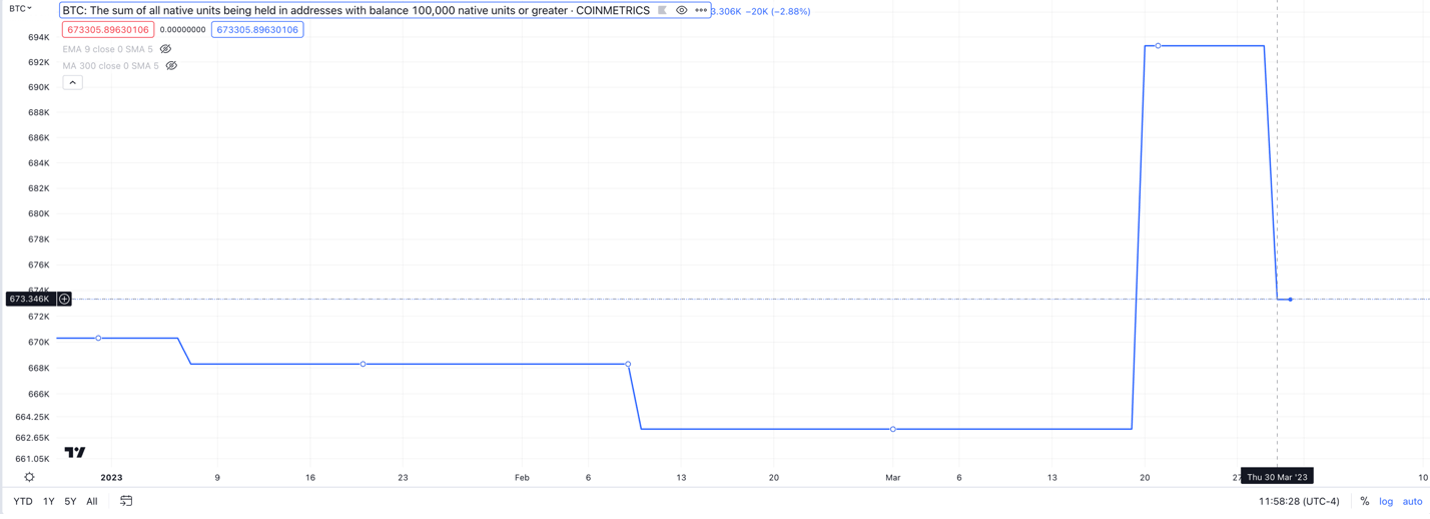
Our analysis confirmed that this was sold for a significant loss. There is something strangely bullish about a whale dumping a large amount of Bitcoin at a loss, and the market barely dipping, then recovering within a day. Similar significant dumps have previously resulted in massive downward moves that continued for weeks.
Conclusion:
In Conclusion, according to Bitcoin’s creator, the asset’s true purpose is to solve the inherent risks within a centralized banking system. We have had no reason to truly question the need for this thesis in 13 years. However, recent bank failure, coupled with concerning financial charts around the world, could be confirming the potential realization of this original thesis. We believe that if this banking crisis spirals, it will be the catalyst for Bitcoin to push higher. Interestingly, this narrative is being supported with on-chain analysis and technical analysis pointing in the same direction.
As long as WealthUmbrella’s signal stays in the “green environment” and price holds above $19,550, we will continue adding carefully to our Bitcoin position with real-time trade alerts sent to our research premium members.
What's next
My team’s impeccable track record on Bitcoin dates back to when we first launched our service in 2019. We’ve held Bitcoin at high allocations with the confidence that we will know when it’s time to add or time to trim substantially.

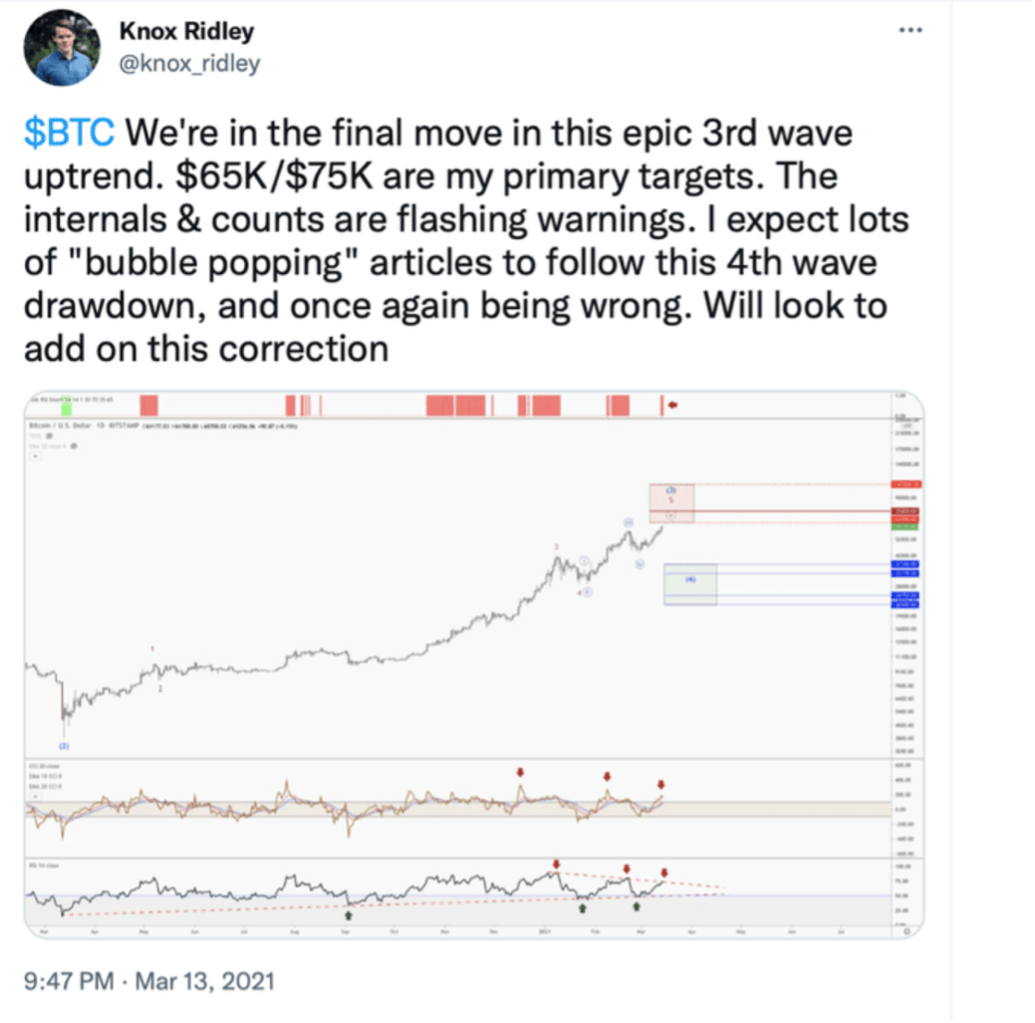
Twitter post: https://twitter.com/knox_ridley/status/1370959682584543237
This helped us announce an audited cumulative return of +47% through 2022 when most all-tech portfolios were negative during the same time period.
Next Thursday, 4/13/23, at 4:30 pm Eastern, I will be holding a webinar for premium members to discuss the I/O Fund portfolio, plus if we will be buying, selling or hedging according to broad market signals and our automated hedge.
Not only did we identify a strong buy signal in Bitcoin in December, but we also identified Nvidia’s bottom in October. Bitcoin is a leading asset YTD in the market, and Nvidia is the leading stock in the S&P 500. We take gains often and we discuss this in our weekly webinars and on our premium site. Our automated hedging signal was developed by WealthUmbrella. All of this is offered in our premium service.
WealthUmbrella team contributed to this article.


More To Explore
Newsletter

Nvidia, CXL, and the Battle to Improve AI Inference Economics
This is Part 2 of our two-part series on AI inference economics. In Part 1 — Why Nvidia's Next AI Battle Is About Tokens per Watt, we laid out why tokens per watt has become the defining metric for in

Why Nvidia’s Next AI Battle Is About Tokens per Watt
As hyperscalers move from building AI infrastructure to monetizing it, tokens per watt helps to reflect if revenue is scaling and if profitability is improving. Offload engines can increase tokens per

Micron Is Up 900%. Here’s Why the AI Memory Trade May Still Have Room to Run
Over the past 10 months, memory chip stocks have gone from being solid beneficiaries of the AI boom to capturing a massively outsized piece of the return pie. The inflection in Micron’s performance de
Why the S&P 500 Shrugged Off the Iran War — and What Could Finally Break the Rally
On February 28th, the U.S. went to war with Iran, and the market was handed the kind of shock it hasn't contended with for years. The conflict set off a chain reaction across the region: an ongoing su
Nvidia, CoreWeave, and Nebius: Inside the Circular Financing of the GPU Boom
Neoclouds are one of the more hotly debated AI business models, with CoreWeave and Nebius being the two most widely recognized names. These companies have seen their sales, backlog, and share prices s
AMD, Nvidia, Arm, Intel: Inside the $120 Billion CPU Gold Rush
CPUs have gone from an afterthought to becoming the AI trade’s next great bottleneck – and with AMD, Nvidia, Arm and Intel circling a market that is doubling nearly overnight, the only question left i

Google TPU v8 vs Nvidia: How Inference Is Rewriting the AI Market
In April, Google announced it would begin selling its TPUs to select third-party data center operators, which is something the market has anticipated for nearly a decade. The TPU-versus-Nvidia-GPU deb

The AI Networking Stock That Beat Nvidia by 7X YTD for Returns of 135% YTD
AI networking stock Lumentum is among the key I/O Fund winners in 2026. We allocated heavily to LITE in January—a month before Nvidia backed the company. While most investors couldn’t stomach taking a

Bloom Energy — Our 2026 Top Pick Was the Best Performing Stock in April
April was the best month in six years for the Nasdaq-100. The single best-performing large-cap stock wasn't Nvidia, Microsoft, or Meta. It was Bloom Energy, up roughly 109% in one month. As you'll rec

Inside Nvidia’s $4B Optical Strategy—and Why CPO Changes Everything
Within the AI investment theme, there is nowhere that the supply chain shifts faster than in networking, leading companies to gain content on new platforms or lose incremental share. The reason is str
