I/O Fund’s Fintech Q4 2021 Earnings Overview
February 11, 2022

I/O Fund
Team

Fintech companies aim to disrupt traditional finance and with our worlds increasingly going digital, it makes sense that traditional finance is also moving online. There are multiple different innovations that have taken place, from digital payments to using A.I. to better price credit risk.
We are in the middle of the Q4 fintech earnings period, and there have been a handful of fintech companies that have reported already, most notably PayPal. PayPal disappointed when its guide came in below expectations. The company cited weakness in lower income cohorts, and explained on its Q4 conference call that while spending was strong during the Q4 holiday season, it has since stagnated in 2022. This led the company to reduce its guide that it had originally issued in November.
This negative commentary was offset by Bill.com, which reported strong Q4 results, driven by strength in small and medium businesses. Bill.com reported its fourth consecutive quarter of accelerating topline growth, which suggests that SMB are performing strongly.
In the discussion that follows, I give an overview of the fintech space and outline key metrics that investors should be aware of heading into Q4 earnings.
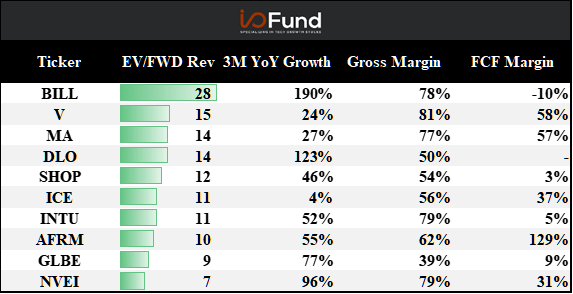
Fintech: Top 10 EV/FWD Revenue Multiples
Below we ranked fintech stocks based on their EV/NTM sales multiples. Bill.com (BILL) ranks the highest, as the company has reported a series of strong results in recent quarters. For instance, sales have accelerated for four consecutive quarters, even after adjusting for acquisitions. As mentioned above, the company has done well with its primary cohort of small-medium businesses, suggesting that business activity continues to be robust beyond enterprises.
Global payment processors Visa (V) and Mastercard (MA) also sport premium multiples, likely due to their payment duopoly. However, it is noteworthy that Visa and Mastercard underperformed in 2021, as investors may be wary that the pair will be able to keep their relatively high fees. For example, Amazon has stopped accepting Visa credit cards in the U.K. over a dispute over payment fees. Amazon controls over 40% of e-commerce, so the ecommerce giant may be able to pressure the duopoly to reduce fees.

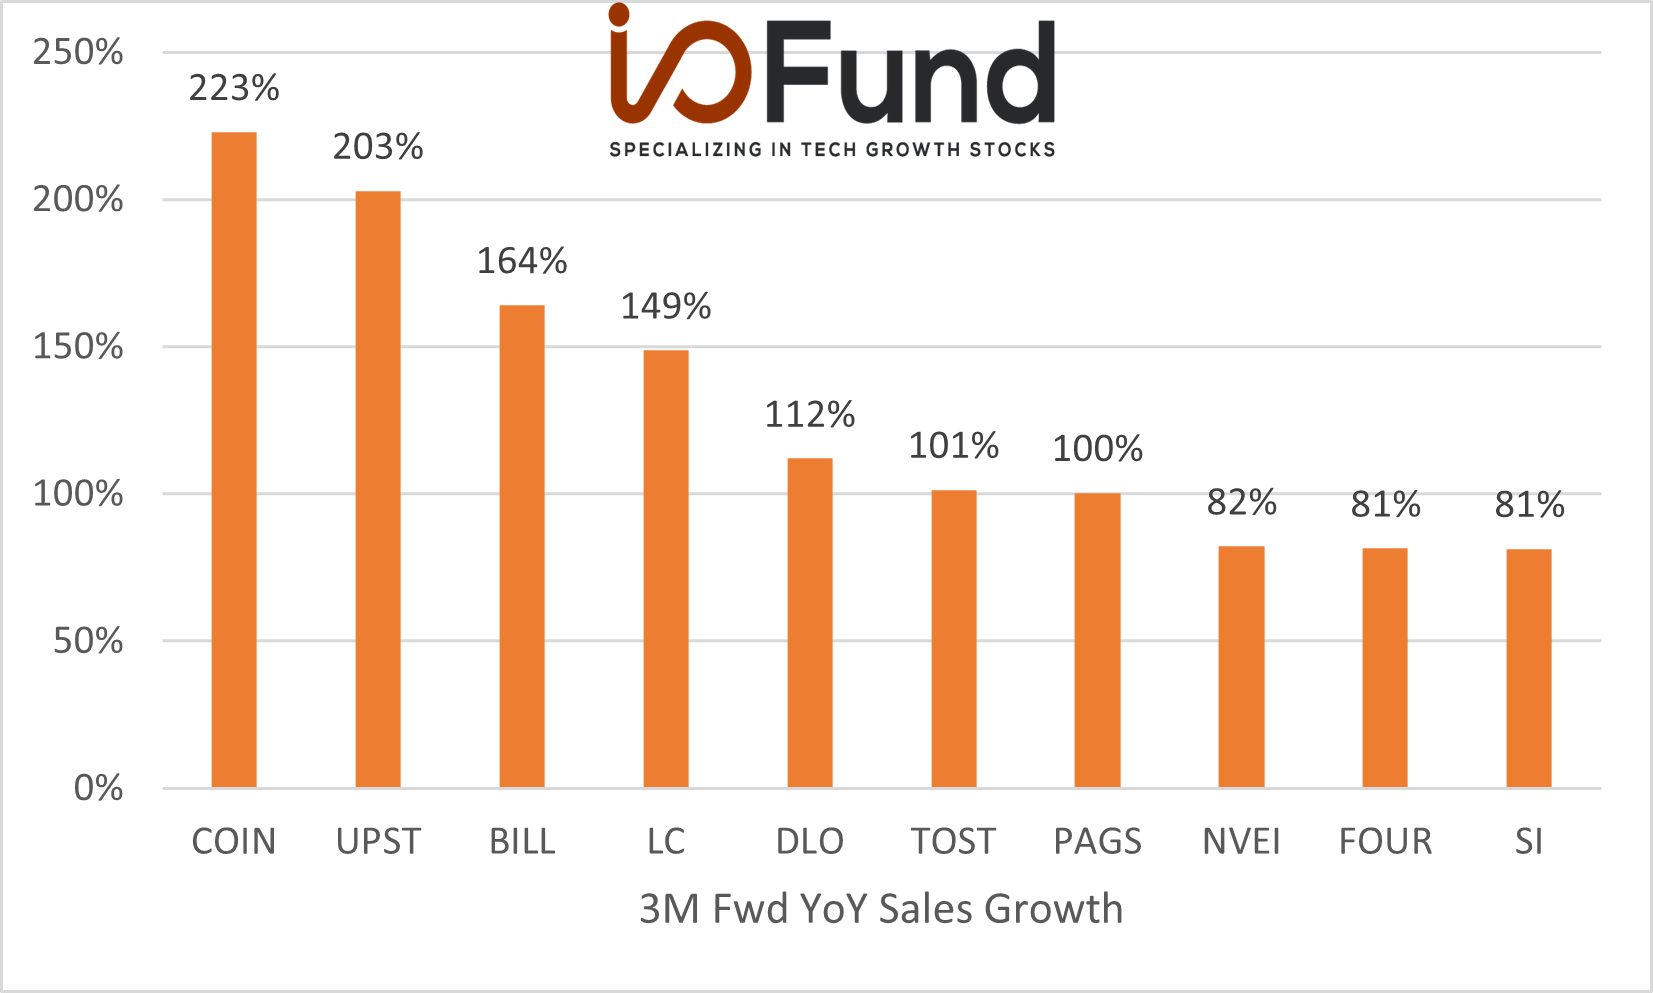
Fintech: Top 10 Three-month Forward YoY Growth Rates
Below is a chart of fintech stocks that are expected to grow sales the fastest in the upcoming quarter. Looking forward, Upstart (UPST) is expected to grow sales 203% YoY in Q4, which is well above peers but slightly slower than its Q3 growth rate of 262%. Upstart’s growth has benefitted from bank partnerships, which utilize Upstart’s AI-driven lending platform to originate loans. The company primarily originates personal and auto loans, which have seen strong growth in recent months. The New York Federal Reserve recently released its quarterly report on household debt and credit, which highlighted that Auto loans and personal loans were both up $15 billion sequentially and that delinquencies had also declined across the different loan categories, highlighting the favorable macro environment for Upstart.
Sign up for I/O Fund's free newsletter with gains of up to 1100% - Click here
Coinbase (COIN) is also expected to grow over 200% in the upcoming quarter, as trading volume on the cryptocurrency exchange has exploded this year, with trading volumes up over 600% YoY to $327 billion in Q3 2021. Management guided for higher trading volumes in Q4 relative to Q3, driven by higher levels of volatility. Also noteworthy is Voyager (VYGVF), a cryptocurrency trading platform that is expected to grow sales over 3,000% YoY in the upcoming quarter. Voyager was excluded in the below chart for presentation reasons, because sales are growing off of a low base. However, sales are expected to grow 50% sequentially, highlighting the overall strength in cryptocurrency demand.

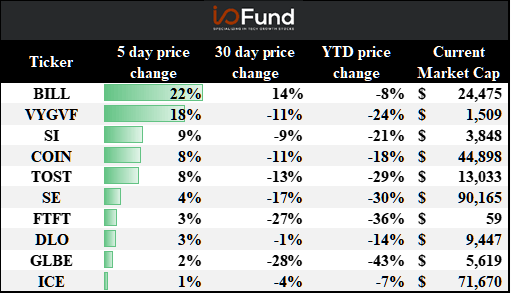
Top 10 Weekly Share Price Movements
Below is a table of the weekly change in share price for our universe of fintech stocks (as of 2/08). As mentioned above, Bill.com recently reported results and organic sales accelerated for the fourth consecutive quarter, leading to a rebound in its share price. However, Bill.com’s share price is still down year to date. In fact, most fintech stocks are down YTD, with the exception of Visa and Mastercard. Investors likely sold fast growing fintech companies in favor of ‘safer’ blue chip fintech stocks such as Visa and Mastercard. Nonetheless, fintech has started to rebound over the last week and Q4 earnings may be a further catalyst for a rebound in valuations.

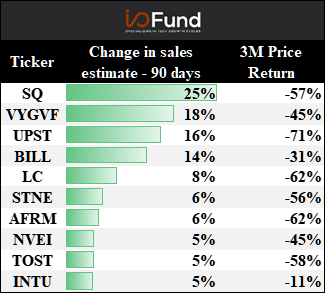
Top 10 Changes in sales growth estimates – last 90 days
The table below ranks fintech stocks by their topline revisions over the last 90 days. An increase in topline revisions signals that the Street believes that the company will grow faster than initially believed, which can result in outperformance. Block Inc. (SQ) has had large revisions, in part due to its recent acquisition of BNPL platform Afterpay. Bill.com’s (BILL) guidance came in above expectations, leading to a higher sales estimate. It is noteworthy that Bill.com’s peer, Intuit (INTU), has also had its topline estimate increased by 5% over the last three-months. The QuickBooks software provider is likely benefitting from similar tailwinds as Bill.com, as SMB have performed well over the last few quarters.

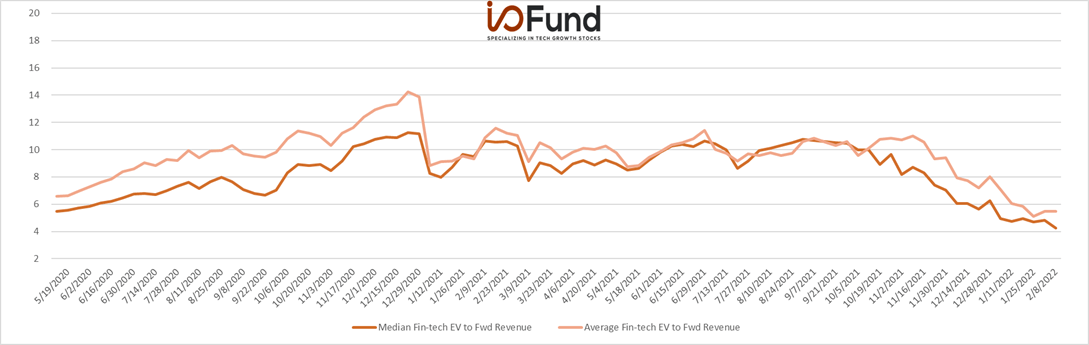
Update on EV/Fwd revenue multiples:
Overall stats:
- Overall fintech forward median: 4x
- Top 5 fintech forward median: 15x
- Overall fintech forward average: 6x
EV/FWD SALES:
As shown below, the median and average fintech EV/NTM sales multiple had been relatively static throughout 2021 but has since compressed meaningful in 2022. Valuations are now below levels they were in 2020. The market may be fearing that consumer spending will decline due to a lack of stimulus and a slowing economy. With Q4 earnings on the horizon, new information could lead to a “risk-on” environment in fintech and a rebound in valuations.

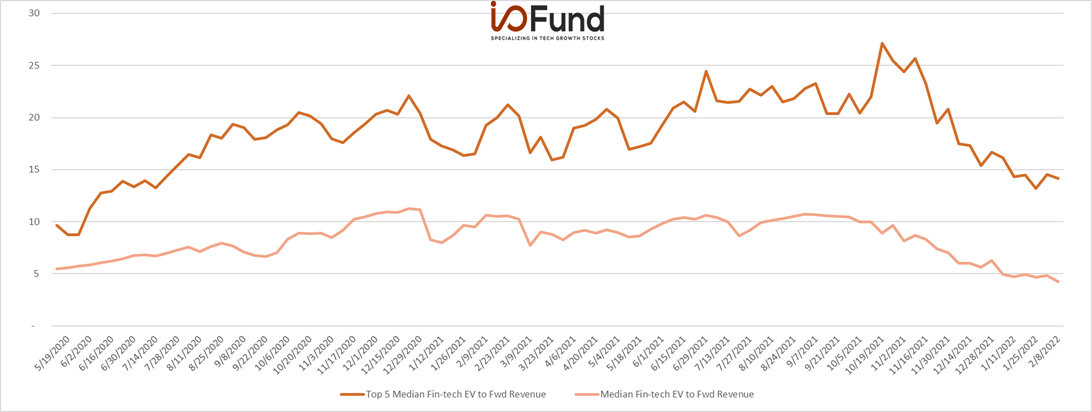
Top 5 EV/FWD SALES:
In the chart below, we can more clearly see the large dispersion in fintech valuations, as the top 5 premium valued fintech stocks have had their EV/Fwd sales multiples trend up throughout 2021 with a peak in October, followed by a general sell-off heading into 2022. Both the top 5 valued fintech stocks and the median sold off, which suggests that the sell-off was broad based and related to changing sentiment.

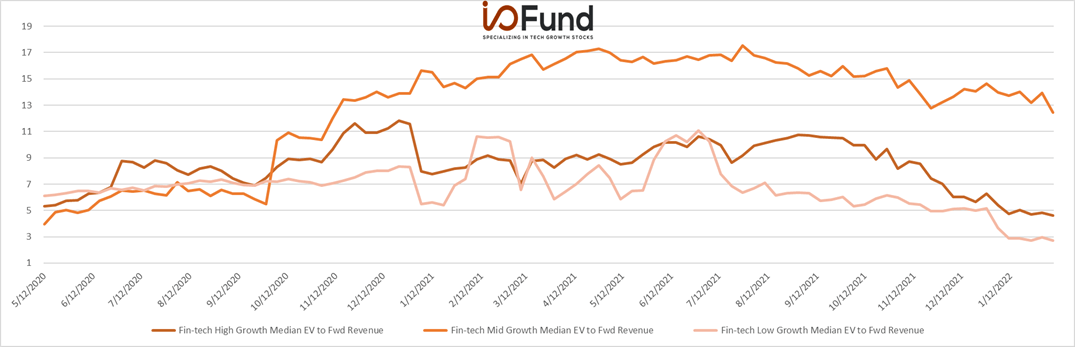
EV TO FWD Sales Growth Buckets:
We can further dissect the change in fintech valuations by breaking up the group into high growth (>30%), mid growth (>15% and <30%) and low growth (<15%). The below chart shows the historical valuations for stocks in various growth buckets. Each growth bucket has had their valuations compress since November; however, the high-growth and low-growth buckets have underperformed the mid-growth bucket. The market is likely fleeing to ‘blue-chip’ fintech stocks until it receives more information on the general health of the consumer.

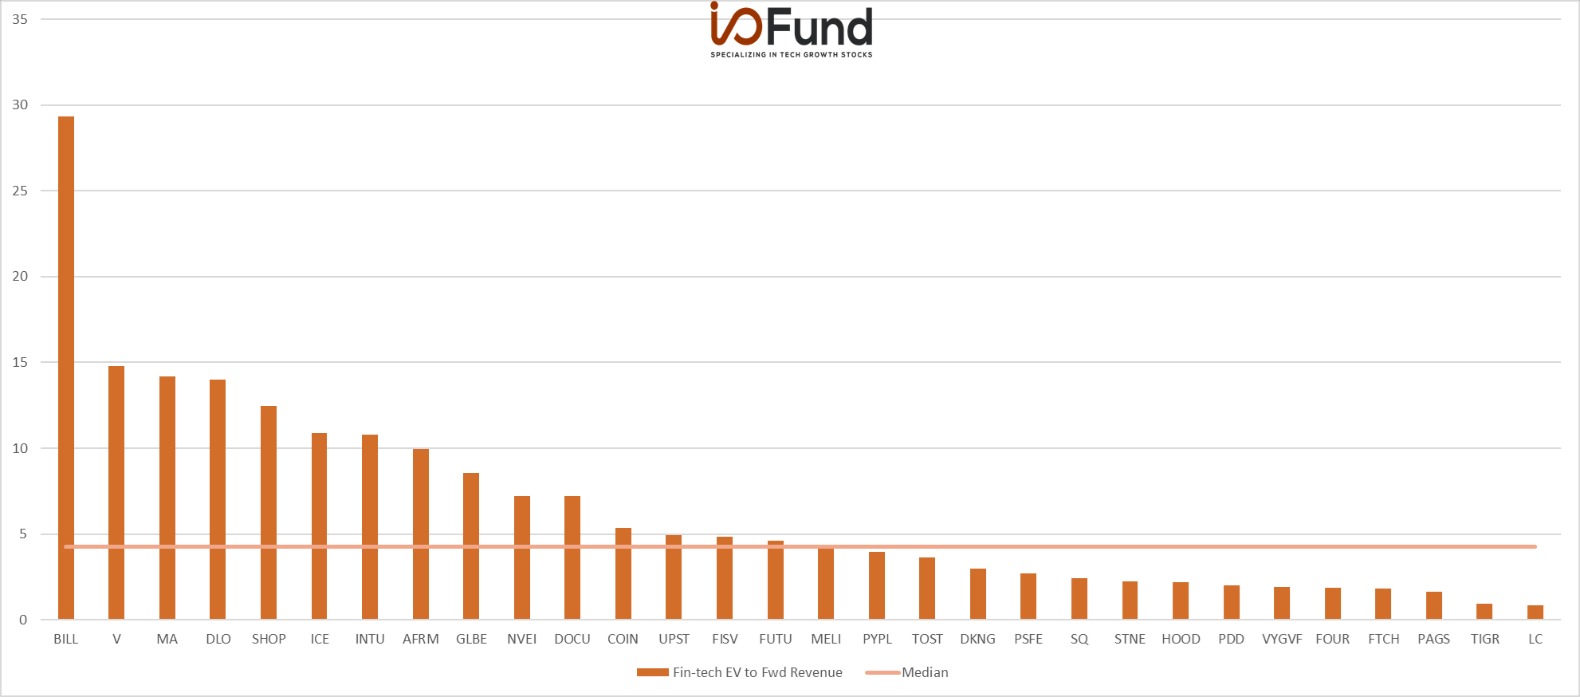
Top EV TO FWD SALES:
The below chart provides a more holistic view of fintech valuations heading into Q4 earnings, sorted by EV to NTM revenue multiples. There is a wide disparity in valuations, with companies grouped closer to the tails rather than the median. As mentioned above, Bill.com (BILL) has a premium valuation and has already reported Q4 results, which surprised to the upside. PayPal (PYPL) has fallen below the median fintech valuation based on NTM sales after its Q4 results disappointed, as management explained that spending on its platform had slowed after the holiday shopping season.

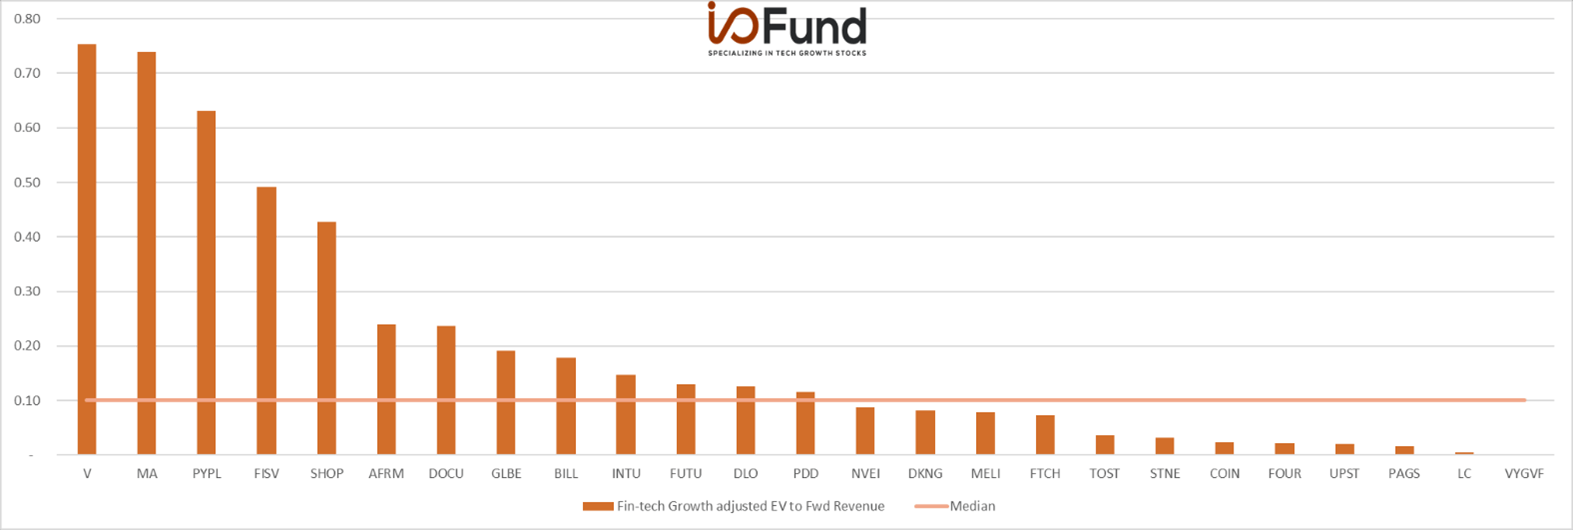
Growth adjusted EV/Fwd Revenue (EV/Fwd Rev/Fwd Growth)
The last chart is based on EV to FWD sales but also takes into account forward growth expectations. By scaling valuation relative to forward growth, we can more clearly see which companies are cheapest relative to forward growth. Companies with negative growth expectations are excluded from the below chart. A low value in the below chart means that a company is cheap relative to growth. It is interesting to note that PayPal (PYPL) rises to a relative premium valuation after considering its forward growth. On the other hand, DLocal (DLO) falls closer to the median valuation once we consider its 112% expected growth rate heading into Q4 earnings.

Finally, the last table we will be discussing includes aggregate fintech operating metrics. The below table illustrates the median topline growth, margins and FCF generation for the fintech industry. The median growth rate was 60%, and the market expects the median fintech stock to grow sales by 42% YoY next quarter. Median gross margins were 54% and the median free cash flow margin was 9%.

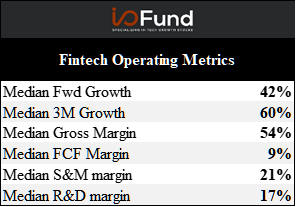
As shown above, the overall fintech space appears to be healthy, with high growth rates and strong margins. This provides support for a rebound in valuations heading into Q4 earnings. The I/O fund will be watching this industry closely heading into Q4 earnings. Find out what the Street is saying about fintech stocks headed into Q4 earnings in our I/O Fund’s preview of 7 Fintech stocks for Q4 Earnings.
The I/O Fund is a team of analysts that share their research publicly as they build a portfolio of 30 stocks. Our team has record results for a retail Fund and we also have four-digit gains on some of our free newsletter coverage. You can learn more about our premium service by clicking here or sign up for our free newsletter here.
Disclaimer: This is not financial advice. Please consult with your financial advisor in regards to any stocks you buy.


More To Explore
Newsletter

Nvidia and Google Are Crowding TSMC’s N3 Node - Can Intel Fill the Gap?
Nvidia is moving its next-generation Rubin GPUs from 4nm to 3nm, yet Google’s latest TPUs are already on N3 and are expected to remain there. Meanwhile, a growing number of AI CPUs from Nvidia, Amazon

Intel vs TSMC: How CoWoS Packaging Constraints Could Create an Opportunity for Intel Foundry
Taiwan Semiconductor (TSMC) is the single, most important company to the AI industry. However, to compete with the incumbent, Intel does not need to beat TSMC at leading-edge manufacturing. It only ne

Big Tech’s Free Cash Flow is Turning Negative – Who's Next?
Big Tech’s AI revenue is accelerating, but free cash flow is moving sharply in the opposite direction. Across Google, Microsoft, Meta and Amazon, capex is rising much faster than operating cash flow a
Big Tech Earnings Preview: Is AI Monetization Finally Catching Up to Capex?
The most pronounced difference between 2026’s tech rally compared to rallies in the past is which companies have been left out of it. The names most associated with the AI trade have hardly participat
Nvidia, CXL, and the Battle to Improve AI Inference Economics
This is Part 2 of our two-part series on AI inference economics. In Part 1 — Why Nvidia's Next AI Battle Is About Tokens per Watt, we laid out why tokens per watt has become the defining metric for in
Why Nvidia’s Next AI Battle Is About Tokens per Watt
As hyperscalers move from building AI infrastructure to monetizing it, tokens per watt helps to reflect if revenue is scaling and if profitability is improving. Offload engines can increase tokens per

Micron Is Up 900%. Here’s Why the AI Memory Trade May Still Have Room to Run
Over the past 10 months, memory chip stocks have gone from being solid beneficiaries of the AI boom to capturing a massively outsized piece of the return pie. The inflection in Micron’s performance de

Why the S&P 500 Shrugged Off the Iran War — and What Could Finally Break the Rally
On February 28th, the U.S. went to war with Iran, and the market was handed the kind of shock it hasn't contended with for years. The conflict set off a chain reaction across the region: an ongoing su

Nvidia, CoreWeave, and Nebius: Inside the Circular Financing of the GPU Boom
Neoclouds are one of the more hotly debated AI business models, with CoreWeave and Nebius being the two most widely recognized names. These companies have seen their sales, backlog, and share prices s

AMD, Nvidia, Arm, Intel: Inside the $120 Billion CPU Gold Rush
CPUs have gone from an afterthought to becoming the AI trade’s next great bottleneck – and with AMD, Nvidia, Arm and Intel circling a market that is doubling nearly overnight, the only question left i
