I/O Fund’s Semiconductor Q4 2021 Earnings Preview
January 21, 2022

I/O Fund
Team
TSMC broke off Q4 semiconductor earnings after it reported on 01/13/22. Sales at the massive foundry pure play grew 21% YoY in Q4, and net income increased 16%, setting the stage for a strong earnings season for the semiconductor industry. In the analysis that follows, I give a brief overview of the semiconductor industry and discuss key metrics that investors should be aware of heading in Q4 earnings.
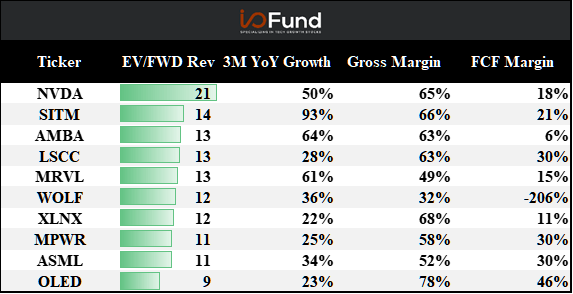
Semiconductors: Top 10 EV/FWD Revenue Multiples
Below is a table of semiconductor stocks ranked by their EV/1-year forward sales multiples, along with their most recent YoY growth rate, gross and free cashflow (FCF) margins. Semiconductors experienced strong demand in 2021 and the market has rewarded the outperformers with premium multiples. Nvidia (NVDA) sports the highest multiple of the group at 21x, likely due to Nvidia’s dominate position with GPUs and its strong topline growth rate.
There are a cluster of other top performing semiconductor firms valued around 11x to 14x EV/Fwd revenues, such as ASML, a leading semiconductor equipment provider that has seen strong demand as capacity in the sector ramps up to address supply issues. Another standout is WOLF, which has seen strong demand for silicon carbide solutions, a relatively new technology that is being adopted by the automotive market. WOLF claims that it is the sole vertically integrated supplier of silicon carbide for high power and RF application, which likely contributes to its premium multiple.

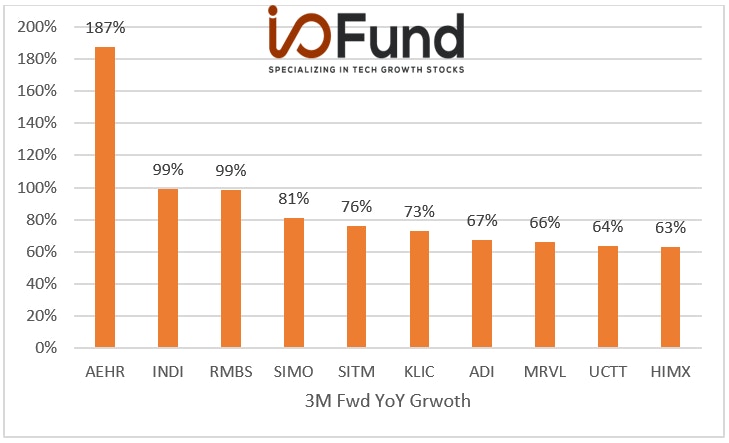
Semiconductors: Top 10 Three-month Forward YoY Growth Rates
Below is a chart of forward sales growth expectations for the semiconductor industry. Looking forward, AEHR is forecasted to grow the strongest from our universe of semiconductor stocks (n=74). The company is benefiting from tailwinds in EV and datacenter exposures, which are expected to ramp in the near term. INDI is also expected to grow strongly in the upcoming quarter as the company guided for more than 50% sequential growth heading into Q4, driven by demand for its solutions in the automotive sector and a recent acquisition. RMBS is also expected to grow nearly 100% next quarter, as demand for its memory interface chips remains strong in the current environment. Our research suggests that demand for automotive and memory solutions in the semiconductor industry are strong tailwinds heading into Q4 earnings.

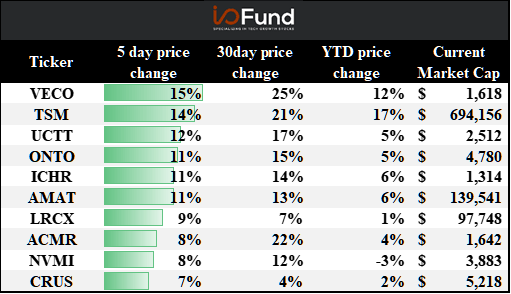
Top 10 Weekly Share Price Movements
Below is a table of the weekly change in share price for our universe of semiconductor stocks (week ended 01/14). TSM has already reported Q4 results, and the foundry pure play’s results came in strong as the company guided Q1 2022 sales to increase 8% sequentially, up from its most recent 6% QoQ growth rate. The strong guide likely led to the strong price action in TSM’s shares. Many other top performing semiconductor stocks are equipment providers, such as VECO, UCTT, ICHR, AMAT and LRCX. The market is likely pricing in increased demand for semiconductor equipment, as fab expansions lead to more equipment purchases going forward.

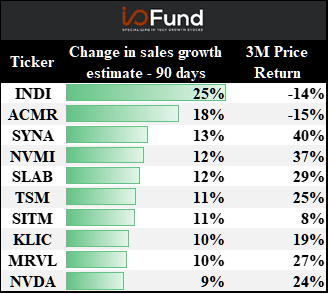
Top 10 Changes in sales growth estimates – last 90 days
The table below ranks the semiconductor companies by their topline revisions over the last 90 days. An increase in topline revisions signals that the Street believes that the company will grow faster than initially believed. INDI has had the largest topline revision in the semiconductor industry, as the company guided for 50% sequential growth, which includes benefits from its recent acquisition of TeraXion. SYNA has also had its topline estimates revised up by 13% over the last 90 days, driven in part by its recent acquisition of DSP Group, which the company explained would help it expand its ability to cross-sell AI solutions at the edge of the network. The market likely agrees with management and its share are up 40% over the last 90 days.

Update on EV/Fwd revenue multiples:
Overall stats:
- Overall Semiconductor forward median: 5x
- Top 5 Semiconductor forward median: 14x
- Overall Semiconductor forward average: 6x
EV/FWD SALES:
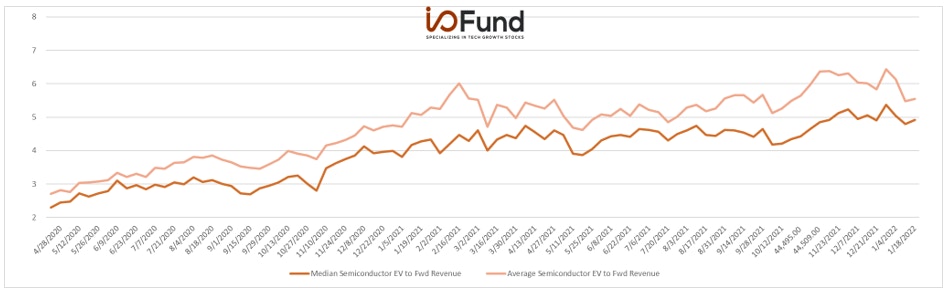
As shown below, the median and average semiconductor EV/1-year forward sales multiple has trended up since April 2020. Semiconductor valuations have increased as demand for semis has remained robust, driven by a global chip shortage. The world may be entering a new normal where semiconductors are used in everything, such as datacenters, automotive, and IoT devices. This trend reduces their cyclical nature and has likely led the market to reward the industry with a premium multiple. This will likely be a multi-year trend and if the semiconductors cycles continue to shorten, then multiples may continue to rise.
Sign up for I/O Fund's free newsletter with gains of up to 1100% - Click here

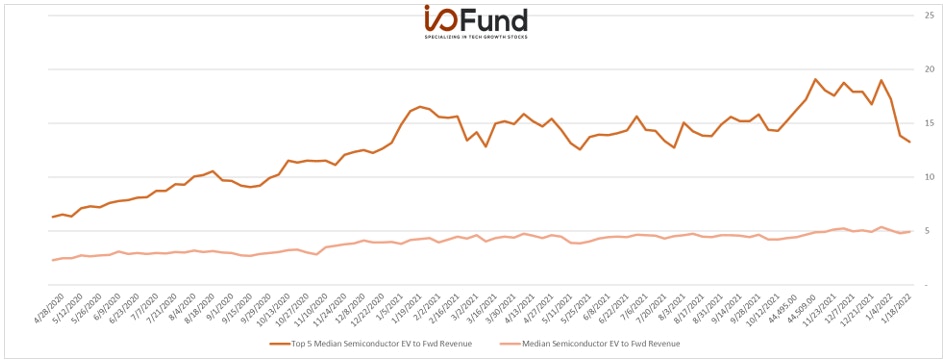
Top 5 EV/FWD SALES:
In the chart below, we can more clearly see the large dispersion in semiconductor valuations, as the top 5 premium valued semiconductor stocks have had their EV/Fwd sales multiples expand since 2020. The median multiple has also expanded, but at a slower pace. However, the delta between the top 5 and the median semiconductor stock has started to narrow in 2022, as the median valuation remained relatively static while the top 5 has had their valuations compress. If Q4 earnings come in strong, then the market may push valuations back up to their historic highs.

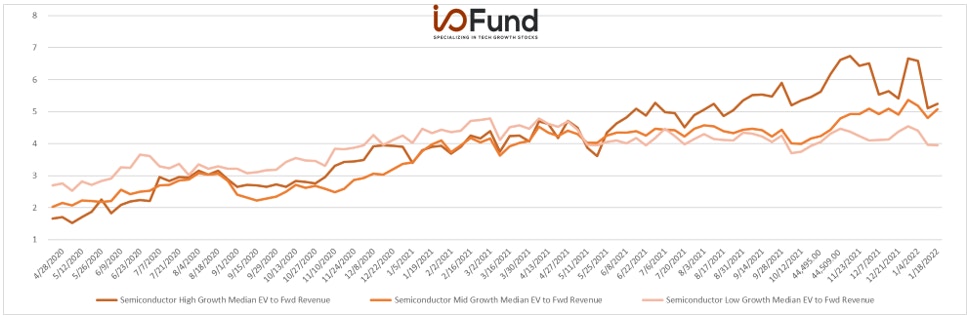
EV TO FWD Sales Growth Buckets:
We can further dissect the change in semiconductor valuations by breaking up the group into high growth (>30%), mid growth (>15% and <30%) and low growth (<15%). The below chart shows the historical valuations for stocks in various growth buckets. High growth semiconductor stocks have had their valuations compress recently relative to mid-growth semiconductors. Q4 earnings will be pivotal for the high growth semiconductors, and the market will likely reward the group with higher multiples if growth remains strong going forward.

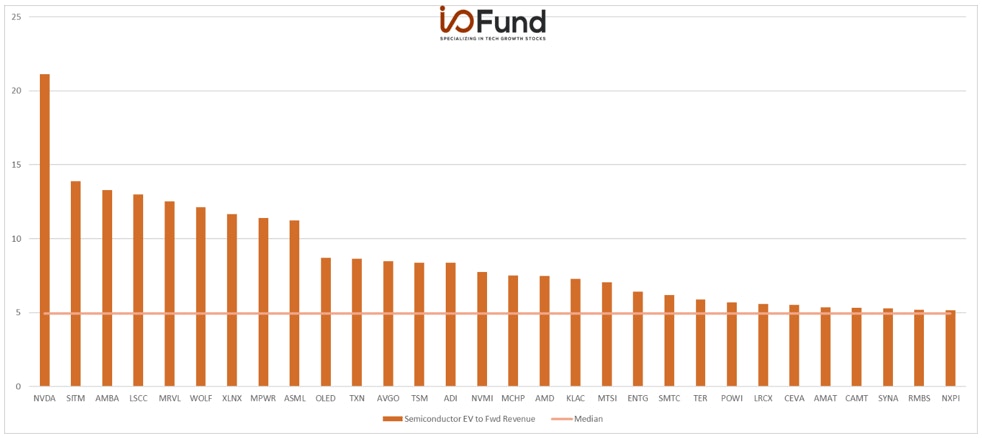
Top EV TO FWD SALES:
The below chart provides a more holistic view of the semiconductor industry ahead of Q4 earnings, sorted by their EV to Fwd revenue multiples. NVDA has the richest valuation and is valued well above the peer median of 5x. Nvidia is benefitting from multiple tailwinds, such as data center growth, gaming, cryptocurrency, and automotive. Lead tech analyst Beth Kindig outlined why she believes that Nvidia will be worth more than Apple in the future, stating that “I believe Nvidia is capable of out-performing all five FAAMG stocks and will surpass even Apple’s valuation in the next five years”.

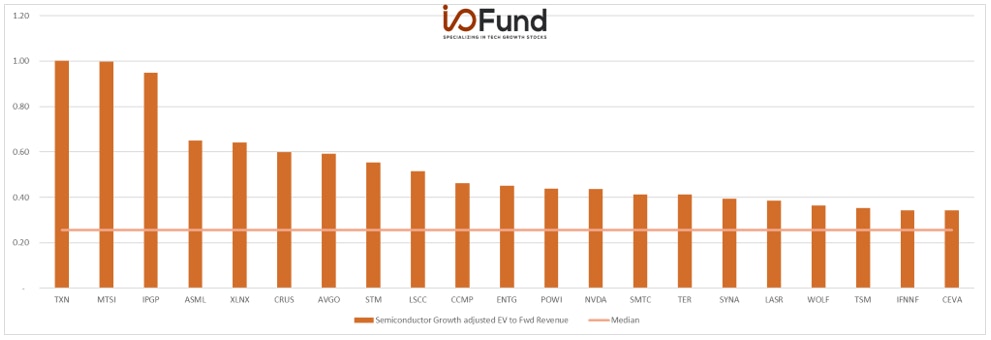
Growth adjusted EV/Fwd Revenue (EV/Fwd Rev/Fwd Growth)
The last chart is based on EV to FWD sales but also takes into account forward growth expectations. By scaling valuation relative to forward growth, we can more clearly see which companies are cheapest relative to forward growth. A low value in the below chart means that a company is cheap relative to growth. Note that some names may be skewed due to acquisitions. It is interesting to note that NVDA falls from being the richest valued semiconductor stock to closer to the median once you take into account its strong growth rate. TXN and MTSI are some of the most expensive semiconductor stocks based on this metric and others such as AEHR and KLIC are cheapest (not shown).

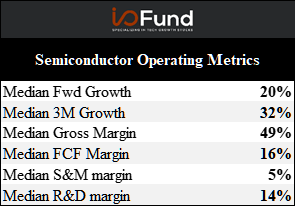
Finally, the last table we will be discussing includes aggregate semiconductor operating metrics. The below table illustrates the median topline growth, margins and FCF generation for the semiconductor industry. The median growth rate was 32%, and the market expects the median semiconductor stock to grow 20% in Q4. Gross margin remains robust at nearly 50% and cashflows are also healthy at 16% of three-month sales for the median semiconductor. Strong growth, margins and cashflows highlight the strong health of the semiconductor industry, which makes sense considering the outsized demand for chips in the current market.

Strong growth and positive cashflows signal that the semiconductor industry is healthy and performing well. The I/O Fund expects this strength to continue going forward. Find out which semiconductor stocks the I/O Fund will be watching heading into Q4 earnings in our I/O Fund’s Preview of 7 Semiconductor Stocks Ahead of Q4 Earnings.
The I/O Fund is a team of analysts that share their research publicly as they build a portfolio of 30 stocks. Our team has record results for a retail Fund and we also have four-digit gains on some of our free newsletter coverage. You can learn more about our premium service by clicking here or sign up for our free newsletter here.
Disclaimer: This is not financial advice. Please consult with your financial advisor in regards to any stocks you buy.


More To Explore
Newsletter

Micron Is Up 900%. Here’s Why the AI Memory Trade May Still Have Room to Run
Over the past 10 months, memory chip stocks have gone from being solid beneficiaries of the AI boom to capturing a massively outsized piece of the return pie. The inflection in Micron’s performance de

Why the S&P 500 Shrugged Off the Iran War — and What Could Finally Break the Rally
On February 28th, the U.S. went to war with Iran, and the market was handed the kind of shock it hasn't contended with for years. The conflict set off a chain reaction across the region: an ongoing su

Nvidia, CoreWeave, and Nebius: Inside the Circular Financing of the GPU Boom
Neoclouds are one of the more hotly debated AI business models, with CoreWeave and Nebius being the two most widely recognized names. These companies have seen their sales, backlog, and share prices s
AMD, Nvidia, Arm, Intel: Inside the $120 Billion CPU Gold Rush
CPUs have gone from an afterthought to becoming the AI trade’s next great bottleneck – and with AMD, Nvidia, Arm and Intel circling a market that is doubling nearly overnight, the only question left i
Google TPU v8 vs Nvidia: How Inference Is Rewriting the AI Market
In April, Google announced it would begin selling its TPUs to select third-party data center operators, which is something the market has anticipated for nearly a decade. The TPU-versus-Nvidia-GPU deb
The AI Networking Stock That Beat Nvidia by 7X YTD for Returns of 135% YTD
AI networking stock Lumentum is among the key I/O Fund winners in 2026. We allocated heavily to LITE in January—a month before Nvidia backed the company. While most investors couldn’t stomach taking a

Bloom Energy — Our 2026 Top Pick Was the Best Performing Stock in April
April was the best month in six years for the Nasdaq-100. The single best-performing large-cap stock wasn't Nvidia, Microsoft, or Meta. It was Bloom Energy, up roughly 109% in one month. As you'll rec

Inside Nvidia’s $4B Optical Strategy—and Why CPO Changes Everything
Within the AI investment theme, there is nowhere that the supply chain shifts faster than in networking, leading companies to gain content on new platforms or lose incremental share. The reason is str

Is Nvidia Stock a Buy? Why Semiconductor Strength May Signal a Market Top
In this report, we take a deeper look at the technical scenarios, which suggests that Nvidia’s latest high is shaping up to be a potential bull trap. That view is corroborated by the broader semicondu

Nvidia’s $20 Trillion Thesis Is Intact. My 2026 Allocation Isn't
The thesis on Nvidia's hardware moat has played out exceptionally well, but that also highlights one of the biggest risks investors face, which is becoming emotionally attached to a winning stock. Whi
