Netflix And Roku Stock: The Crucial Difference
January 26, 2021

Beth Kindig
Lead Tech Analyst

This article was originally published on Forbes on Jan 21, 2021,11:20pm EST
Netflix came in strong with the recent earnings and there is no reason to expect Roku will not also come in strong especially as Covid and stay-at-home orders have accelerated the shift towards Connected TV.
It's easy to compare Roku's roughly 50 million users to Netflix's 200 million and to assume Roku is a much smaller company or lagging the subscription behemoths, such as Disney Plus. This is a mistake as the ad-based video-on-demand (AVOD) market is a newer market than subscription-video on demand (SVOD). The AVOD market is distinguished from SVOD because it's primary driver is pay-TV ad dollars rather than the cord-cutting trend or subscribers.
About $10 billion is spent on Connected TV ads compared to $70 billion on pay television ads in the United States alone. Pay-TV ad spend is now expected to decline by 15% to $60 billion this year due to the postponement of live sports and also due to an increase in cord-cutting from covid.
Here's something to consider – cord-cutters aren't going back to cable, and this places Pay TV ad budgets in a dilemma. These budgets have not cared much for mobile or desktop. Despite the sheer number of data scientists and (frightening) level of behavioral targeting used by Google and Facebook, Pay TV has held on to an impressive level of ad spend at about $70 billion in 2019 compared to $87 billion on mobile. One reason is that advertising on the television is more effective – no amount of data collection can change the video completion rate achieved when you're sitting in your living room.
Although these budgets have not migrated to mobile or desktop in the past, those advertisers now have an opportunity to use data to personalize the advertising while viewers are in their living rooms. Roku and AVOD are the best of both worlds – combining data for targeting and high completion and viewability rates — and this creates a unique market from SVOD. For reference, completion rates on Connected TV ads are as high as 97% with 100% viewability, according to a study by Benchmark.
Below, I review Netflix's earnings as it's essential to keep an eye on exactly how long a winner can run in the OTT media category. I also review Roku's upcoming earnings and what to look for.
Sign up for I/O Fund's free newsletter with gains of up to 403% - Click here
Review of Netflix Earnings:
Netflix surpassed expectations again in Q4 despite many believing the increase in Disney Plus subscribers and HBO Max would weigh on Netflix's subscriber results.
To be fair, the real test is yet to come as dining out, travel, and return-to-work patterns begin to normalize. Netflix is guiding conservatively for Q1 with 6 million net additions.
Revenue grew 21% YoY to $6.6B, topping consensus estimates by $20M. Net adds of 8.5M came in well ahead of expectations calling for 6M. Netflix now expects 2021 free-cash-flow to be “around break-even” versus previous guidance of -$1B. The company also intends to explore a share repurchase program moving forward:
“Combined with our $8.2B cash balance and our $750M undrawn credit facility, we believe we no longer have a need to raise external financing for our day-to-day operations…As we generate excess cash, we intend to maintain $10B-15B in gross debt and will explore returning cash to shareholders through ongoing stock buybacks, as we did in the past (2007-2011)."
Competition has been one of Wall Street's primary concerns regarding Netflix. In Q4, Netflix maintained a healthy lead over the competition with 29% market share. In Q4 2019, Netflix had 31% share of the streaming market. Keep in mind, the market is growing overall so a smaller percentage can still represent subscriber and revenue growth.

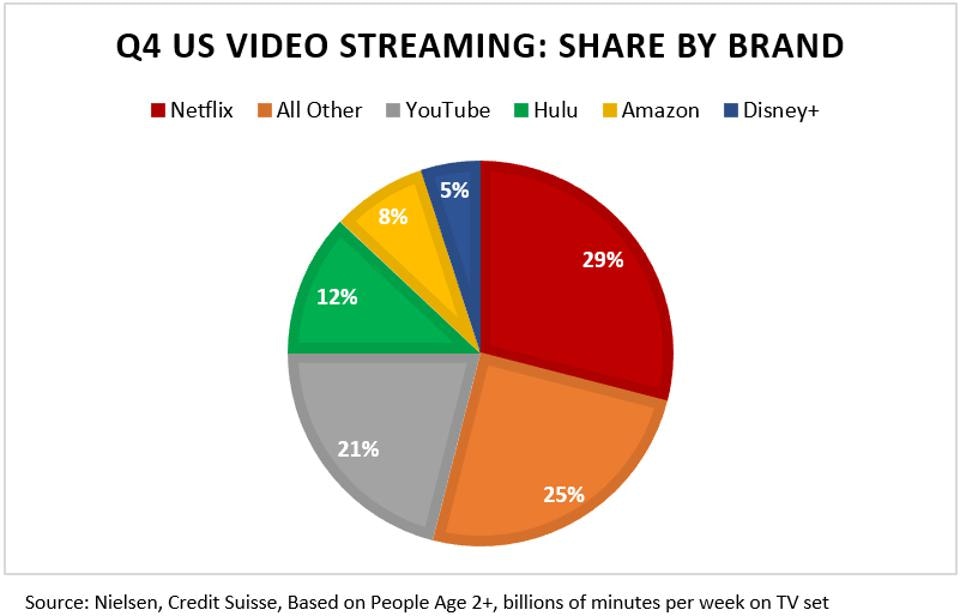
Q4 US Video Streaming: Share By Brand - NIELSEN, CREDIT SUISSE
Despite the modest decline in the share of minutes watched, it is evident that competition did not bite into Netflix’s net adds in 2020.

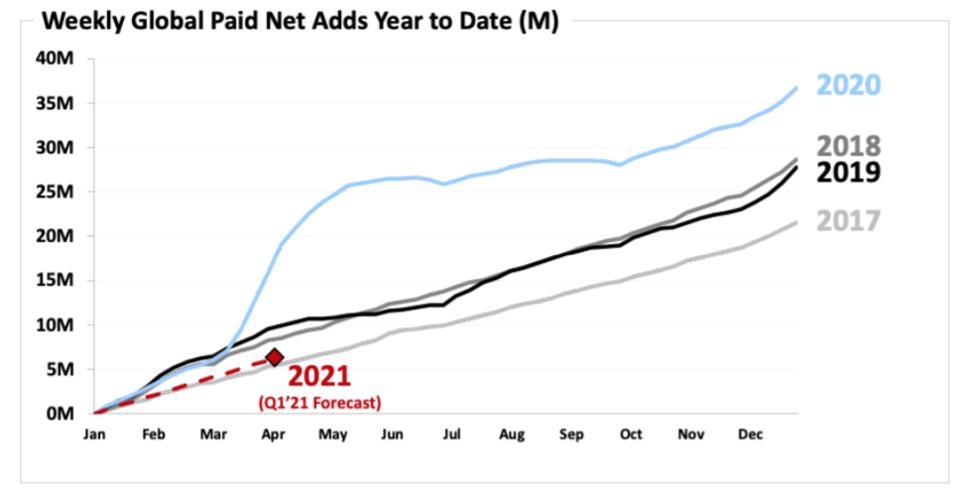
NETFLIX SHAREHOLDER LETTER
This supports the thesis that other streaming services, namely Disney+, are complementary to Netflix. Netflix just completed its best year in history while Disney+ and other new streaming services became available. Consumer behavior is showing that consumers prefer to have multiple subscription services.
In Q4, Netflix had 57.2M global app downloads versus 53.5M for Disney+. In Q4 '18 and '19, Netflix had 53M and 58M global app downloads, respectively. These numbers indicate that the success of Disney+ is not coming at the expense of Netflix. Instead, Disney+ is a complimentary service helping to further the acceleration of streaming to the TV.
Streaming to the TV gained significant market share versus all other TV usage during the pandemic.

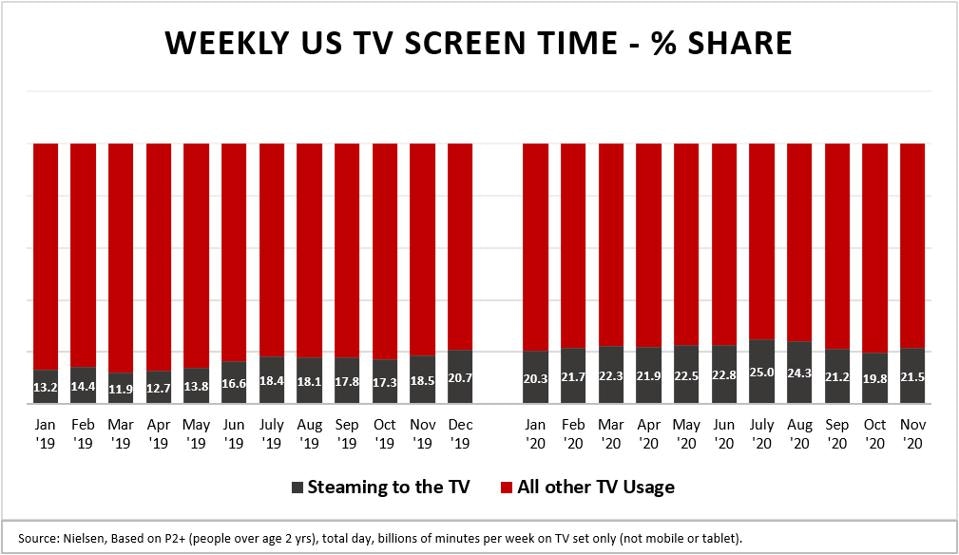
NIELSEN
Streaming to the TV now owns over a 20% share of the market. The increased demand for streaming during lockdowns represents the acceleration of a trend that was already in progress.
Although I do not own Netflix stock, I track the company closely as I’m invested in other opportunities in this space. I’ve remained bullish on this stock when others doubted its position as new competitors came on the market.
I have also written extensively about why Roku is one of the best ways to play AVOD market growth. Our first entry in ROKU came in the $30 range in 2018, and we remain bullish on the name moving forward. You can read my first article covering Roku in 2018 here.
An investment in Roku does not force investors to choose which streaming service will be #1, as Roku benefits from the success of a broad range of AVOD publishers. Advertisers are planning out strategies to reach cord-cutters effectively, and Roku stands to be a main beneficiary. Roku is positioned to capitalize on AVOD market growth and has now launched an omnichannel marketing platform to extend first-party data for mobile and desktop targeting. This last part is key because Roku can now capitalize not only the $10 billion currently spent on CTV ads and the soon-to-migrate $70 billion from Pay TV – but Roku will offer additional targeting on mobile and desktop with first-party data – opening up the entire $200 billion+ ad market.
For Q3, Roku reported 73% year-over-year revenue to $452 million. Platform revenue increased 78% YoY, and gross profit was up 81% YoY.
In the past, investors have been critical of Roku for dipping sub-60% on margins. I defended the company, stating margins are rarely an issue for an ad-tech company. Roku added 2.9 million incremental accounts with average revenue per user (ARPU) up 20% to $27.00.
Roku is guiding low for a quarter when most people were stuck at home. In general, this management guides low, stays focused, and is out of the limelight. Q4 guidance is for revenue growth in the mid-40% range with a breakdown of platform revenue at 2/3. My guess is Roku will handsomely beat this guidance.
In December, AT&T announced that customers could watch HBO Max on Roku. Part of our early analysis on Roku pointed towards agnosticism working in Roku's favor and the strength of the operating system and number of channels. This was a timely boon as HBO Max had become the fastest-growing major streaming service recently per data from Apptopia with 1984 Wonder Woman being released on Christmas Day.

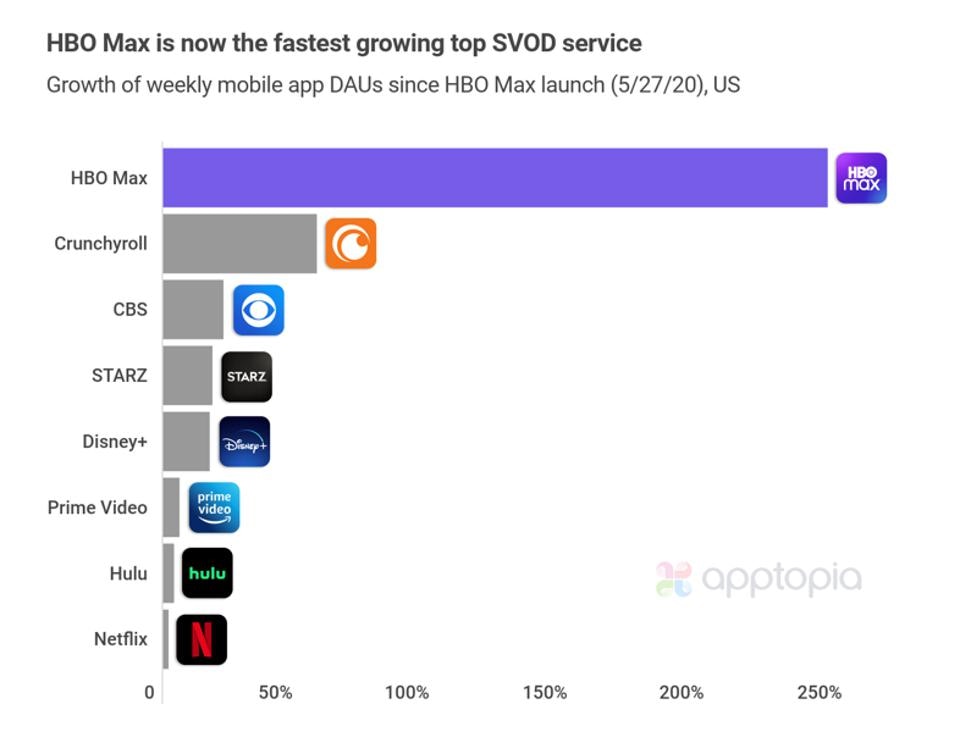
APPTOPIA
Sign up for I/O Fund's free newsletter with gains of up to 403% - Click here
Conclusion:
Over a year later, my statement on why no streaming company will be able to dethrone Netflix in October of 2019 remains true. Disney Plus and HBO Max are great services, as well, but they are not mutually exclusive.
Regarding Roku, we believe first-party data for connected TV ads is a significant trend moving into 2021 and an important distinction from subscription-video on demand (SVOD). Therefore, the main takeaway is that AVOD has an approximate ten-year runway as the trend began taking shape when Roku launched its ad platform in late 2018/early 2019. There were AVOD players in the space before this, but the budgets were negligible. Therefore, the cord-cutting trend is secondary for Roku, whereas Pay TV ad budgets' migration is the primary trend.
There are other reasons that I like Roku, such as owning the whole stack including the operating system, the management, it’s global opportunity, the agnosticism, etcetera– which I have covered in previous analysis. However, I try to keep things simple when discussing my thesis, and the migration of Pay TV ad budgets combined with Roku’s first-party data is why this stock has its best years ahead.
Please note: The I/O Fund conducts research and draws conclusions for the Fund’s positions. We then share that information with our readers. This is not a guarantee of a stock’s performance. Please consult your personal financial advisor before buying any stock in the companies mentioned in this analysis.


More To Explore
Newsletter

Nvidia, CXL, and the Battle to Improve AI Inference Economics
This is Part 2 of our two-part series on AI inference economics. In Part 1 — Why Nvidia's Next AI Battle Is About Tokens per Watt, we laid out why tokens per watt has become the defining metric for in

Why Nvidia’s Next AI Battle Is About Tokens per Watt
As hyperscalers move from building AI infrastructure to monetizing it, tokens per watt helps to reflect if revenue is scaling and if profitability is improving. Offload engines can increase tokens per

Micron Is Up 900%. Here’s Why the AI Memory Trade May Still Have Room to Run
Over the past 10 months, memory chip stocks have gone from being solid beneficiaries of the AI boom to capturing a massively outsized piece of the return pie. The inflection in Micron’s performance de
Why the S&P 500 Shrugged Off the Iran War — and What Could Finally Break the Rally
On February 28th, the U.S. went to war with Iran, and the market was handed the kind of shock it hasn't contended with for years. The conflict set off a chain reaction across the region: an ongoing su
Nvidia, CoreWeave, and Nebius: Inside the Circular Financing of the GPU Boom
Neoclouds are one of the more hotly debated AI business models, with CoreWeave and Nebius being the two most widely recognized names. These companies have seen their sales, backlog, and share prices s
AMD, Nvidia, Arm, Intel: Inside the $120 Billion CPU Gold Rush
CPUs have gone from an afterthought to becoming the AI trade’s next great bottleneck – and with AMD, Nvidia, Arm and Intel circling a market that is doubling nearly overnight, the only question left i

Google TPU v8 vs Nvidia: How Inference Is Rewriting the AI Market
In April, Google announced it would begin selling its TPUs to select third-party data center operators, which is something the market has anticipated for nearly a decade. The TPU-versus-Nvidia-GPU deb

The AI Networking Stock That Beat Nvidia by 7X YTD for Returns of 135% YTD
AI networking stock Lumentum is among the key I/O Fund winners in 2026. We allocated heavily to LITE in January—a month before Nvidia backed the company. While most investors couldn’t stomach taking a

Bloom Energy — Our 2026 Top Pick Was the Best Performing Stock in April
April was the best month in six years for the Nasdaq-100. The single best-performing large-cap stock wasn't Nvidia, Microsoft, or Meta. It was Bloom Energy, up roughly 109% in one month. As you'll rec

Inside Nvidia’s $4B Optical Strategy—and Why CPO Changes Everything
Within the AI investment theme, there is nowhere that the supply chain shifts faster than in networking, leading companies to gain content on new platforms or lose incremental share. The reason is str
