Roku: Anatomy of a Tech Darling—From Pre-Proven Business Model to Global Acceptance
April 02, 2021

Knox Ridley
Portfolio Manager
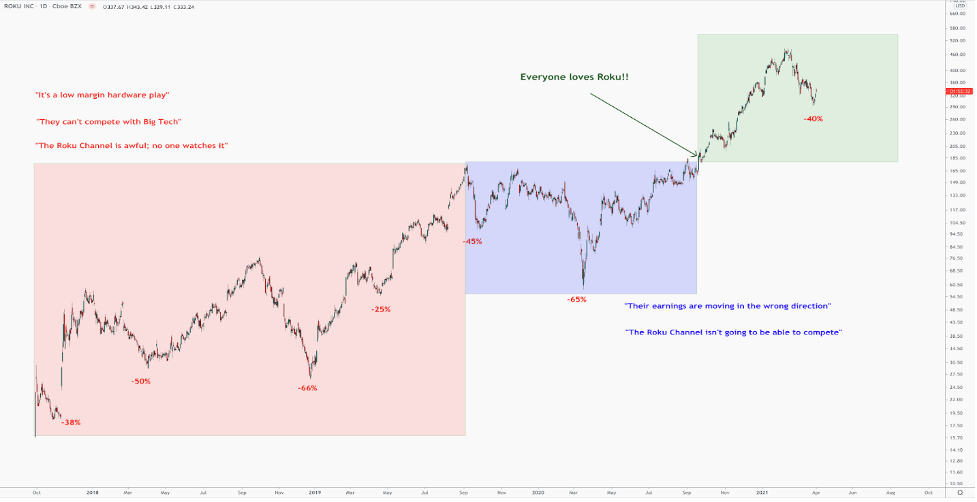
When Beth Kindig first wrote about Roku in 2018 (here and here), sentiment towards this then-unpopular stock was not in line with her primary thesis. At best, investors were hesitant. The primary arguments against her thesis were: 1) Roku will get eaten alive by Big Tech, 2) The company is undercapitalized to expand, 3) It’s a glorified hardware play, 4) Roku has no moat.
Here are some examples of the comments made on her analysis back in 2018, which characterized the prevailing sentiment at the time:
- “ROKU's model doesn't make money. The minute they try to force others to pay a fee, Google's android system will take their customers. And don't forget, Google, Amazon and Apple have voice control of the tv and can search the web for weather and sports. ROKU cannot beat these big boys.”
- “The problem I see with ROKU is that they have yet defined how exactly they are going to differentiate themselves from the big boys. If push comes to shove and my amazon prime membership gives me a free firestick or my 5 apple devices means I get 50% off apple TV why on earth would I choose a stand-alone platform? Assuming they will be able to drive margins up through advertising is a tough sell for me.”
- “I love Roku, but right now, it is a hardware company on par with Sonos, while Netflix is a content provider that is spending $12bn on content. Netflix needs to be looked at as a tech company though.”
After the March 2020 selloff, hesitation resumed around the Roku Channel and the company’s earnings. Investors now complained that Roku’s earnings were moving in the wrong direction due to lower margins and its OTT channel was no competition for the already popular and crowded space in OTT.
Today, some investors are worried that the stock’s best days are behind it. Below we reexamine our long thesis for Roku, and look at the technicals to determine what might be next for the stock.
The Future of Connected TV
Beth firmly believes Roku is benefitting from a trend that has more room to run: OTT and Connected TV Ads. In the U.S., connected TV ad spending is projected to increase from $8.11 billion this year to $18.29 billion in 2024, according to eMarketer.

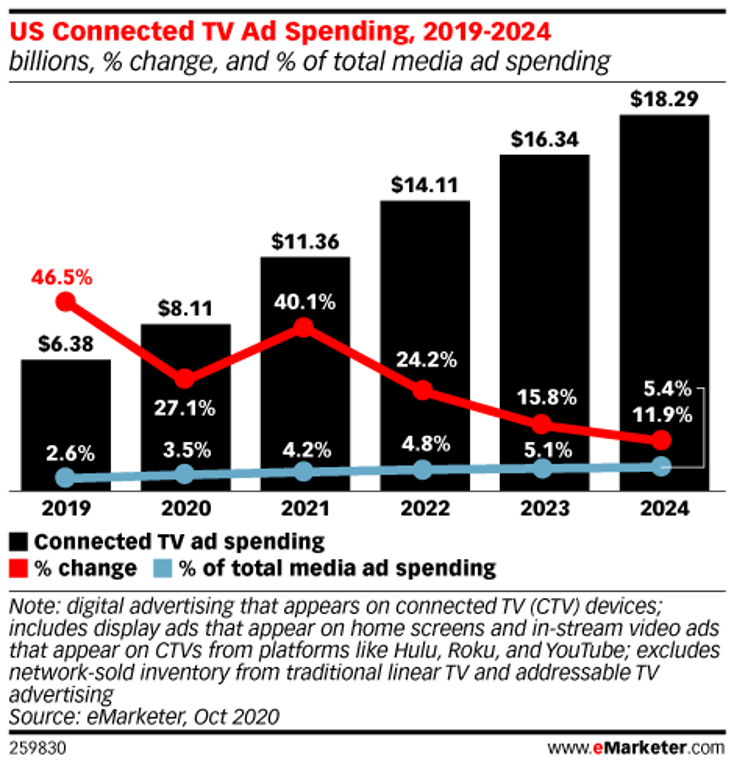
Normally, it would be a concern that the overall growth is declining – yet Roku owns the majority of programmatic connected TV market with 46% of ad spend on Roku connected devices. This is followed by about 10% market share Samsung, Apple and Amazon each. There is also a 47% increase in Roku apps that support programmatic compared to 13% in Amazon Fire TV apps.
We believe Roku’s leadership will continue on a global scale, which is not accounted for in these statistics.
The power of these misunderstood microtrends are the reason why many investors missed out on Netflix and can’t understand how a company with such “terrible fundamentals” isn’t collapsing. The market simply doesn’t understand tech and that’s to our advantage.
The OTT/Connected TV ad microtrend is what propelled Roku to a recent high of $486 on Feb.16, and it’s the reason why we identified several buying opportunities within this correction.
We think the strength of an analyst is determined by how accurate their thesis is and the sooner they get the thesis right, the more likely they will continue to get it right. Our original thesis continues to play out today: an agnostic, ad platform that supports the migration of Pay-TV ad dollars through first-party data and a strong operating system. The company is also expanding globally which will be its first attempt at doubling TAM.
I have personally watched Beth hold her original thesis through many bouts of investor doubt and market volatility, as is common with the tech growth stocks she builds a conviction around. Her conviction regarding Roku is how we were able to build the bulk of our position with a cost basis of $28. Her conviction is also how we have been able to weather the volatility to be up more than 1000% as of April 1.

Today, some investors are worried that Roku’s best days are behind it. We believe it’s best to follow the analyst who got it right from the beginning.
Below we go over current technicals, where you’ll see we are well aware of when a stock is extended and also when it’s bottoming, which can provide a good opportunity to build a position. While many traders attempt to sell at the top and buy at the bottom (wash and repeat), we prefer to remain steady with our convictions so our readers trust us and can rely on our convictions. We think trying to squeeze out gains by trading a stock rather than investing can send mixed messages and lowers the accessibility for investors who don’t trade daily. We think it is easier for our readers if our positions are clear and predictable. Very few of our readers have time to trade actively and we want to be a calming force in what can be a turbulent process.
We also take our role seriously in that we disclose our entries and exits in real-time while also being audited by a third-party for full year performance. Below, we illustrate how the I/O Fund works by looking at our current analysis of Roku and the levels we are watching.
Relative Strength
More often than not, the leaders out of a large correction tend to lead in the next leg up. Our system is setup to identify sectors and stocks that exhibit this relative strength to help guide our allocations.
However, there are exceptions. Roku is currently trading under its 50-day moving average, which is hovering around $390. Since the March 5th bottom, Roku has shown weaker relative strength than the NASDAQ100 (NDX). NDX is up ~5% while Roku is down ~5%).
It’s worth noting that Roku is up 1% over the last 3 months, and up 305% over the last year, compared to the NASDAQ100, which is down about 12% over the last 3 months and up about 78% over the last year.
Time frames are important. In fact, the relative strength of the OTT/Ad Tech world has fallen dramatically and is ranked dead last in our screens over the last 4 weeks.

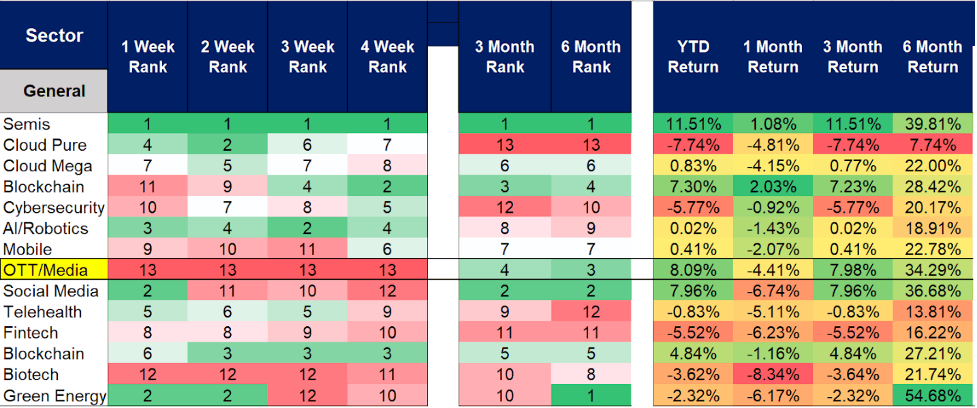
Usually, when we see this level of poor relative strength potentially coming out of a correction, we take note.
However, there is more to this story than a fading trend. Note the ranks and returns of this microsector further out. On a 3-month and 6-month basis, it’s ranked in the top percentile. This includes the recent selloff.
The level of strength is further shown in its YTD returns of around 8%, second only to semiconductors, around 11.5%. Once again, this includes the recent bout of weakness.
What changed was Bill Hwang’s leverage bets in Chinese and American media stocks, which caused a $20 billion forced liquidation of his portfolio. Since then, we have seen a fast to slow unwind of many OTT/Ad-Tech names, which has skewed the relative strength of this microsector.
Prior to the forced unwinding, this microsector was ranked in the top decile of all the tech sectors we track. Because of this, we believe that the opportunity to accumulate specific stocks in this field is unique.
Roku’s Opportunity
Regarding Roku, we outlined the potential 4th wave drawdown and warned our readers of a top forming. On February 11th when Roku was trading around $475, within our forum, we stated
“Note all the sell signals - overbought (check), Demark 9 signal (check), RSI and MACD are showing negative divergence (check). I believe we are coming to the end of a minor degree 3rd wave (pink), which will set up a great buying opportunity.”
We later outlined potential tragets for a bottom on March 1st in one of our premium webinars, by stating “I believe Roku has topped out in its 3rd wave. The 4th wave targets are $335 to $265.”
Again, on March 30th, we reaffirmed our target region by stating “We are square in the 4th wave target box. The $300 level is very strong support. Below that is $275 and then $265. I doubt we tag $265 with the internals where they are.”
Today, we think the evidence supports a bottom in Roku for this correction.

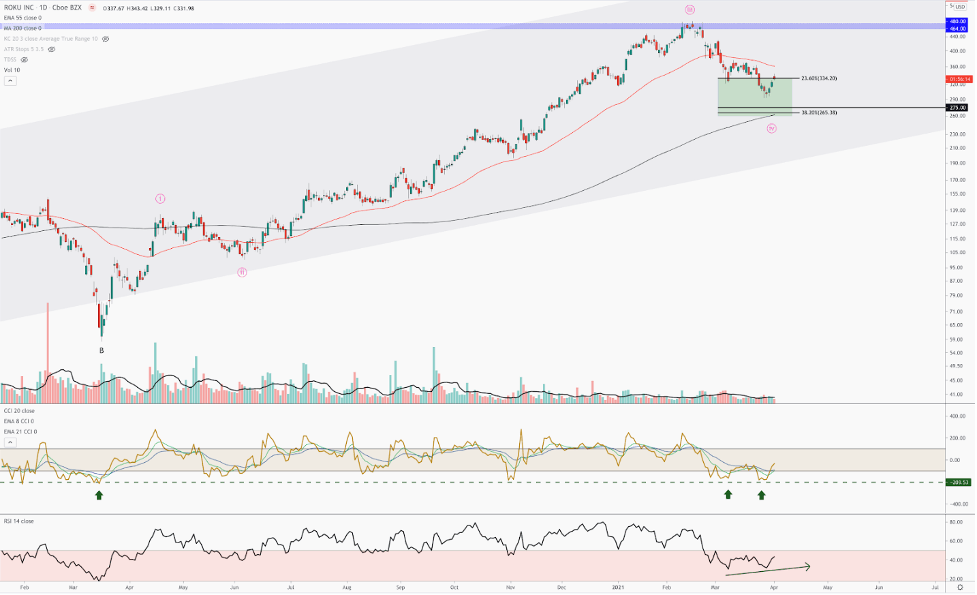
For one, the price hit a wall of support at the $300 region, which is square in the middle of the most probable 4th wave target zone. The CCI, which is a momentum oscillator, tagged the same region we saw at the bottom of the March 2020 low. This is classic uptrend behavior, where we see momentum hit major support or lower while price is higher.
Also, note the positive divergence with RSI, another popular momentum oscillator. RSI is making a lower high while price makes a lower low. The two of these indicators are providing classic bottoming signals.
Learn more about the crucial difference between Netflix and Roku here, and why Beth is confident that Roku’s best years are still ahead. Find out what levels we are watching on NDX to confirm an end to the correction here.
Roku: Levels to Watch
We expect the uptrend to continue to all new highs as long as the $292 low holds. Below $292, and we will look next for a bottom around the $280-$275 region, before the uptrend resumes. We think a test of the 200-day SMA ($265) to be less probable based on how oversold the momentum-based internals are with Roku.
In conclusion, the more probable scenario is that the bottom is in.
Disclaimer: Knox Ridley and the I/O Fund is currently invested in ROKU. The content in this article is intended to be used for informational purposes only. The author has not received any compensation from any third party or company discussed in this article. The content is the expressed opinions of the author and is intended for educational and research purposes. Any thesis presented is not a guarantee of any particular stock’s future prices, so please factor this risk into your own analysis. It is very important that you do your own analysis before making any investments based on your personal circumstances. The author is not a licensed professional advisor. Please seek counsel form a licensed professional before acting on any analysis expressed in this article, to see if it is appropriate for your personal situation.


More To Explore
Newsletter

Big Tech’s Free Cash Flow is Turning Negative – Who's Next?
Big Tech’s AI revenue is accelerating, but free cash flow is moving sharply in the opposite direction. Across Google, Microsoft, Meta and Amazon, capex is rising much faster than operating cash flow a

Big Tech Earnings Preview: Is AI Monetization Finally Catching Up to Capex?
The most pronounced difference between 2026’s tech rally compared to rallies in the past is which companies have been left out of it. The names most associated with the AI trade have hardly participat

Nvidia, CXL, and the Battle to Improve AI Inference Economics
This is Part 2 of our two-part series on AI inference economics. In Part 1 — Why Nvidia's Next AI Battle Is About Tokens per Watt, we laid out why tokens per watt has become the defining metric for in
Why Nvidia’s Next AI Battle Is About Tokens per Watt
As hyperscalers move from building AI infrastructure to monetizing it, tokens per watt helps to reflect if revenue is scaling and if profitability is improving. Offload engines can increase tokens per
Micron Is Up 900%. Here’s Why the AI Memory Trade May Still Have Room to Run
Over the past 10 months, memory chip stocks have gone from being solid beneficiaries of the AI boom to capturing a massively outsized piece of the return pie. The inflection in Micron’s performance de
Why the S&P 500 Shrugged Off the Iran War — and What Could Finally Break the Rally
On February 28th, the U.S. went to war with Iran, and the market was handed the kind of shock it hasn't contended with for years. The conflict set off a chain reaction across the region: an ongoing su

Nvidia, CoreWeave, and Nebius: Inside the Circular Financing of the GPU Boom
Neoclouds are one of the more hotly debated AI business models, with CoreWeave and Nebius being the two most widely recognized names. These companies have seen their sales, backlog, and share prices s

AMD, Nvidia, Arm, Intel: Inside the $120 Billion CPU Gold Rush
CPUs have gone from an afterthought to becoming the AI trade’s next great bottleneck – and with AMD, Nvidia, Arm and Intel circling a market that is doubling nearly overnight, the only question left i

Google TPU v8 vs Nvidia: How Inference Is Rewriting the AI Market
In April, Google announced it would begin selling its TPUs to select third-party data center operators, which is something the market has anticipated for nearly a decade. The TPU-versus-Nvidia-GPU deb

The AI Networking Stock That Beat Nvidia by 7X YTD for Returns of 135% YTD
AI networking stock Lumentum is among the key I/O Fund winners in 2026. We allocated heavily to LITE in January—a month before Nvidia backed the company. While most investors couldn’t stomach taking a
