Roku’s Stock Price: Will There Be Another Pullback?
November 15, 2019

Knox Ridley
Portfolio Manager
Roku’s stock price is up by almost 500% over the past two years. Compare this to the S&P 500, which is up less than 25%. That’s 20X more returns than the average stock.
The upward trend has not been on a straight line. Roku’s stock price has had four major drawdowns that average about 52%. Two of these drawdowns were greater than 60%. Being long a volatile company like Roku since its IPO is not easy, and it especially takes increased conviction to stay long Roku as we approach the end of the current cycle. However, for those that were insightful enough to see that Roku is not a hardware play, nor a content generating OTT play, but instead a Connected TV Advertisement play from inception, have been able to hold Roku through the drawdowns despite market noise.
In this report, I will look at the fundamental case for buying Roku stock. I will also perform a technical analysis of the company’s stock price as entry and exit is crucial for high-growth stocks. This technical analysis reflects the choppy reaction to the company’s third-quarter earnings report.
Roku’s Fundamental Background
Roku is one of the most misunderstood names in technology. A common argument against Roku is that it is a small company with no moat in the streaming industry. They also argue that competition from cash gushing companies like Apple, Google, and Amazon will threaten its lead. In reality, the opposite is true. Roku may be small in comparison, yet it still leads with 39% market share in OTT hardware in the United States compared to Amazon in second place at 30%.
In the most recent quarterly release, the company announced that its users had grown to more than 32.3 million. This is nearly double what the company had in Q2 2017 with 15 million users. The average revenue per user has grown from $11.22 in Q2’17 to more than $22.
The ad platform segment of Roku’s business is the fastest growing and most important. It is also a high-margin business. In the 2017 financial year, the segment had more than $225 million in revenue. This revenue rose to $416 million in 2018. In the most recent quarter, the platform segment grew by 79% to more than $179 million.
Also Read : Roku Q3 Earnings
Another misconception about Roku is that Roku is in competition with the likes of Disney+, Netflix, and HBO Go because of the subscription service it offers. In reality, the company does not compete directly with these companies, even with its SVOD platform. This is because Roku is mostly in the business of serving adverts and using its data to provide a better ad experience. My partner, Beth Kindig, covers this in more detail in her fundamental analysis (here, here, here) .
The closest competitors to Roku are Amazon and Hulu. Comcast’s Peacock, which will be an ad-supported streaming platform, will also be a competitor, but only domestically. This is because these companies compete for connected TV ad dollars.
Roku has an added advantage because of the vast data it has on its consumers due to owning the hardware. Also, the agnostic nature of Roku’s business makes it favorable for smart TV manufacturers. This is because it does not compete with them on the level that Google or Amazon does.
One final not on Roku, valuation is a constant issue that bears have talked about. It is true that the company appears to be overvalued. The company is valued at more than $15 billion. This is a premium for a loss-making company that is expected to make more than $1.1 billion this year. The company has a forward P/S ratio of 9.9, which is a significant premium. Consider that companies like Amazon, Netflix, and Spotify have a forward PS ratio of less than 6.
Technical Outlook for Roku’s Stock Price
Roku Volume Report

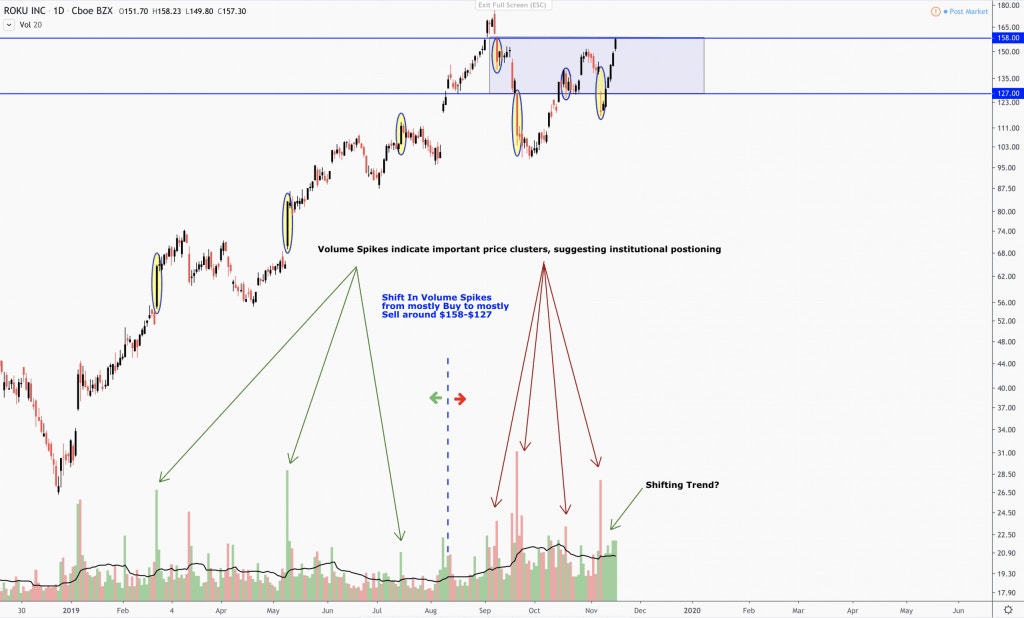
The volume activity in Roku tells us a lot about the current environment we are in, as well as what institutions are thinking. “Smart money,” or institutions, have teams of analysts and professional traders moving large amounts of cash. This typically shows up as massive volume spikes, coupled with noticeable changes in the stock price. The price at which they decide to buy in bulk, or sell in bulk, typically acts as new support/resistance that the price must push through.
What’s noticeable is that around the $127 region, we went from seeing predominantly green volume spikes, to predominantly red volume spikes. The zones in which we are seeing these large liquidations is between the $158-$127 region.
Also Read : Update on $ROKU – Will Roku Miss Earnings?
This will be a lot of liquidity to make up, and we usually will see a shift in momentum when the reverse occurs, – i.e., large green volume spikes coinciding with a noticeable shift in price. Until I see us break through the $158-$163 region, with new increased volume spikes, I would be cautious of the current retracement back to new highs.
However, it’s worth noting that this shift could be starting to occur with rising green bars suggesting a renewed interest. I’d like to see institutions take out large positions at current levels before getting excited. So far, the only large volume spikes in this region has been to the downside.
Insider Activity

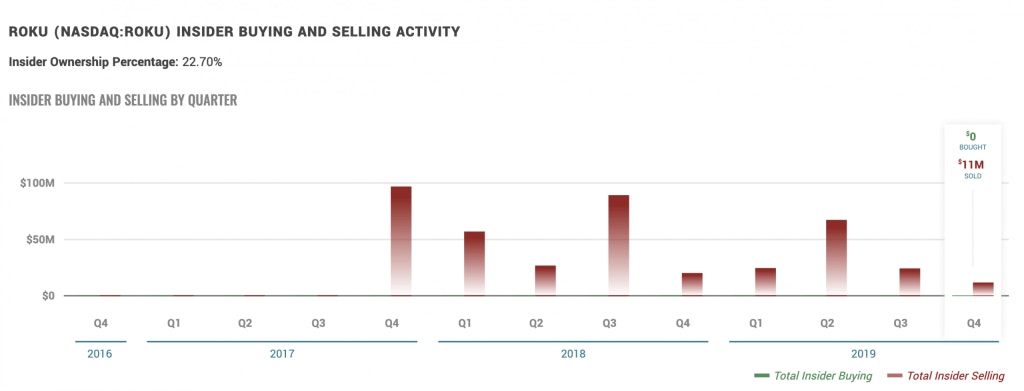
Insider buying is significantly more notable than insider selling. This is especially true when dealing with a high growth company that just went public; also, there could be numerous personal reasons why insiders are selling. But, it’s worth noting that all the insider activity in Roku since its IPO has been selling with zero buying. Nobody knows this business better than the insiders, and what they do, or do not do, can give insight to where they see growth vs market valuation. It’s worth noting that no insiders are buying their shares at current prices, which I’d agree makes sense if you are a buy and hold investor with a long time frame. However, in the short-term, there could be plenty of momentum left in Roku.
Internal Strength of Roku’s Stock Price

Going into earnings, we had cautioned our readers that $131-$127 was support and resistance was at the $156-$158 region. Any trades in this region on this stock were higher risk. We were correct, as the stock dropped to $119 but quickly bounced back. It has now been climbing and has even posted some marginal gains since prior earnings drop, and we are approaching a critical price cluster.
Simply put, if the stock price breaks $163 and closes well above this price, then I’ll be targeting the above the $200 region before any major drawdown occurs. However, this will require a broader macro bull market. I think it is more likely Roku remains choppy with lower entries available than where it is priced right now.
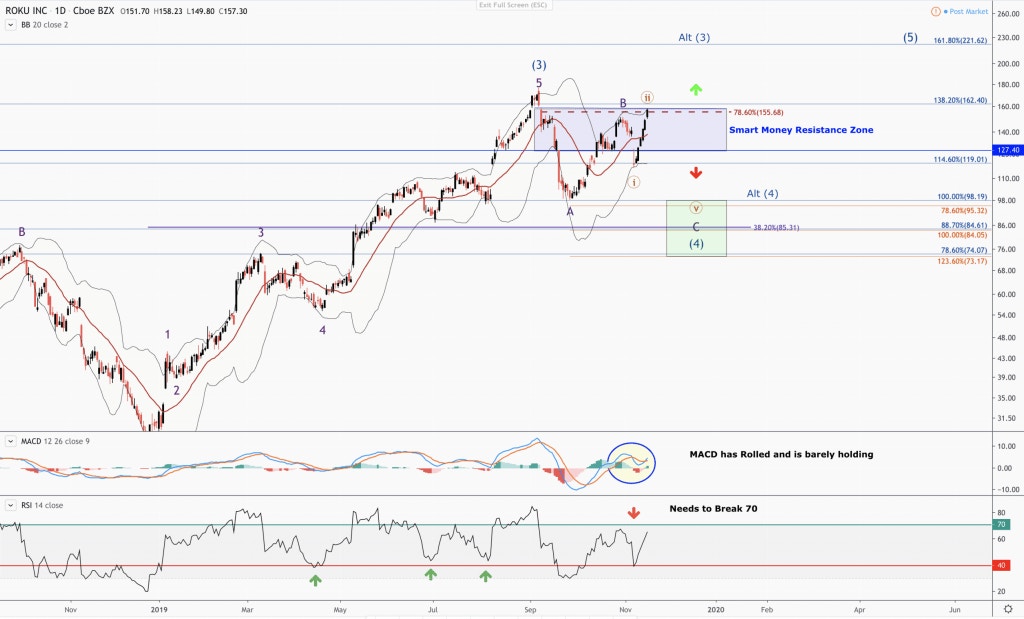
The internals support this position as well, as of now. In the above chart, the MACD has rolled over, and just recently flipped back up, suggesting strong short-term momentum. Until it breaks above the most recent high on the MACD, this could be a fake-out. The RSI is confirming caution as well. Until we can break the 70 line, which has historically indicated a bullish posture, I’d be cautious on the current uptrend as Roku continues to trade between support and resistance. We are currently oscillating between the 40 line, which has been bullish support and the 70 line, which has been bullish resistance.
Also Read : Here’s Why Roku Will Be The Next Tech Darling
Elliott Wave Counts and Internal Strength
Many investors are playing momentum with Roku right now, and we believe this is the correct strategy at current prices. Going long Roku today should be done with stops in place or a systematic exit strategy to protect any gains. Therefore, Elliott Wave is the preferred method for increasing the probability for successful entries on long positions for a momentum trade, as well as set ideal targets for a more long-term time frame.
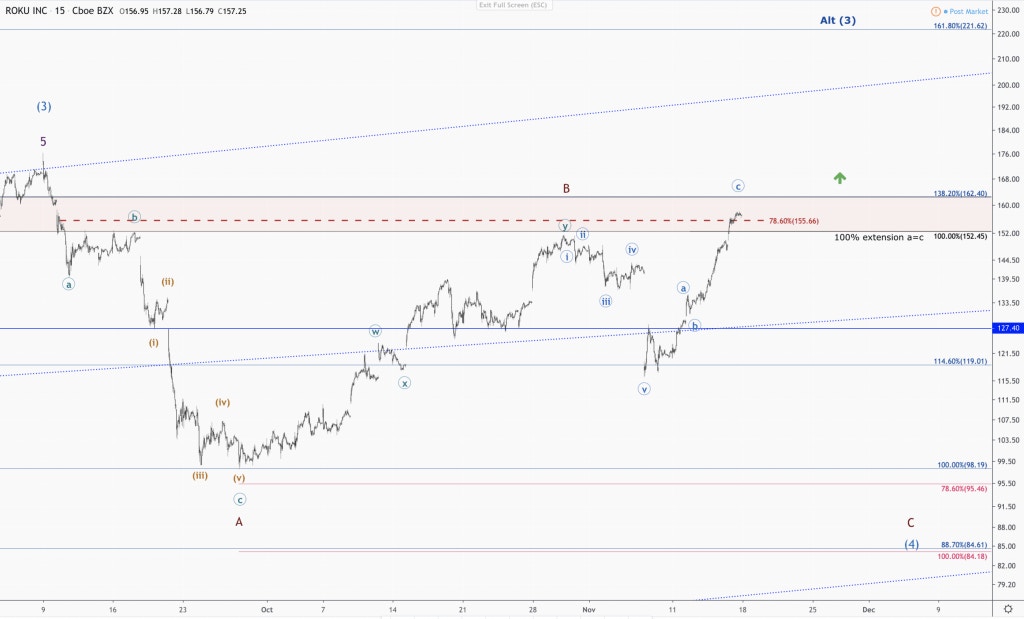
Above is the 30-minute chart of Roku going back from it’s all time high. My Primary Elliott Wave count has Roku’s stock price completing its larger degree Wave 3 push just above the 138.2% extension at its all-time highs. This is historically a lower top for a typical target for a 3rd Wave, which usually targets the 161.8% extension.
If Roku can break back above the 78.6% retrace and then take back the 138.2% extension around $163, we will likely see a push to the 168.2% extension before any significant drawdown that would constitute a 4th Wave correction (this is shown as an “alt (3)” and “alt (4)” on the chart). As of now, the evidence supports that Roku is in its 4th Wave correction, and as long as it stays below to current resistance, there will be chances for lower entries on a more long-term basis. However, if we close above $163, I will likely add to my current position with tight stops to play renewed momentum as Roku powers to new highs.


More To Explore
Newsletter

Nvidia and Google Are Crowding TSMC’s N3 Node - Can Intel Fill the Gap?
Nvidia is moving its next-generation Rubin GPUs from 4nm to 3nm, yet Google’s latest TPUs are already on N3 and are expected to remain there. Meanwhile, a growing number of AI CPUs from Nvidia, Amazon

Intel vs TSMC: How CoWoS Packaging Constraints Could Create an Opportunity for Intel Foundry
Taiwan Semiconductor (TSMC) is the single, most important company to the AI industry. However, to compete with the incumbent, Intel does not need to beat TSMC at leading-edge manufacturing. It only ne

Big Tech’s Free Cash Flow is Turning Negative – Who's Next?
Big Tech’s AI revenue is accelerating, but free cash flow is moving sharply in the opposite direction. Across Google, Microsoft, Meta and Amazon, capex is rising much faster than operating cash flow a
Big Tech Earnings Preview: Is AI Monetization Finally Catching Up to Capex?
The most pronounced difference between 2026’s tech rally compared to rallies in the past is which companies have been left out of it. The names most associated with the AI trade have hardly participat
Nvidia, CXL, and the Battle to Improve AI Inference Economics
This is Part 2 of our two-part series on AI inference economics. In Part 1 — Why Nvidia's Next AI Battle Is About Tokens per Watt, we laid out why tokens per watt has become the defining metric for in
Why Nvidia’s Next AI Battle Is About Tokens per Watt
As hyperscalers move from building AI infrastructure to monetizing it, tokens per watt helps to reflect if revenue is scaling and if profitability is improving. Offload engines can increase tokens per

Micron Is Up 900%. Here’s Why the AI Memory Trade May Still Have Room to Run
Over the past 10 months, memory chip stocks have gone from being solid beneficiaries of the AI boom to capturing a massively outsized piece of the return pie. The inflection in Micron’s performance de

Why the S&P 500 Shrugged Off the Iran War — and What Could Finally Break the Rally
On February 28th, the U.S. went to war with Iran, and the market was handed the kind of shock it hasn't contended with for years. The conflict set off a chain reaction across the region: an ongoing su

Nvidia, CoreWeave, and Nebius: Inside the Circular Financing of the GPU Boom
Neoclouds are one of the more hotly debated AI business models, with CoreWeave and Nebius being the two most widely recognized names. These companies have seen their sales, backlog, and share prices s

AMD, Nvidia, Arm, Intel: Inside the $120 Billion CPU Gold Rush
CPUs have gone from an afterthought to becoming the AI trade’s next great bottleneck – and with AMD, Nvidia, Arm and Intel circling a market that is doubling nearly overnight, the only question left i
