Meta Stock: The rising expenses and Capex are worrying
Written by
I/O Fund Team
Research Team
Published: November 4, 2022
Last Updated: November 4, 2022
On this page
Meta shares nosedived 25% after the company's recent Q3 results. Meta's expenses are rising and the company is seeing softer revenue growth and softer margins. The slowing advertisement revenue has forced the company to look for new investments and the market is doubting when or if these investments will pay off.
Perhaps most importantly, the increase in expenses and Capex has plummeted Meta's cash flow margin in the most recent quarter. This is a material change to Meta’s story as the company was the leading FAANG stock on free cash flow yet reported a sudden, drastic reversal in Q3.
Below, I discuss the company's recent results in a detailed analysis below.
Meta’s Revenue is Slowing
The company’s revenue in Q3 fell by 4% YoY to $27.71 billion and was up 2% on a constant currency basis. The company managed to beat the consensus estimates by 1.2%. This is the company's second consecutive quarter of declining revenue.
CEO Mark Zuckerberg attempted to address concerns in his opening remarks yet the market was not buying it, “We now reach more than 3.7 billion people monthly across our Family of Apps. And while we continue to navigate some challenging dynamics of volatile macro economy, increasing competition, ad signal loss and growing costs from our long-term investments, I have to say that our product trends look better from what I see than some of the commentary I have seen suggests.”I have to say that our product trends look better from what I see than some of the commentary I have seen suggests.”
While the company does not fully acknowledge the change in business model that we discuss in our analysis “Facebook Stock: A Permanent Change To The Business Model” results show that the company is struggling with growth. The management expects growth to return next year as Mark Zuckerberg said, “We are still behind where I think we should be, but we believe that we will return to healthier revenue growth trends next year. That said it’s not clear that the economy has stabilized yet.”
Management’s guide for next quarter is $31.25 billion at the mid-point of the guidance, representing a YoY decline of 7.2% and the guide includes 7% foreign exchange headwinds. Analysts expect revenue to decline by 6.1% in Q4 and 1.6% in Q1 2023. The consensus estimates suggest that revenue growth is expected to return in Q2 2023.
Softer Operating Margins
In addition to revenue declining, the sell-off was also fuelled by a declining operating margin. Operating income fell 46% YoY to $5.66 billion. The Family of Apps segment operating income was $9.3 billion and Reality Labs operating loss was $3.7 billion. Total costs and expenses rose 19% YoY to $22.1 billion.
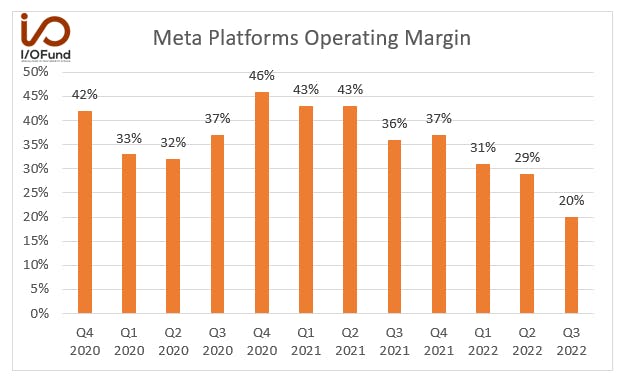
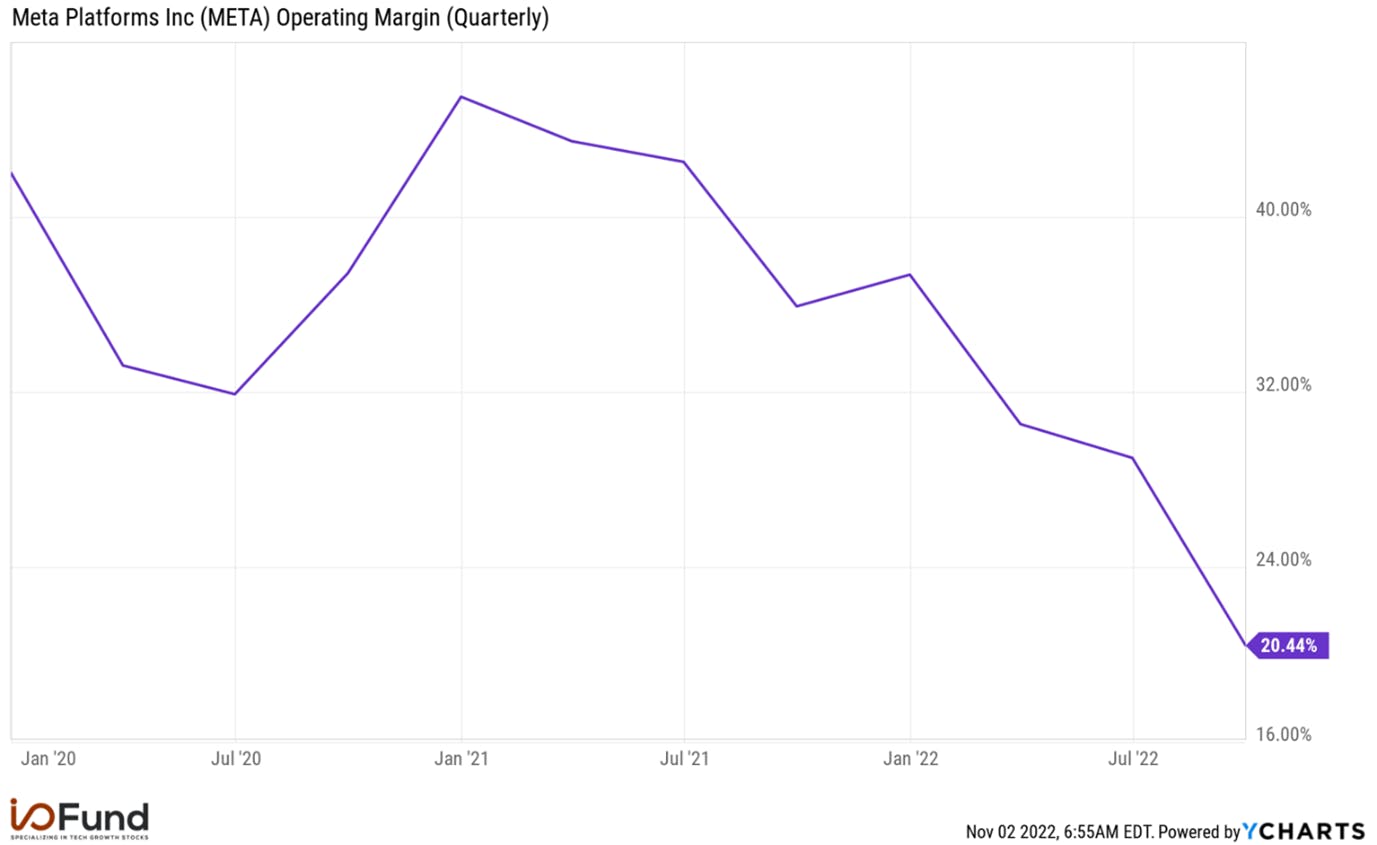
The company has seen a significant drop in the operating margin. Operating margin was 20% compared to 29% in Q2 2022 and 36% in the same period last year. It is significantly lower than the company’s historical period as seen in the chart below.
Source: YCharts
The management expects total expenses to be $86 billion at the mid-point of the guidance for the full year 2022, which represents YoY growth of 21%. This includes $900 million in additional charges for consolidating the office facilities that the company expects to record in the fourth quarter. I estimate the operating margin for Q4 to be 23% which would be significantly lower than the 37% in the same period last year.
Sign up for I/O Fund's free newsletter with gains of up to 403% - Click hereSign up for I/O Fund's free newsletter with gains of up to 403% - Click hereClick here
Meta Capex
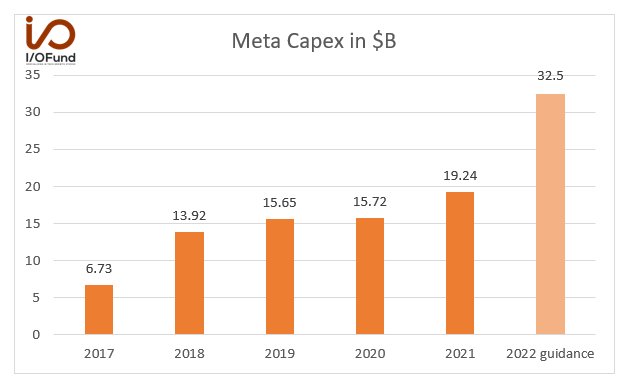
For Q3, Meta had capital expenditures, including principal payments of financial leases of $9.52 billion, up 109% YoY.
YTD 2022, the Capex is $22.8 billion, and the management guidance for the full year 2022 has been revised to $32-$33 billion from the previous range of $30-$34 billion.
This represents YoY growth of 69% at the mid-point of the guidance. Doing the math suggests Q4 Capex will be about $9.7 billion, up 75% YoY and up 1.9% QoQ.
Source: Company Investor Relations
Get Our Free Weekly Stock Newsletter
Get weekly stock insights, market analysis, and technology updates straight to your inbox.
Weekly stock insights
Market analysis
Technology updates
Dave Wehner, CFO of the company said in the earnings call, “Turning now to the specific CapEx outlook for ’22 and ’23. We expect 2022 capital expenditures, including principal payments on finance leases, to be in the range of $32 billion to $33 billion updated from our prior range of $30 billion to $34 billion. For 2023, we expect capital expenditures to be in the range of $34 billion to $39 billion driven by our investments in data center servers and network infrastructure. An increase in AI capacity is driving substantially all of our capital expenditure growth in 2023.”For 2023, we expect capital expenditures to be in the range of $34 billion to $39 billion driven by our investments in data center servers and network infrastructure. An increase in AI capacity is driving substantially all of our capital expenditure growth in 2023.”
Turning now to the specific expense outlook for ’22 and ’23, we expect 2022 total expenses to be in the range of $85 billion to $87 billion updated from our prior outlook of $85 billion to $88 billion. This includes an estimated $900 million in additional charges in Q4 related to consolidating our office facilities footprint that we expect to record in the fourth quarter of 2022. We anticipate our full year 2023 total expenses will be in the range of $96 billion to $101 billion. This includes an estimated $2 billion in charges related to consolidating our office facilities footprint.”
Source: YCharts
It's earnings season and our premium members have been getting deep dive analysis on the top tech stocks each week, on top of real-time trade notifications, technical analysis from our portfolio manager, weekly webinars, and more. Learn more about becoming a premium member here. It's earnings season and our premium members have been getting deep dive analysis on the top tech stocks each week, on top of real-time trade notifications, technical analysis from our portfolio manager, weekly webinars, and more. Learn more about becoming a premium member here. Learn more about becoming a premium member here.
The Bottom Line
The increasing expenses, particularly in the reality labs segment, have weighed on the company’s profits. The management expects the reality labs segment losses to continue in the next year and investors don’t seem confident the company’s spend on the metaverse will materialize into growth or profits for some time.
On the other hand, the company has been investing heavily in cloud infrastructure and artificial intelligence. The increase in Capex reduces the company’s free cash flows. This is a concern since Meta led Big Tech on a strong free cash flow margin in the past. The free cash flow margin was 1% in the recent quarter and down significantly from 37% in the December quarter.
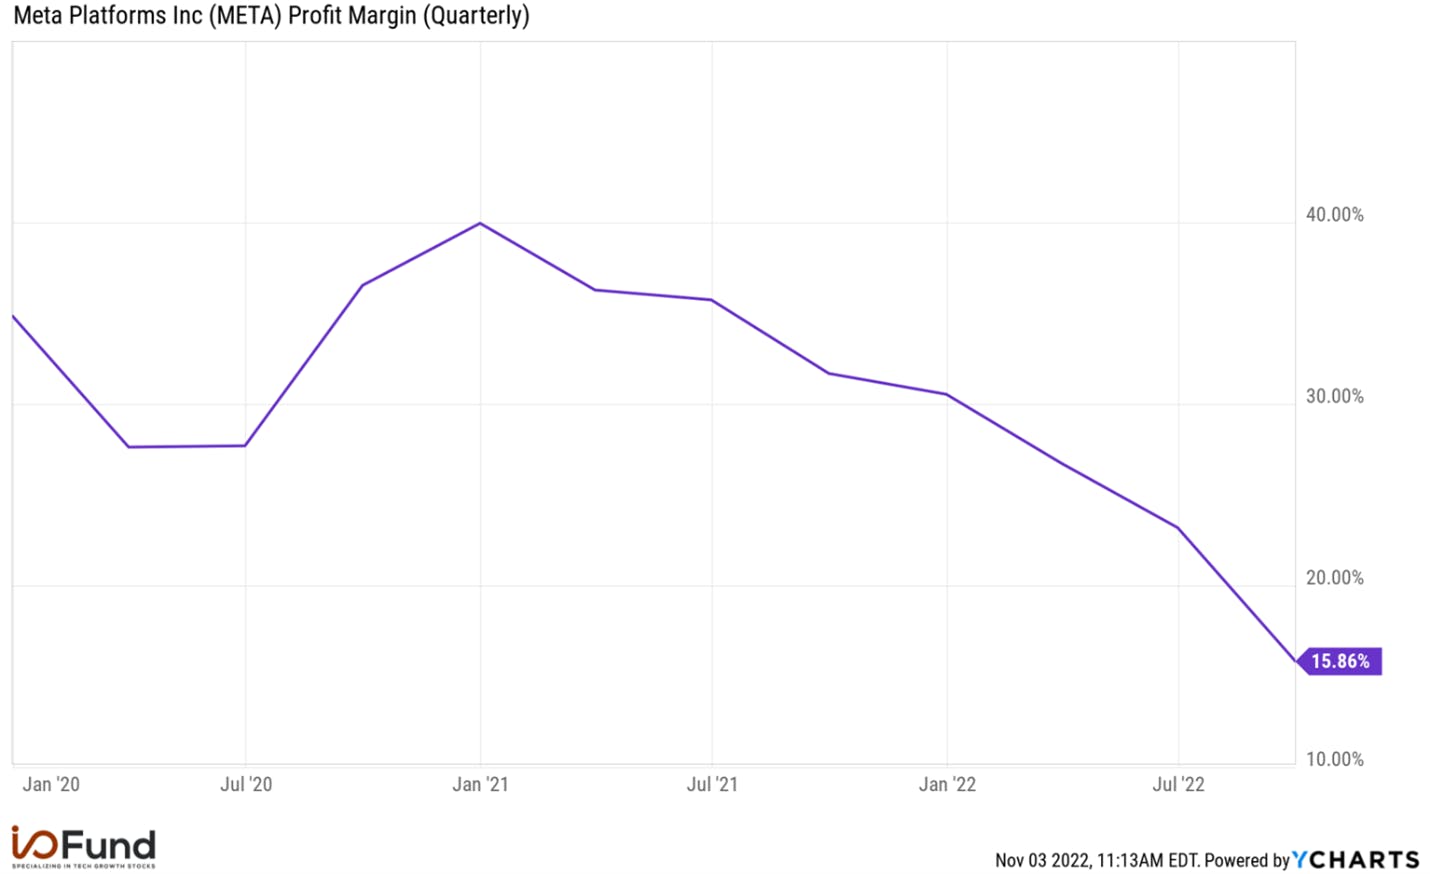
The company’s net income fell 52% YoY to $4.4 billion. EPS of $1.64 compared to $3.22 for the same period last year. The company’s net profit margin was 16% compared to 23% in Q2 2022 and 32% in Q3 2021.
The company has cash and marketable securities of $41.78 billion at the end of Q3 2022. The debt was $9.92 billion.
The operating cash flow was $9.69 billion (35% of revenue) and free cash flow was a meagre $173 million (1% of revenue) in the recent quarter. The difference between operating cash flow and free cash flow is the high Capex.
Source: YCharts
Conclusion:
Meta Platforms was once a stock market darling for its solid revenue growth, strong profits and cash flow. Times have changed, and the company is now struggling with slowing ad revenue. It’s not only the increased expenses and capex that are an issue, rather a clear path to monetization that goes with it.
If you’d like more information regarding how the business model has changed, please reference the articles below.
Please note: The I/O Fund conducts research and draws conclusions for the Fund’s positions. We then share that information with our readers. This is not a guarantee of a stock’s performance. Please consult your personal financial advisor before buying any stock in the companies mentioned in this analysis.