Upcoming Correction But Still a Bull Market
August 20, 2021

Knox Ridley
Portfolio Manager

Inflation has continued to concern investors into the month of August, causing many growth stocks to give back any footing they gained in the prior month. Since the February top in tech growth, only select names in the cloud and semiconductor space, as well as big tech, are at new highs, while many high fliers from last year are still building a base. We believe the future for tech is bright, but the sentiment towards these names right now is met with caution as the market digests the potential for real inflation that may not be transitory.
In our last update, we stated that “if we monitor the price relations with intermarket analysis, the market is telling us that inflation fears are likely overblown, even if the trend in inflation continues.” With the inflationary trend accelerating into August, coupled with the Overnight Reverse Repurchase Agreements (reverse repos) exceeding an unprecedented $1 Trillion dollars, it appears that the FED is ready to begin hiking rates sooner than expected.
Just like last month, the market continues to tell us is that inflation fears, as it relates to the continuation of the bull market, are likely still overblown. Most importantly, if we look at history, some of the best market gains in a bull market occur in the final innings. We believe this market still has a lot of room to run, and view any coming pullback as a buying opportunity.
Inflation and Reverse Repo
With the CPI up 5.37% YoY, compared with an average growth rate around 3.4%, the case for inflation is strong. Some would argue that this YoY number is coming from an unusually low water mark due to a global shutdown of the economy, and thus inflating the YoY growth rate. I believe this to be true, to an extent, especially as complex supply chains start to ramp up to meet demand.
However, if we look at the CPI over a 3 month period, which is coming from a high water mark of a newly re-opened economy, then the CPI is suggesting an 8.1% annualized growth rate. This simply cannot be explained by anything other than a build-up of inflation in the economy.
Further concern can be found in the recent and historic growth in the M2 money supply, which is the metric that most economists believe leads to inflation. To better understand M2, it’s important to understand this layer of the money supply in relationship to the FED’s famous Quantitative Easing program (QE), which was started as a response to the Great Financial Crisis in 2008.
Quantitative Easing, in its most simple form, is the FED buying mortgage back securities and treasuries from authorized banks in an attempt to put more liquidity into the economy. It would seem that this is inflationary by nature, yet this is simply not the case.
What many fail to realize is that the FED takes real assets in the form of Treasuries and Mortgage Backed Securities from the economy, and in exchange, banks do not receive cash, rather an increase to their reserve that can be loaned out. So, in order for these reserves to become inflationary, they would need to be loaned out by these banks. If the banks are not loaning out these reserves in an equal ratio that they are selling the securities to the FED, it ultimately has a deflationary effect on the economy – this is due to less securities in rotation, without the cash to replace them.
The FED can create excess reserves for banks to loan out, but they can’t force them to make loans, nor can they direct people on how to spend any cash they receive from loans. This is where the M2 money supply comes into place. M2 is simply not controlled by the FED, and it refers to the part of the money supply that includes highly liquid assets, like bank deposits, money market securities and bank deposits, etc. This is real money in the economy that can be taken out by people to purchase goods and services.
Here’s a quick visual to better understand this concept.

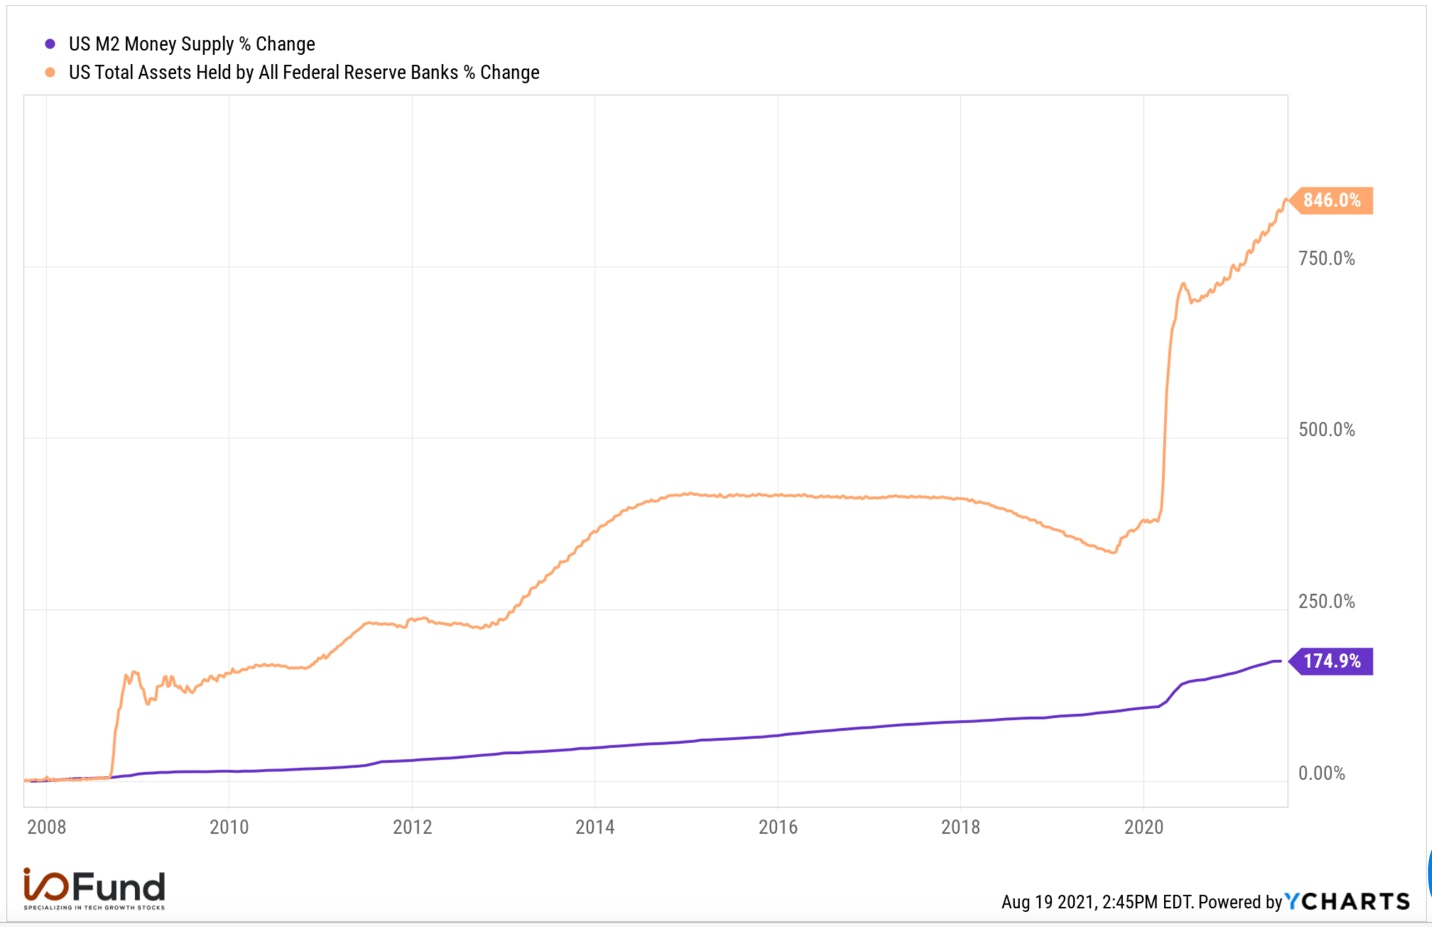
As more and more reserves were being put into the banking system (orange), the actual money that was filtering out into the economy (purple), was staying steady. That is, until February of 2020.

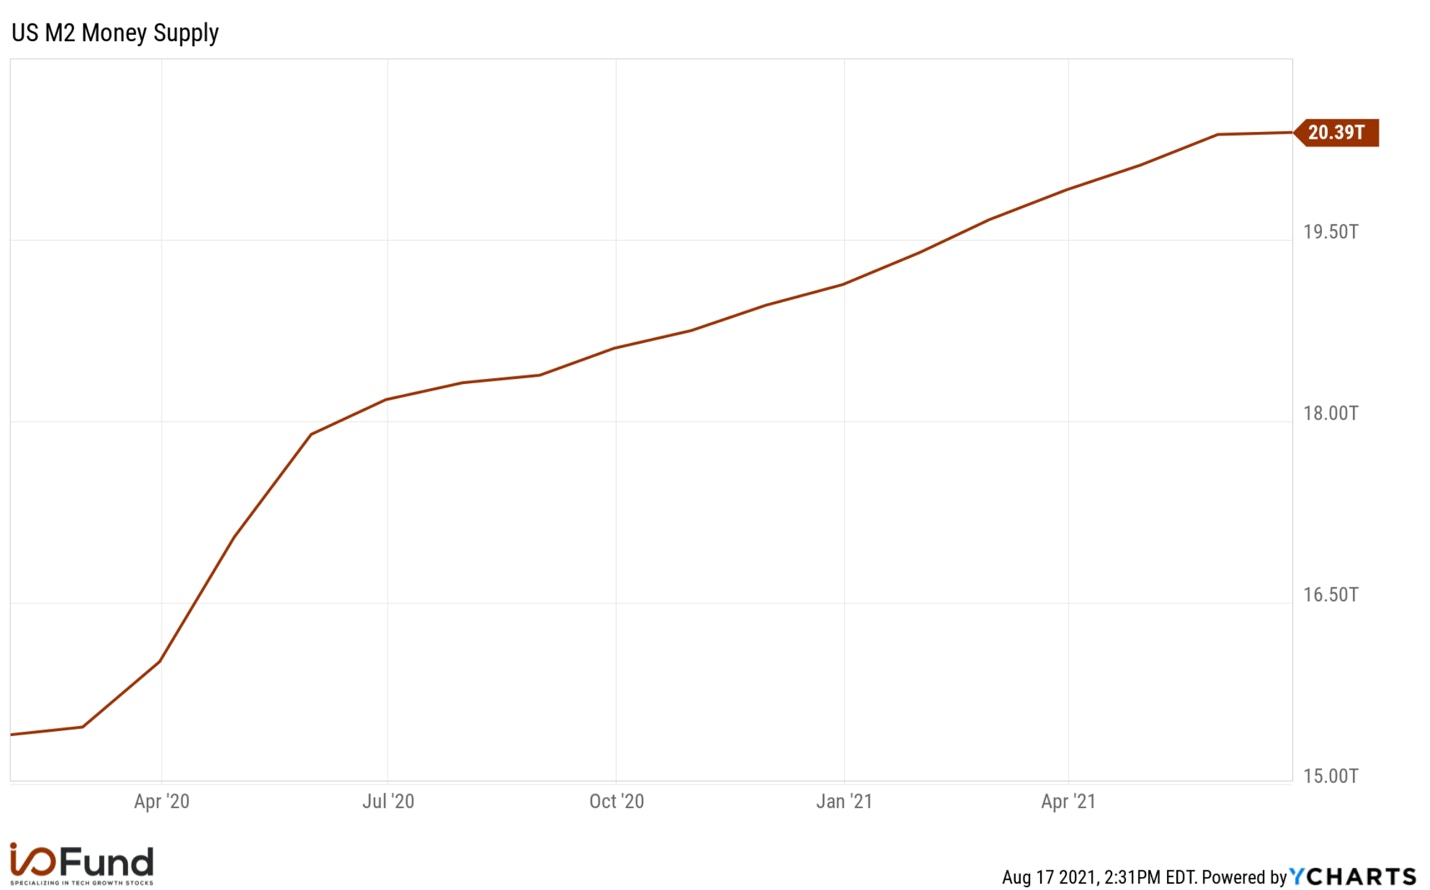
Since February of 2020, we have seen a greater than 30% increase in the M2. This is a clear increase in the level of the money supply that historically affects inflation. Coupled with the immediate shut down of intricate supply chains from the global COVID response, governments around the world have created an extreme case of more money chasing fewer goods. Even if supply chains come back to meet demand, the level of fiscal and monetary response will likely remain.
Further complications are found with the velocity of the M2 money supply. In other words, how fast is this new excess moving through the economy in the form of purchasing goods/services? This metric tells a different story. The speed of money moving through the economy is continuing its historic deflationary decline, even with the M2 money supply reaching its own historic increase.

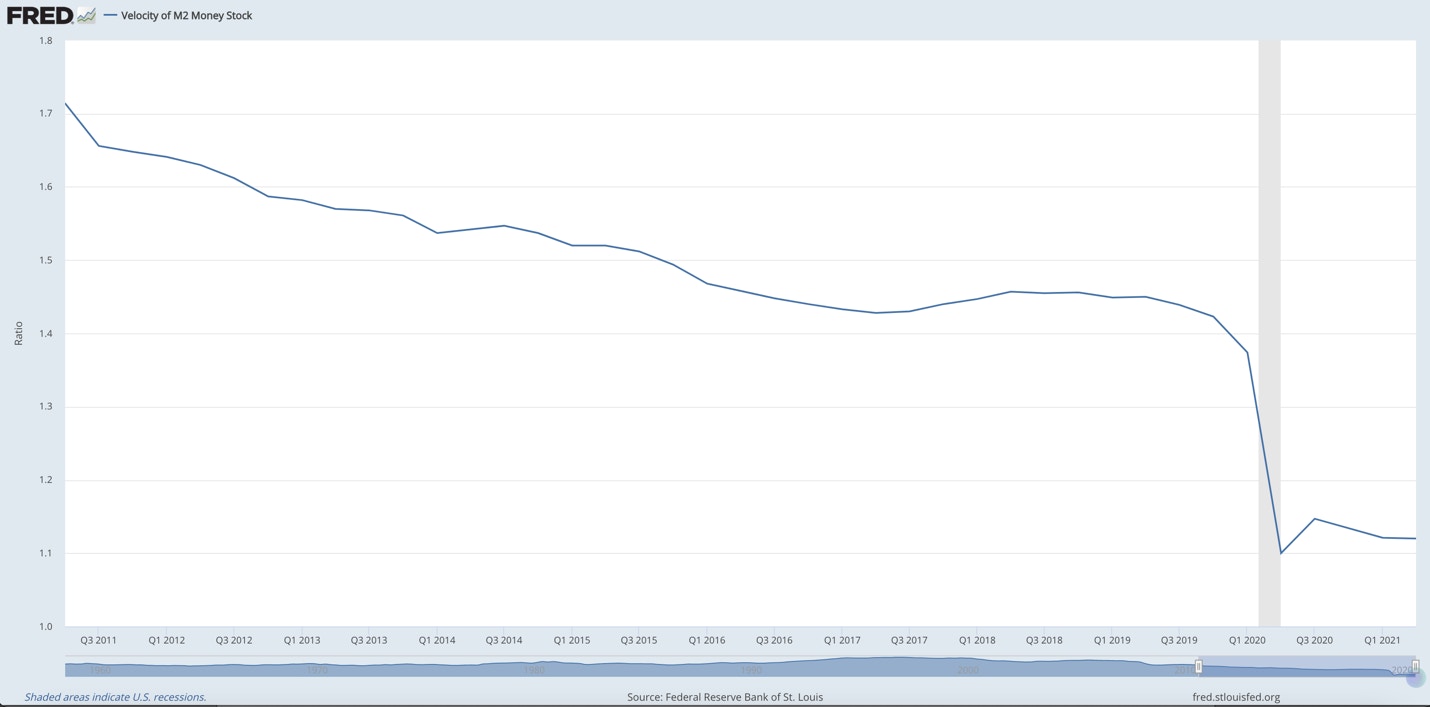
Source: FRED
Some have argued that this phenomenon would counteract the increase in M2. However, what appears to be happening instead is that we are seeing an unusual glut in the banking system that can’t be ignored. The result of these two facts – the increase in the money supply coupled with a decrease in the velocity of money - is that the excess of money being in the economy appears to be in the form of deposits into financial institutions. When you factor in that banks have a limit to the amount of money they can legally hold, it creates an oversupply in the system, which is ultimately what is going on with the reverse repo anomalies.
In short, a reverse repo is an agreement to purchase securities from an authorized institution in order to sell them back at a slightly higher price. Reverse repos (and repos) are used for short-term borrowing and lending, often overnight so that institutions can meet deposits and reserve requirements.
When you realize that these large institutions need to buy and sell overnight funds in order to meet deposits, as well as reserve requirements and reserve limits, it starts to make more sense. If more and more of these institutions have reached their limit on the reserves that they can take in, then less institutions can bid on the offerings, thus causing the issues we are now seeing.

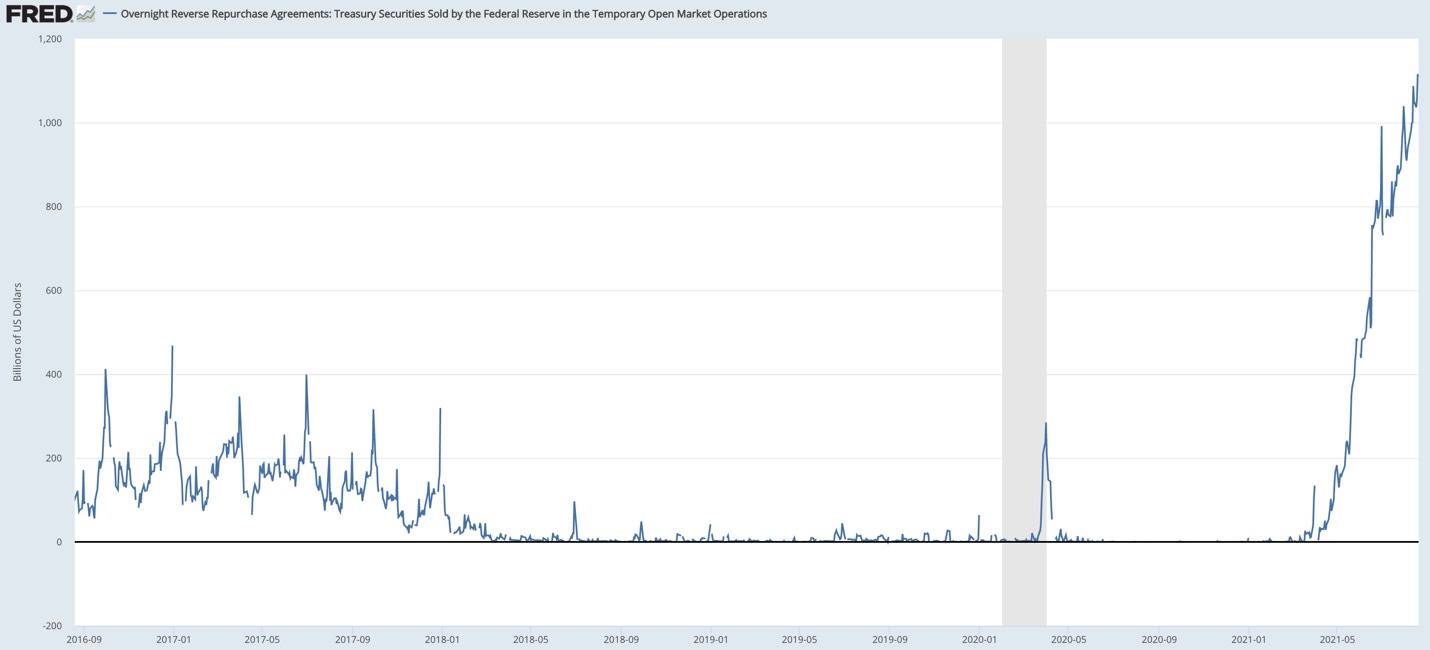
Source: FRED
These types of anomalies signal that there is too much liquidity in the system. This typically signals to the FED that they’ve reached their limit on the effectiveness of loose money effectiveness. What usually follows is a campaign to raise rates in order to tighten liquidity in the system.
In our last article, we discussed this chain of events and why it spooks investors. In short, inflation leads to bonds getting sold off in anticipation of the FED raising rates, thus pushing up rates and the cost to borrow. This eventually causes a top in equities, as the business cycle resets through a recession. This is why inflation is so important – it is the first indication that the party is coming to an end.
Regardless of where one stands on inflation, it’s important to acknowledge that the FED recognizes it. They do everything in their power to not surprise the market, and if you pay attention, they tend to signal their intentions well in advance. Recently a handful of historically dovish FED chairs have expressed their opinion that a rate hike needs to occur as early as September.
All signals are pointing to an imminent rate hike sooner than expected. Inflation is continuing its advance, the reverse repo rate is out of hand, and the FED has no choice but the tighten sooner than expected. So, is this the end of the bull market? As stated in our last report, “Even if inflation is likely not transitory, and here to stay, the markets are still telling us that the time to worry may not be right now.”
Yield Curve
Historically, a rare phenomenon that precedes a recession is an inverted yield curve. Investors are expected to be compensated for taking on more risk. When this gets reversed, and a 10 year bond is yielding less than a 2 year bond, this is what’s known as an inverted yield curve.
There are many reasons why this phenomenon might happen, the short answer is that investors have lost faith in the economy and pile into the perceived safety of longer dated bonds. It’s thus believed that the market will be in a recession in the intermediate future, so two-year bonds will likely come due in an environment with rates much lower than they are at the moment. Thus, we see a continued buying of longer duration bonds and the selling of shorter duration bonds.
An inverted yield curve has preceded every recession since 1956, including the 2020 recession. So, why wouldn’t investors just exit the market once this phenomenon happens? There are two primary reasons why:
- Once the yield curve inverts the economy falls into a recession, on average, within 24 months. Considering the stock market looks 6-9 months out, we can expect a peak in the stock market about every 1-1.3 months after the yield curve inverts.
- History tells us that some of the best gains in bull markets tend to happen in the final push.

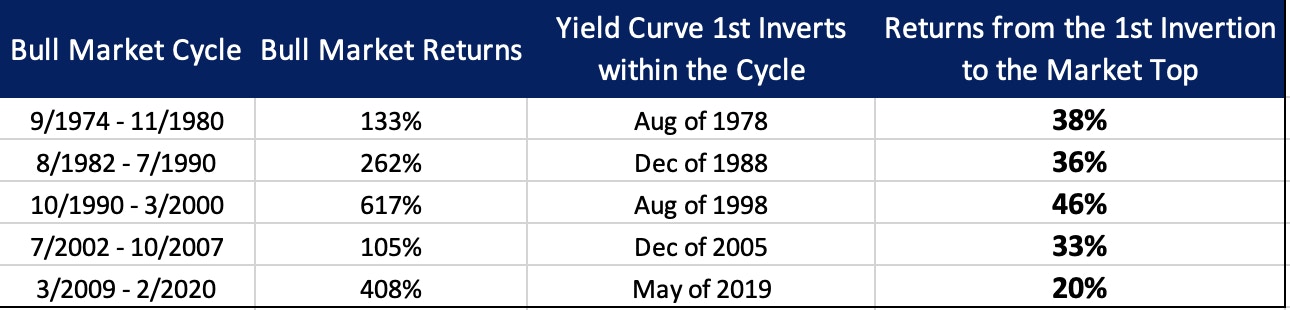
The above graph shows not only how long a bull market can continue from the moment of the yield curve inversion, but also the level of gains that typically happen in the final innings of the bull market.
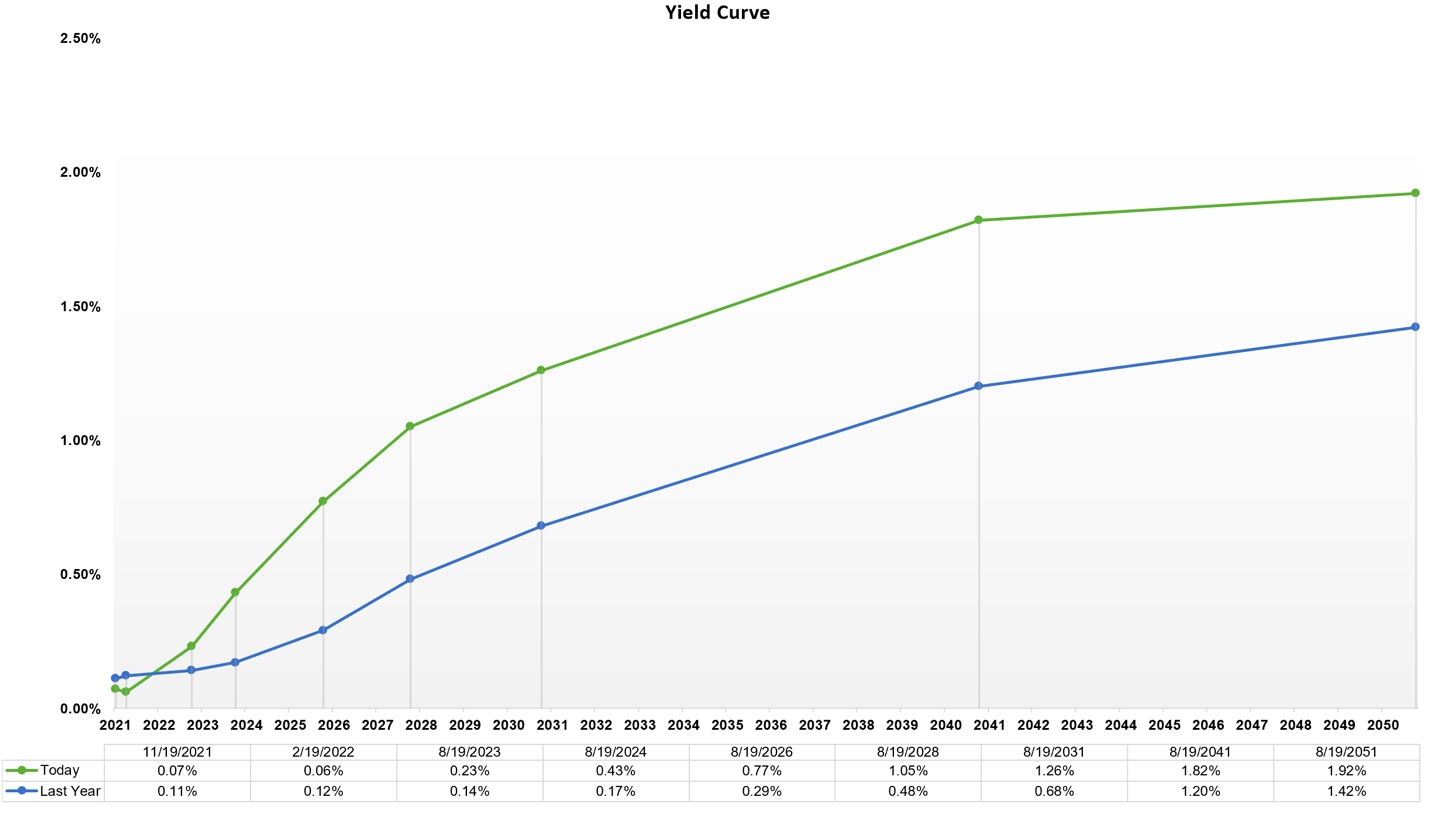
So where is the yield curve today? The spread between the 10 year yield and 2 year yield is just over +1%.

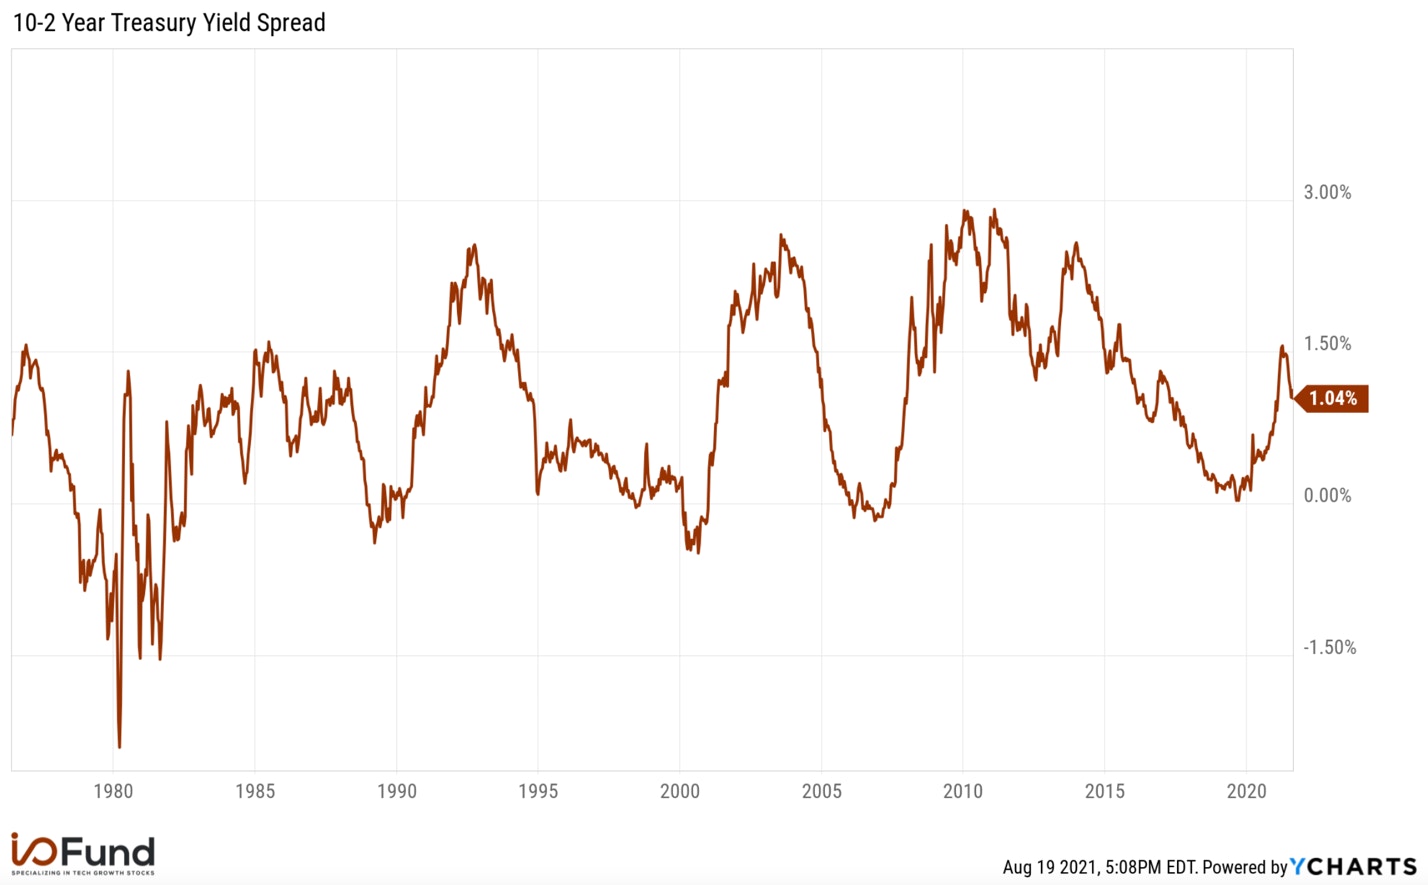
In other words, the yield curve is not inverted, and still showing a healthy slope. Short of a black swan event, the fact that we are not inverted yet suggests that the clock hasn’t started yet for the end of this bull market.

Intermarket Analysis
On February 16th, the high growth market topped, as rates and copper broke through important resistance levels. This signaled inflation was here; however, the extent of which was not fully known. Markets tend to sell first and ask questions later, thus we saw overreactions across the board in rising commodity prices and selloffs in growth stocks and bonds.
Since then, we have a clearer understanding of the extent of inflation we are facing, coupled with the FED announcing that they will likely increase rates sooner than expected. As a result, we are not seeing any trends that suggest the market is overly concerned at the moment.

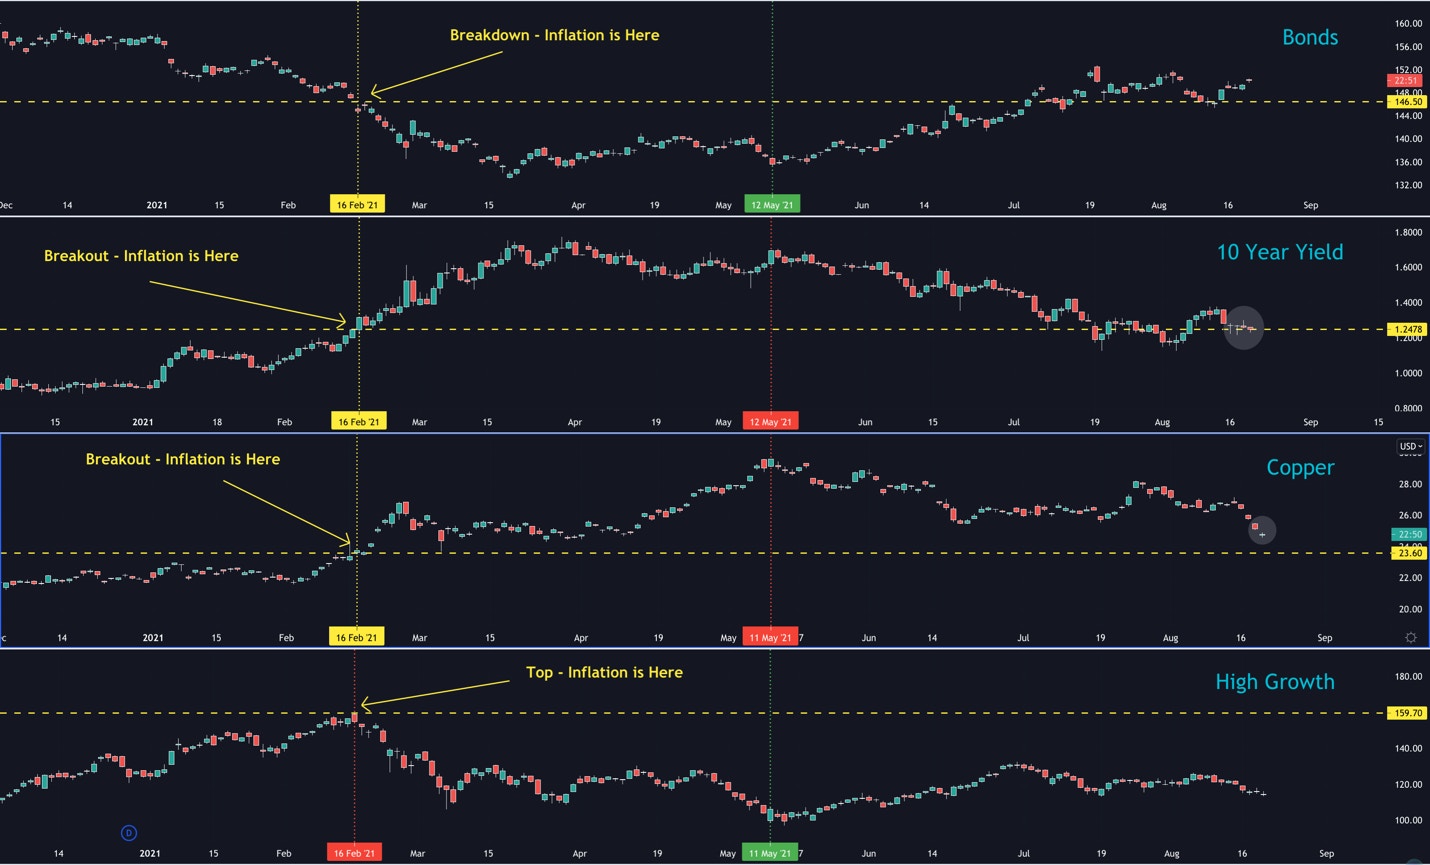
As the above chart shows, in light of this information, the bond market is continuing to catch a bid, as the 10-year yield is on the doorstep of breaking back below the price level that we saw before the February 16th reaction to inflation. Copper, along with most commodities, is making a lower low from its May 11th top, and is now threatening to test the support that signaled the February 16th breakout due to inflation fears.
Just as intriguing, these trends are continuing despite the various FED chairs’ comments about tightening sooner rather than later. These officials have a history for being dovish, so it is likely that their remarks will filter into policy. The fact that the market is not reacting to the Fed and the inevitable rate hikes means either the market is calling their bluff (and thinks a rate hike will not occur), or the market may not care about a small rate hike in the near future.
NASDAQ100 Levels to Monitor
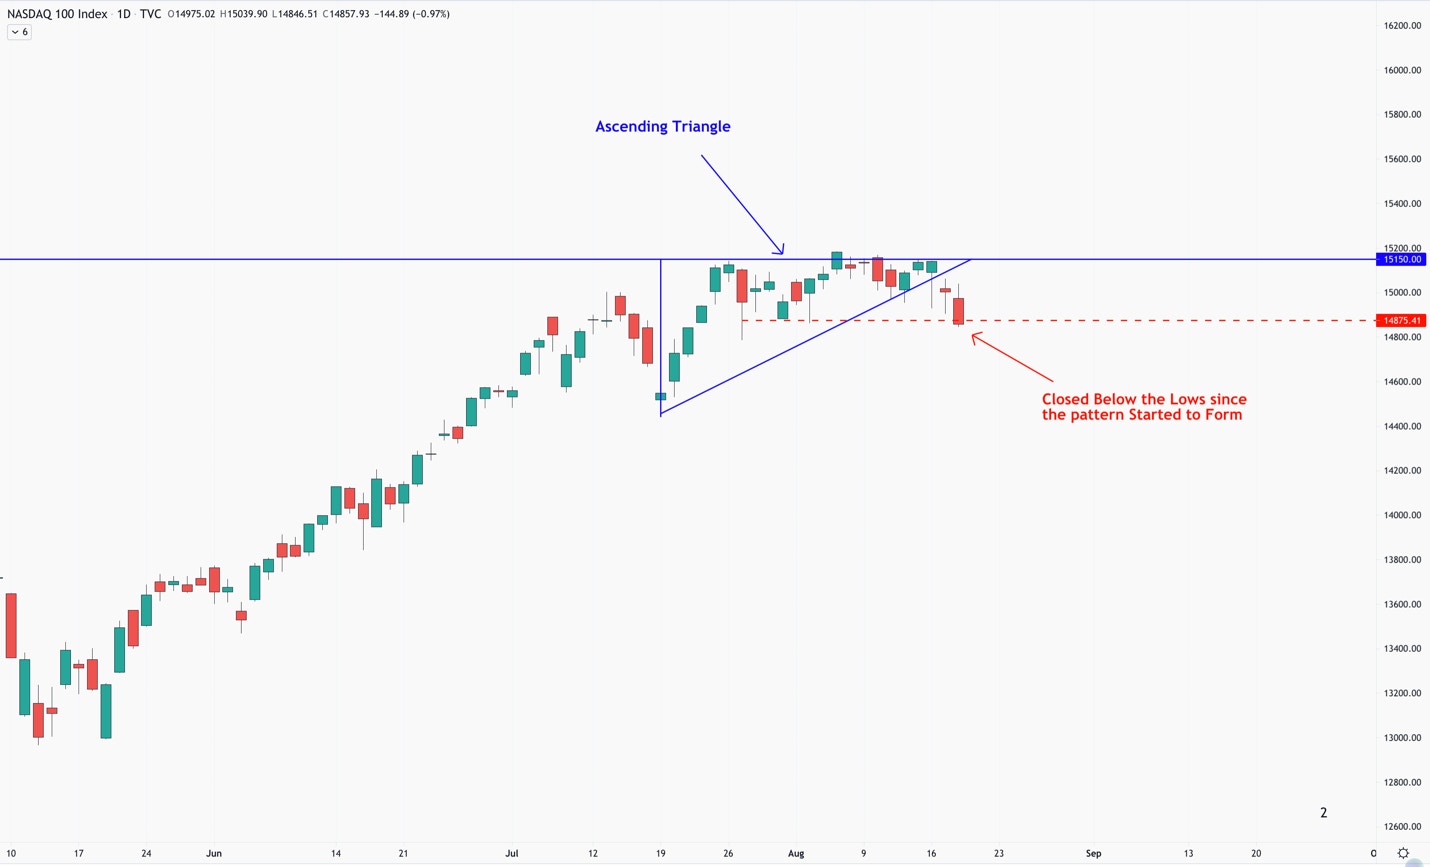
If we look at the NASDAQ100, one of our key benchmarks, we can see that price is in a classic coiling pattern just below the 15150 level. The pattern appears to be what’s known as an ascending triangle, which is marked in blue. This type of pattern typically resolves to the upside. However, Tuesday we saw a close below any low since the pattern started to form. This means that the immediate breakout scenario we were tracking has failed for now.

It’s my belief that the market is marching towards a large degree correction within a much larger uptrend. Whether that large degree correction has started or not will depend on what supports hold. Below is a visual of what I generally believe is playing out.

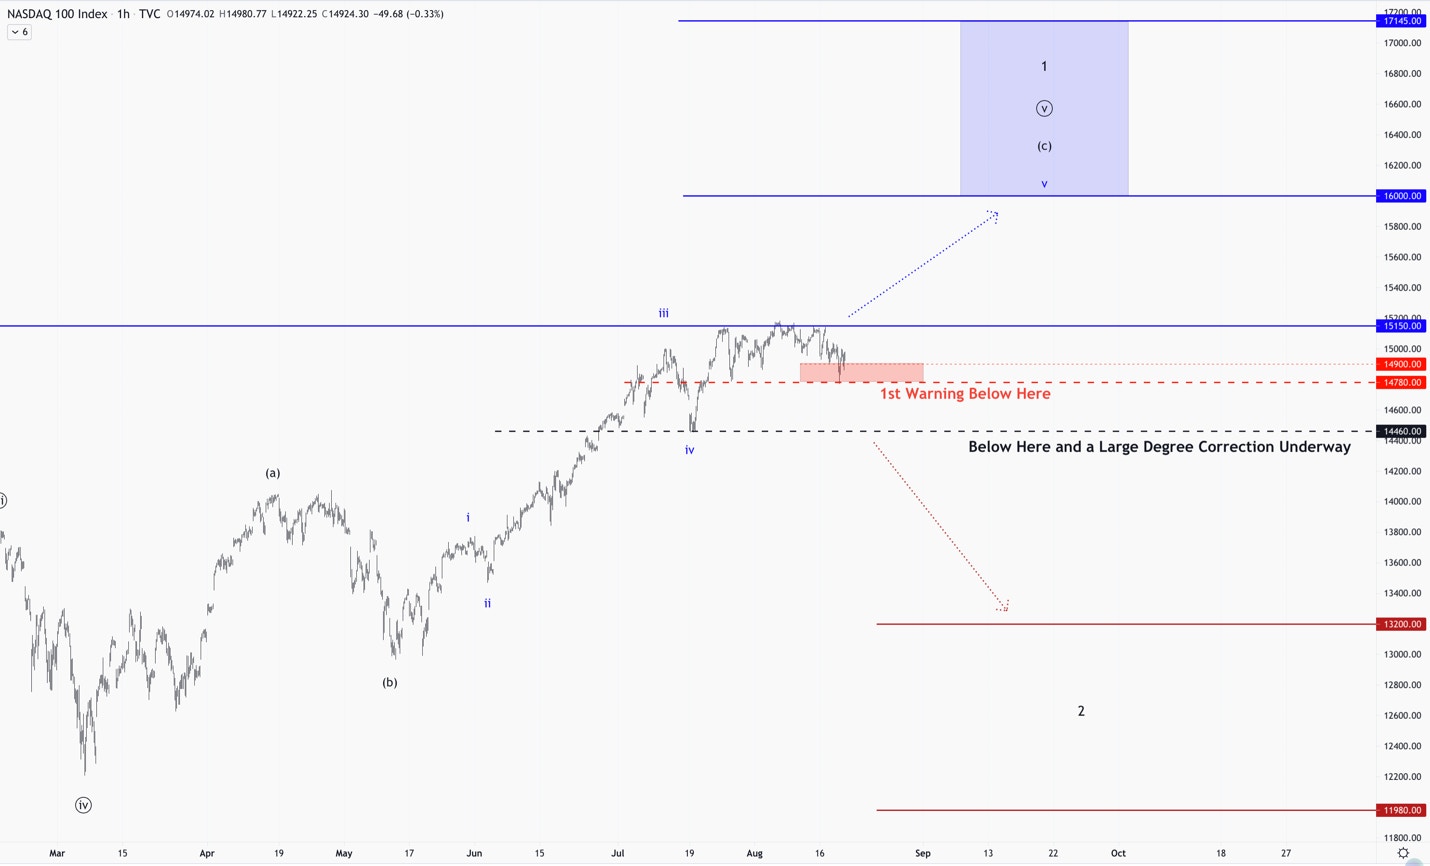
As long as NDX can hold the 14460 region, the blue path is my primary expectation. Below 14780 would shift the odds, and also be a warning sign. But, the key support that I am watching is if we break below the 14460 region. If this happens, then I’m expecting a large degree correction to play out, which should take us below the 13300 level at a minimum. If we can hold the above levels, then breakout above 15150, then we can see a push towards 16,000 NDX, at a minimum, before this larger degree correction plays out.
Regardless, what general scenario plays out, we view this coming correction as a necessary part of a much larger uptrend. Rising inflation data coupled with the realization that the FED will be raising rates sooner than expected. More times than not, this causes a larger degree correction than we’ve seen in quite a while, which I believe will likely happen within the next 30 days, if not already.
History tells us that the time to worry is when the bond market starts to worry. Once the yield curve inverts, we are officially on the clock, and plan to shift our strategy towards a long portfolio with tighter risk controls. We believe this market has much farther to run, but a much needed correction will need to reset sentiment for this to happen.


More To Explore
Newsletter

Nvidia and Google Are Crowding TSMC’s N3 Node - Can Intel Fill the Gap?
Nvidia is moving its next-generation Rubin GPUs from 4nm to 3nm, yet Google’s latest TPUs are already on N3 and are expected to remain there. Meanwhile, a growing number of AI CPUs from Nvidia, Amazon

Intel vs TSMC: How CoWoS Packaging Constraints Could Create an Opportunity for Intel Foundry
Taiwan Semiconductor (TSMC) is the single, most important company to the AI industry. However, to compete with the incumbent, Intel does not need to beat TSMC at leading-edge manufacturing. It only ne

Big Tech’s Free Cash Flow is Turning Negative – Who's Next?
Big Tech’s AI revenue is accelerating, but free cash flow is moving sharply in the opposite direction. Across Google, Microsoft, Meta and Amazon, capex is rising much faster than operating cash flow a
Big Tech Earnings Preview: Is AI Monetization Finally Catching Up to Capex?
The most pronounced difference between 2026’s tech rally compared to rallies in the past is which companies have been left out of it. The names most associated with the AI trade have hardly participat
Nvidia, CXL, and the Battle to Improve AI Inference Economics
This is Part 2 of our two-part series on AI inference economics. In Part 1 — Why Nvidia's Next AI Battle Is About Tokens per Watt, we laid out why tokens per watt has become the defining metric for in
Why Nvidia’s Next AI Battle Is About Tokens per Watt
As hyperscalers move from building AI infrastructure to monetizing it, tokens per watt helps to reflect if revenue is scaling and if profitability is improving. Offload engines can increase tokens per

Micron Is Up 900%. Here’s Why the AI Memory Trade May Still Have Room to Run
Over the past 10 months, memory chip stocks have gone from being solid beneficiaries of the AI boom to capturing a massively outsized piece of the return pie. The inflection in Micron’s performance de

Why the S&P 500 Shrugged Off the Iran War — and What Could Finally Break the Rally
On February 28th, the U.S. went to war with Iran, and the market was handed the kind of shock it hasn't contended with for years. The conflict set off a chain reaction across the region: an ongoing su

Nvidia, CoreWeave, and Nebius: Inside the Circular Financing of the GPU Boom
Neoclouds are one of the more hotly debated AI business models, with CoreWeave and Nebius being the two most widely recognized names. These companies have seen their sales, backlog, and share prices s

AMD, Nvidia, Arm, Intel: Inside the $120 Billion CPU Gold Rush
CPUs have gone from an afterthought to becoming the AI trade’s next great bottleneck – and with AMD, Nvidia, Arm and Intel circling a market that is doubling nearly overnight, the only question left i
