One More Rally to End the Year
December 22, 2022

Knox Ridley
Portfolio Manager
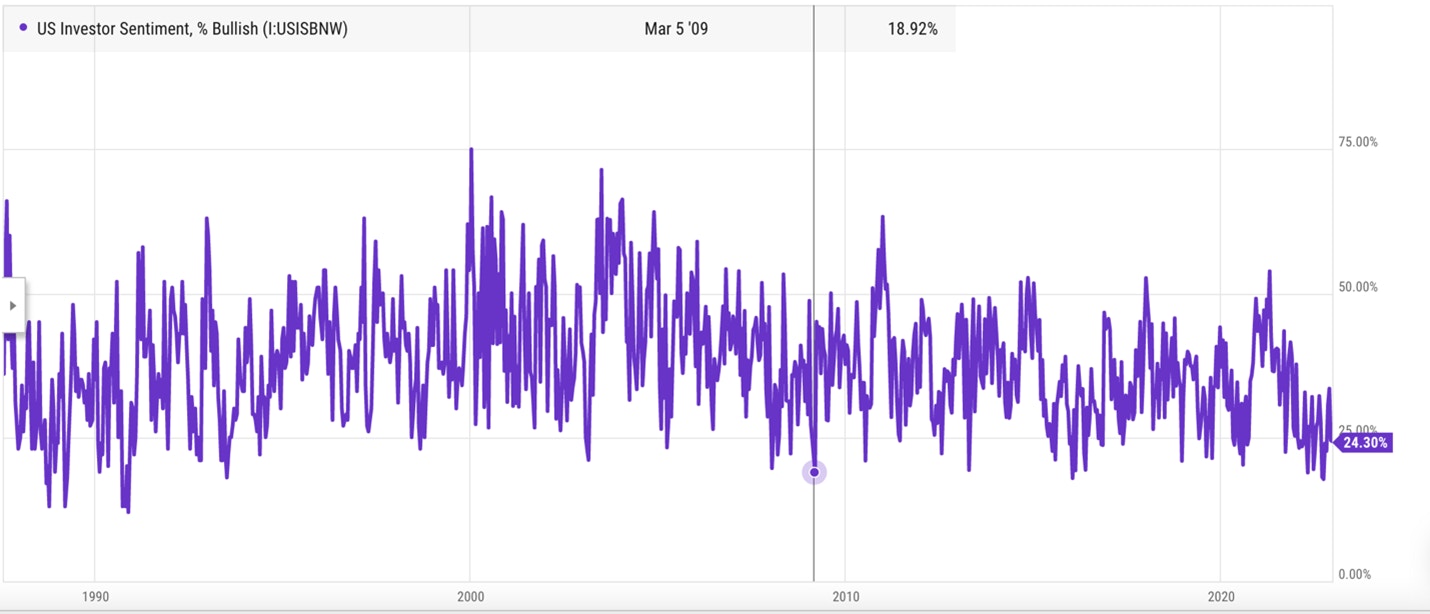
Sentiment continues to show some of the most bearish readings we’ve seen since the 2022 bear market began. The AAII, which is a survey that asks investors if they are bullish, neutral or bearish 6 months out, just gave us the lowest reading of bulls since the October low.
Recently, only 24% of those surveyed are expecting bullish results over the next 6 months. Compared with the March low in 2009, this is not too far off that reading, which came in at around 19%.

When we look at the options market, we are seeing a similar rare pattern that has only occurred two times in the last 16 years. This is when we see an outsized ratio of puts being bought while the market is in an uptrend.

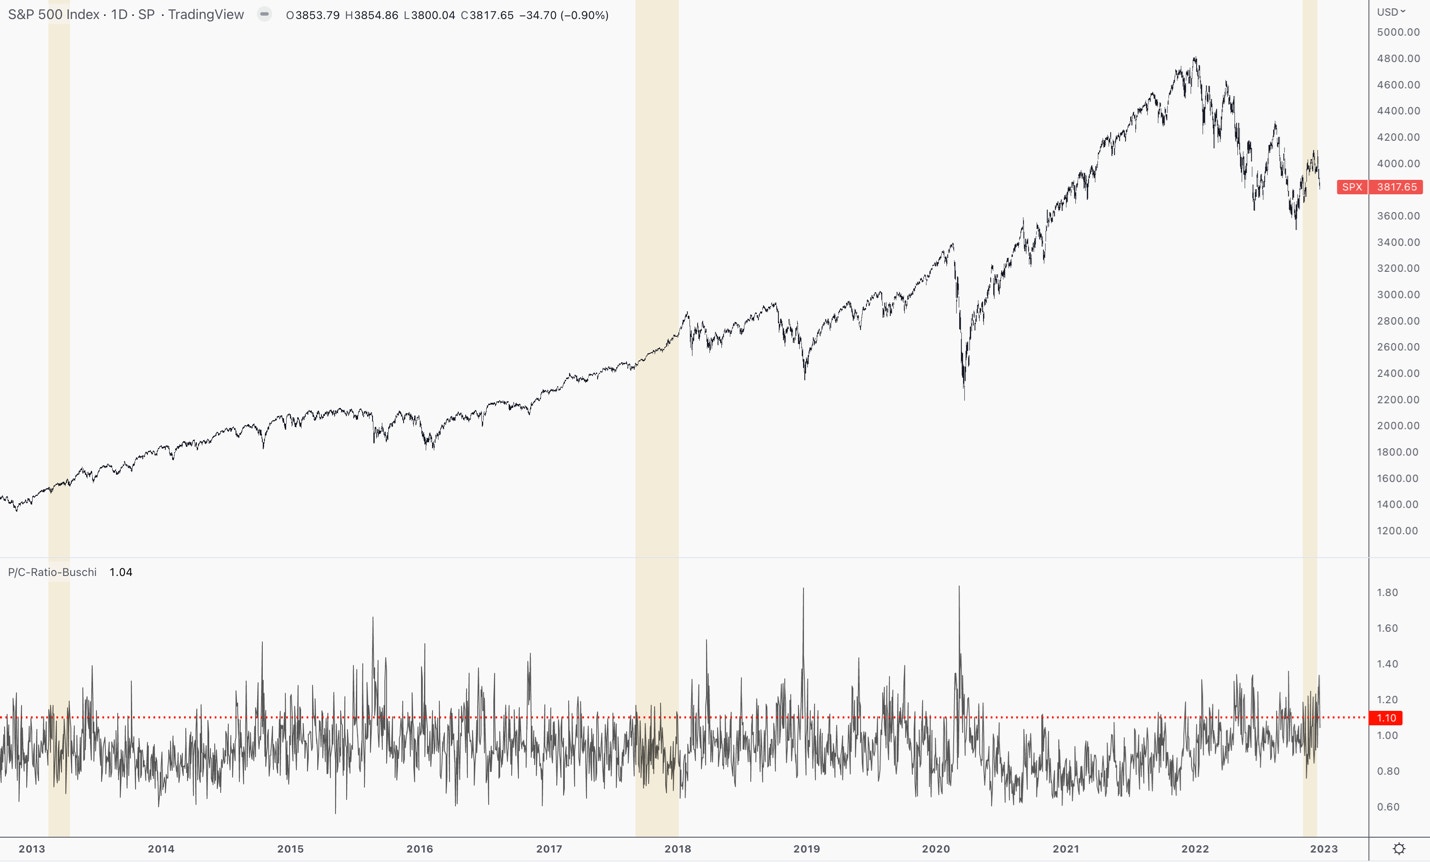
Regarding the put/call ratio, any reading over one signals that more puts are being bought over calls. A reading over 1.1 is reasonably rare, which I would consider a fear spike. What you’ll notice is that fear spikes occur mostly in downtrends, and culminate around the lows. The tan regions show multiple fear spikes occurring while the market is in an uptrend (2013, 2017, 2022). Each instance prior saw higher stock prices before a correction began.
Rarely do we see the market rewarding a crowded trade. Even when that trade makes the most sense. In order for a setup to go lower, we need to see sentiment reset. There is a high level of bearish bets right now, and these will likely need to unwind if we are going lower.
Interestingly, this lines up with what we have been saying for the last 3 weeks here, which is summarized in the most recent YouTube video below.
We have been raising large sums of cash throughout late November/early December in preparation for a volatile month. The volatility has only increased the number of bearish bets in the market as many stocks approach oversold conditions again. We believe that the market is setting up for another rally, which should last through early January.
Sign up for I/O Fund's free newsletter with gains of up to 221% - Click here
Whether we drop to new lows, or continue higher is yet to be seen. There are some markets in the US and abroad that have clean setups to new highs, which we’ve discussed here and here. This would certainly be the contrarian perspective going into 2023, which is worth acknowledging. However, the global central banks went on an aggressive rate hiking campaign while shifting global trade dynamics are exacerbating inflationary pressures worldwide. This is happening while we are experiencing drastic decelerations in key tech sectors, which we discussed here. So, we are not married to a thesis, and are ready to shift in either direction once we get clear signals. We believe the biggest risk that investors face going into 2023 is thinking they know what will happen and not considering there is more than one possibility.
In conclusion, we believe there will be a Christmas Rally of sorts as the probability favors a move higher as we enter 2023 into the first couple of weeks of January. Both the market internals and sentiment have reached a level of bearishness that rarely leads to a prolonged drop. Look for this to reset before we go lower.
Regarding the long-term narrative, instead of leaning into a thesis, we prefer to let price action determine whether we hedge, or leverage our portfolio to the long side. This neutral stance has been rewarding for us as an all-tech portfolio. As of now, we are leading our all-tech peers and our audited results will be out in Q1 of 2023.
Please note: The I/O Fund conducts research and draws conclusions for the company’s portfolio. We then share that information with our readers and offer real-time trade notifications. This is not a guarantee of a stock’s performance and it is not financial advice. Please consult your personal financial advisor before buying any stock in the companies mentioned in this analysis.


More To Explore
Newsletter

Nvidia and Google Are Crowding TSMC’s N3 Node - Can Intel Fill the Gap?
Nvidia is moving its next-generation Rubin GPUs from 4nm to 3nm, yet Google’s latest TPUs are already on N3 and are expected to remain there. Meanwhile, a growing number of AI CPUs from Nvidia, Amazon

Intel vs TSMC: How CoWoS Packaging Constraints Could Create an Opportunity for Intel Foundry
Taiwan Semiconductor (TSMC) is the single, most important company to the AI industry. However, to compete with the incumbent, Intel does not need to beat TSMC at leading-edge manufacturing. It only ne

Big Tech’s Free Cash Flow is Turning Negative – Who's Next?
Big Tech’s AI revenue is accelerating, but free cash flow is moving sharply in the opposite direction. Across Google, Microsoft, Meta and Amazon, capex is rising much faster than operating cash flow a
Big Tech Earnings Preview: Is AI Monetization Finally Catching Up to Capex?
The most pronounced difference between 2026’s tech rally compared to rallies in the past is which companies have been left out of it. The names most associated with the AI trade have hardly participat
Nvidia, CXL, and the Battle to Improve AI Inference Economics
This is Part 2 of our two-part series on AI inference economics. In Part 1 — Why Nvidia's Next AI Battle Is About Tokens per Watt, we laid out why tokens per watt has become the defining metric for in
Why Nvidia’s Next AI Battle Is About Tokens per Watt
As hyperscalers move from building AI infrastructure to monetizing it, tokens per watt helps to reflect if revenue is scaling and if profitability is improving. Offload engines can increase tokens per

Micron Is Up 900%. Here’s Why the AI Memory Trade May Still Have Room to Run
Over the past 10 months, memory chip stocks have gone from being solid beneficiaries of the AI boom to capturing a massively outsized piece of the return pie. The inflection in Micron’s performance de

Why the S&P 500 Shrugged Off the Iran War — and What Could Finally Break the Rally
On February 28th, the U.S. went to war with Iran, and the market was handed the kind of shock it hasn't contended with for years. The conflict set off a chain reaction across the region: an ongoing su

Nvidia, CoreWeave, and Nebius: Inside the Circular Financing of the GPU Boom
Neoclouds are one of the more hotly debated AI business models, with CoreWeave and Nebius being the two most widely recognized names. These companies have seen their sales, backlog, and share prices s

AMD, Nvidia, Arm, Intel: Inside the $120 Billion CPU Gold Rush
CPUs have gone from an afterthought to becoming the AI trade’s next great bottleneck – and with AMD, Nvidia, Arm and Intel circling a market that is doubling nearly overnight, the only question left i
