FAANGs are not Leading this Market Lower
November 04, 2022

Knox Ridley
Portfolio Manager
Weekly Stock Market Levels - 11/03/22
11/03 Broad Market Levels Timestamps
00:00 - Intro/A Quick Recap on Divergences
02:39 - Knox's Primary Count/Scenario
04:01 - The Leading Diagonal Scenario
05:29 - Key Levels
06:55 - Caterpillar and the Global Economy
07:30 - The Financial Sector
09:20 - High Beta ETF iShares
10:15 - Above 3,912 - Bullish/Below 3,640 - Be Cautious/Outro
Yesterday, the statement released by the FOMC saw the first sign of a less-hawkish tone since this rate hike began in early 2022. Inflation data continues to suggest a downward trend, yet not at the rate most would like, including the FOMC.
That being said, the statement that followed the 75 bps hike acknowledged that the FOMC will take into account the “cumulative effect” of their rate hikes, as they also acknowledged the lagging effect of their actions in relation to the economy.
This implied that the FOMC is aware that the actions already taken will take time to filter into the economy, so they may not need to aggressively raise until these changes are obvious. The market jumped 1.5% on this announcement, as pundits began to suggest a pause was insight, but did not hold.
In the speech that followed, Jerome Powell, the FED chair, rolled back the hope of a slow down. He acknowledged that inflation has not come down, even though supply chain issues that plagued most of 2021/2022 have been resolved. He also stated that they are nowhere near contemplating a pause in rate hikes and that we still have farther to go, both in % hikes and in duration that they need to stay elevated. The press conference ended, as the S&P 500 closed down -3.4% from its intra-day high, marking the worst sell off on a FED day since January of 2022.
Most assume that we are now setting up for a fresh low in the S&P 500. This has been the trend preceding each FED meeting this year. However, in order to get the market trending in another deep drop, we tend to see all markets and most stocks moving together, and this is not what we are seeing right now. While we believe that some weak tech stocks, as well as the NASDAQ-100 could make a new low, there are simply too many divergences within the U.S. and globally to suggest another deep push lower is likely. Instead, it appears that the complex bottoming process we have been discussing is continuing to build.
FAANGs are Not Leading
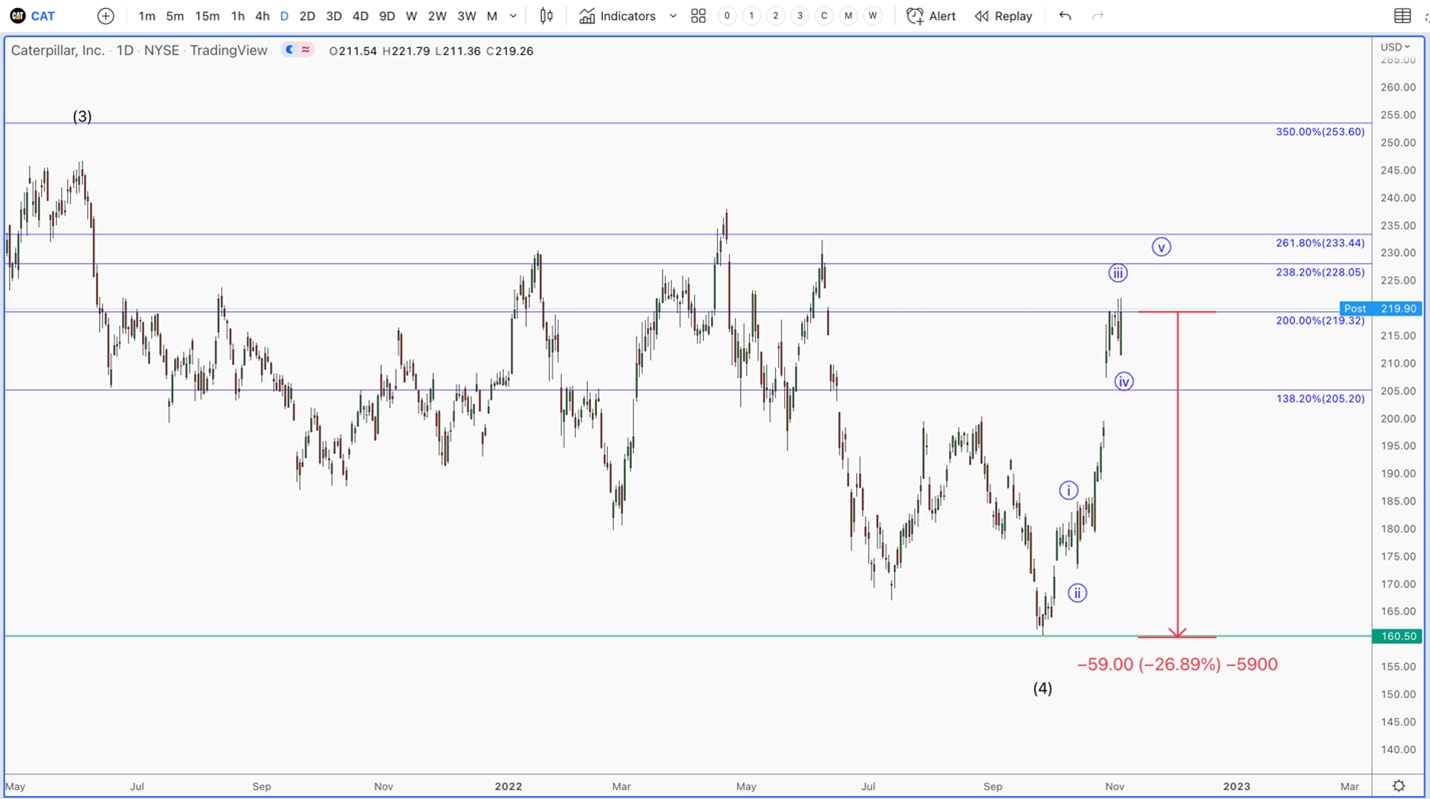
While Amazon and Google made new lows, few paid attention to Caterpillar (CAT) and JP Morgan (JPM). Caterpillar is a key stock within the global economy. Because it builds and distributes quality heavy machinery globally, it tends to act as a leading indicator for global growth.
Its chart continues to suggest that this bear market was a 4th wave in a larger uptrend. This means the next larger rally should lead to new highs for CAT. Furthermore, it is currently 28% off its lows, and comfortably holding the gap from its excellent earnings report.

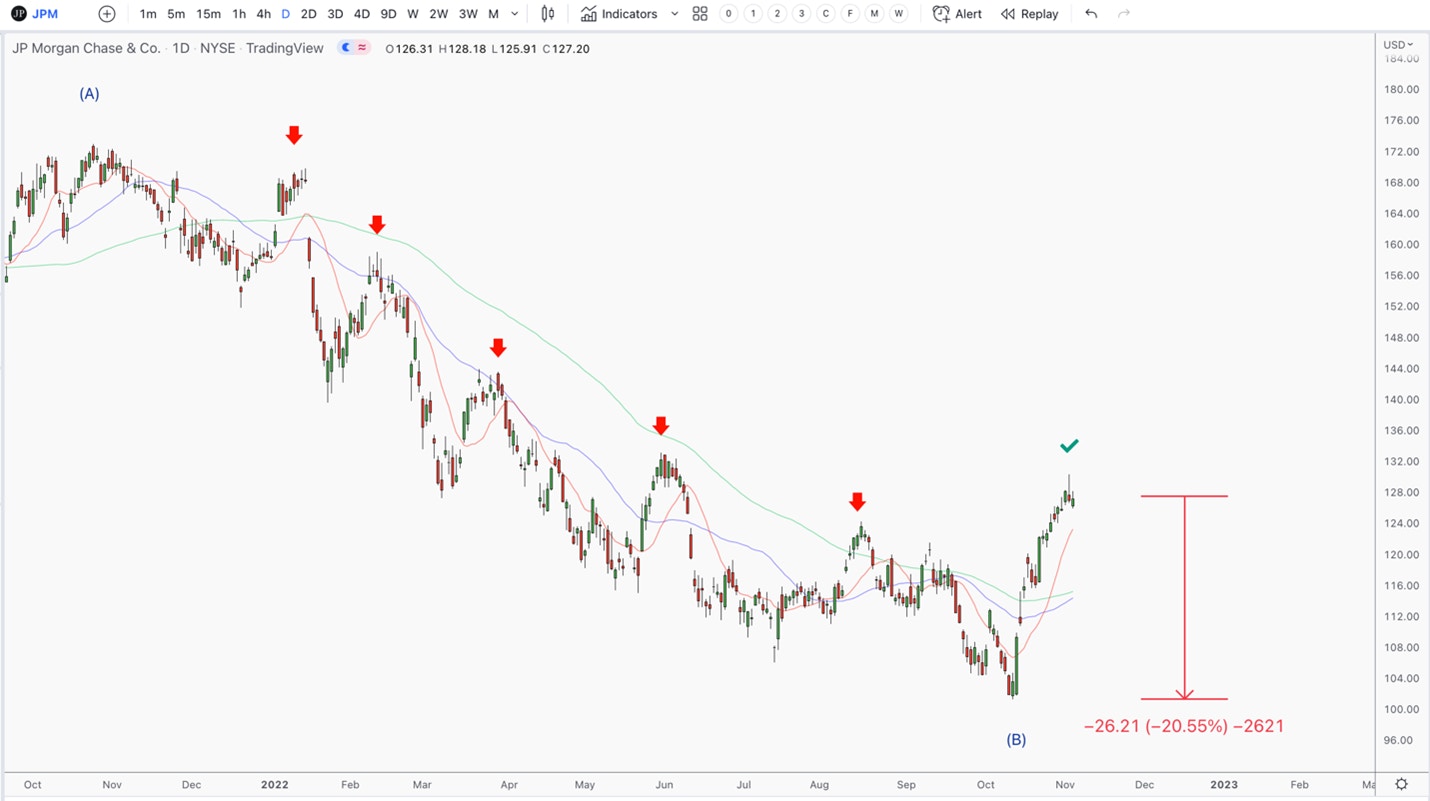
JP Morgan is arguably the most important bank in the world. Though the market cap of the financial sector is not as large as tech, historically, the worst bear markets we have seen throughout history tend to come from trouble within this sector. When banks are in trouble, the market is real trouble. This is just not the case today.
JP Morgan reported net interest income (NII) this quarter of $17.6 billion. It also guided for NII of $61.5 Billion for the year, beating expectations of $58 Billion. So, the higher rates go, the more NII a bank is expected to receive as the 30-year mortgage rate increases. This means that banks are expected to continue to benefit from the aggressive policies at the FED.
Even more astounding, JP Morgan announced that they currently have $1.2 Trillion dollars in excess cash (not a typo). This is signaling that the banks are not in trouble, yet. In fact, the opposite seems to be the case, and it is showing up in the chart, as JPM is 20% off its low and holding a bullish posture. Furthermore, it just broke its downtrend by making its first higher high, after 5 failed attempts.

Bonds Ignored the FED
Another interesting reaction to the FOMC announcement was the bond market. The longer out on the curve you go, the less of an effect the FED has on rates, and the more of an effect growth and inflation expectations have on rates. After every hawkish policy decision this year, we have seen rates go higher, as long duration bonds make a fresh low.
We have been discussing for several months that TLT, the ishares +20 year bond ETF, has been setting up for a major low, which will be a tailwind for beaten down tech. The reason for this reversal is the technical pattern in TLT’s chart.
Corrections, on all time frames, tend move in 3 waves – A wave down, B wave retraces some of the A wave’s decline, followed by the devastating C wave to new lows. This C wave always unfolds in 5 waves with peak volume and momentum on the 3rd wave, followed by a 5th wave lower on less volume and less momentum. This is exactly what has been transpiring.

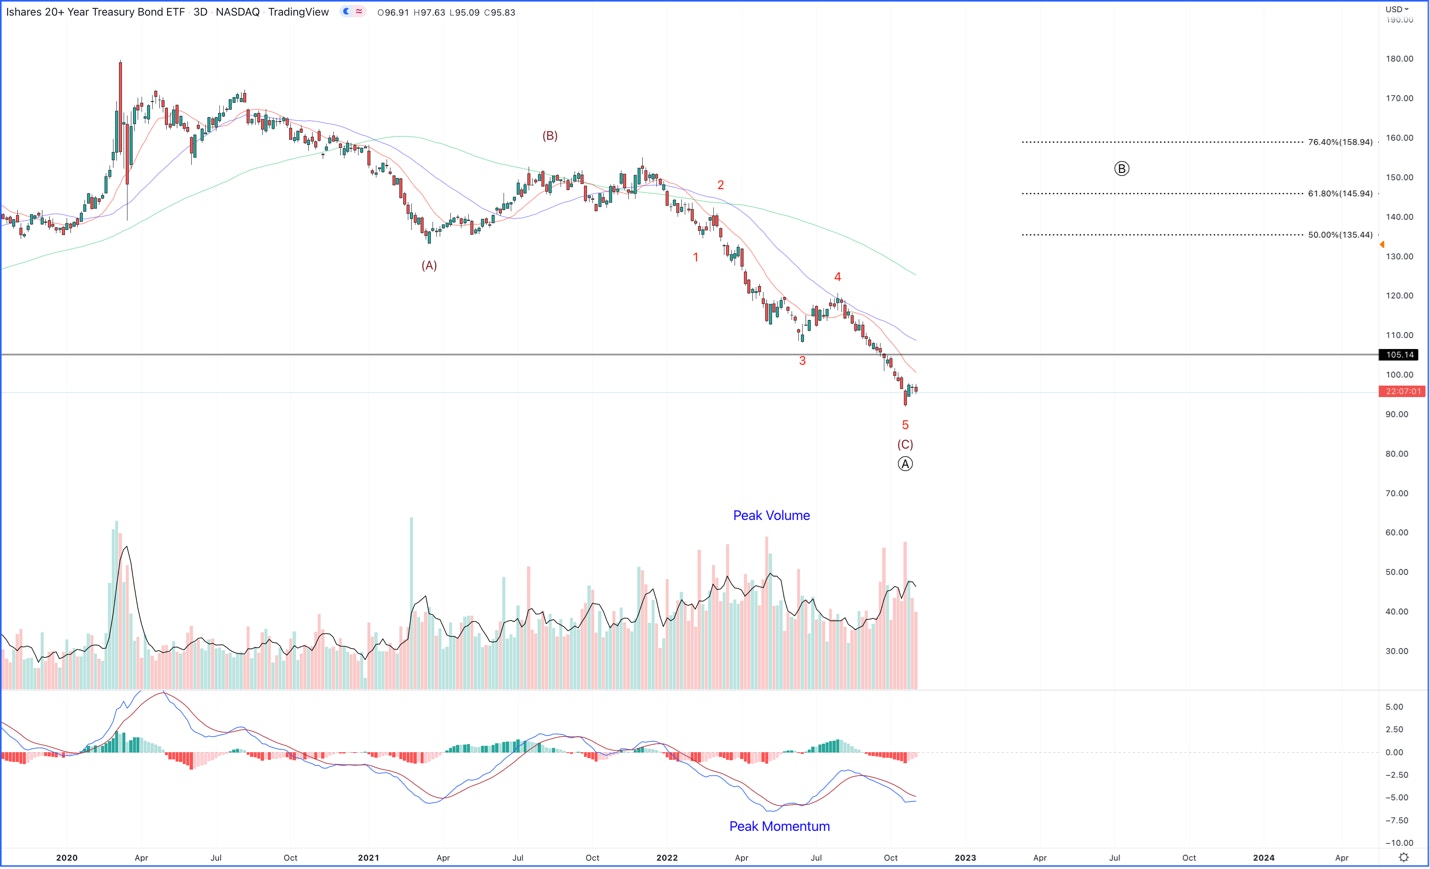
Most importantly, if the FED’s recent attempt to throw cold water on a rally didn’t spread to rates. In fact they seem to be consolidating on the news, which is good. If rates fail to make a new high on this news, a meaningful low for bonds (and equities) is likely setting up.
Market Levels
The DOW was flashing warning signs going into the FED meeting. Not only was it extremely oversold, but we were getting a negative RSI reversal sign – when the momentum indicator below is making a higher high and price is making a lower high. This coupled with the bellow indicator reaching a level that marked prior pullbacks had us on high alert.

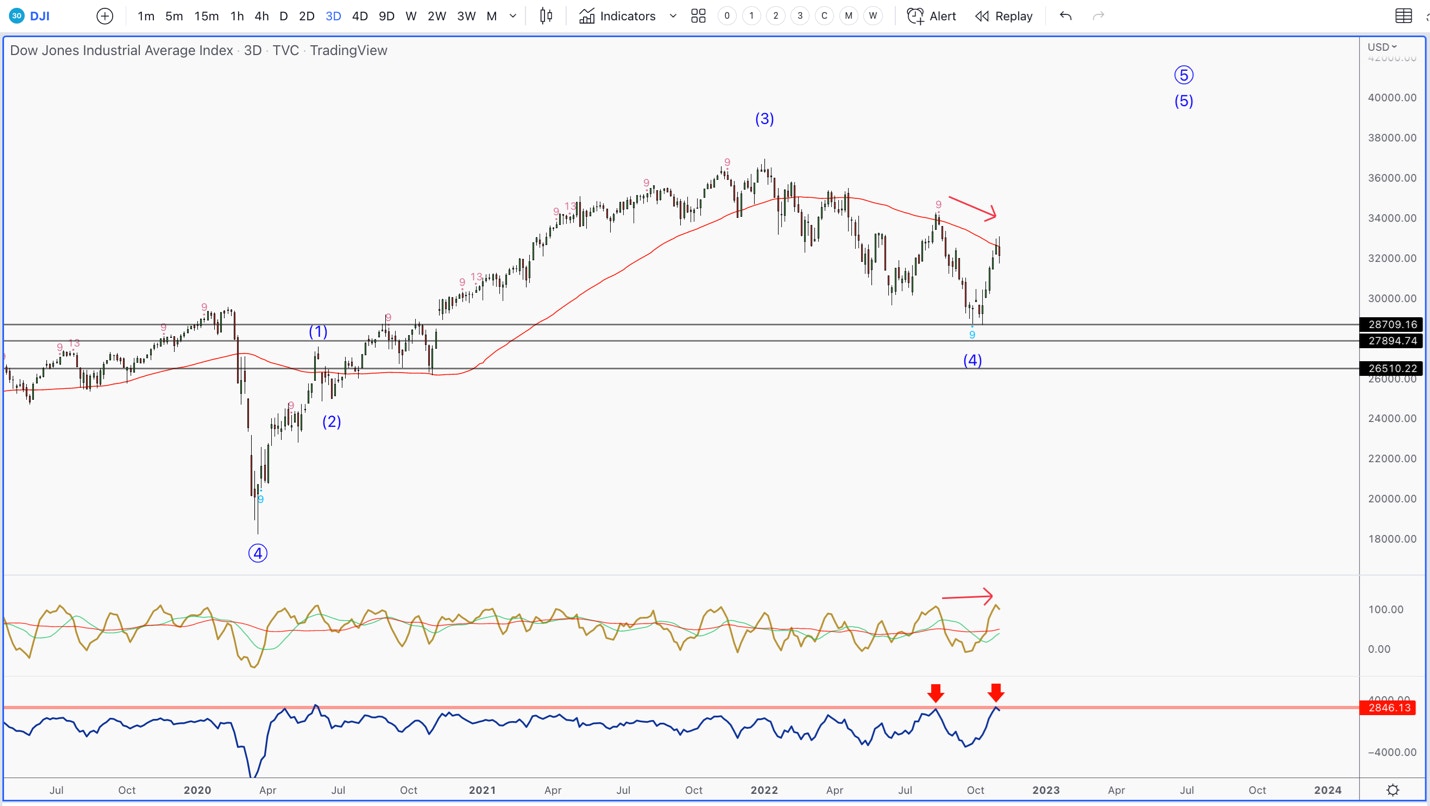
It's important to recognize the market rallied 10-12% on the rumor of a slow down by the FED. Whether you believe we got that or not, the market clearly sold the news.
With the divergences we are seeing and have been talking about for several weeks here and here, if we do see continued volatility, it will likely be setting up a buyable low. Where man stocks make a lower high, while some weaker tech stocks make a lower low.
Regarding the S&P 500, these are the levels that we are watching for confirmation.
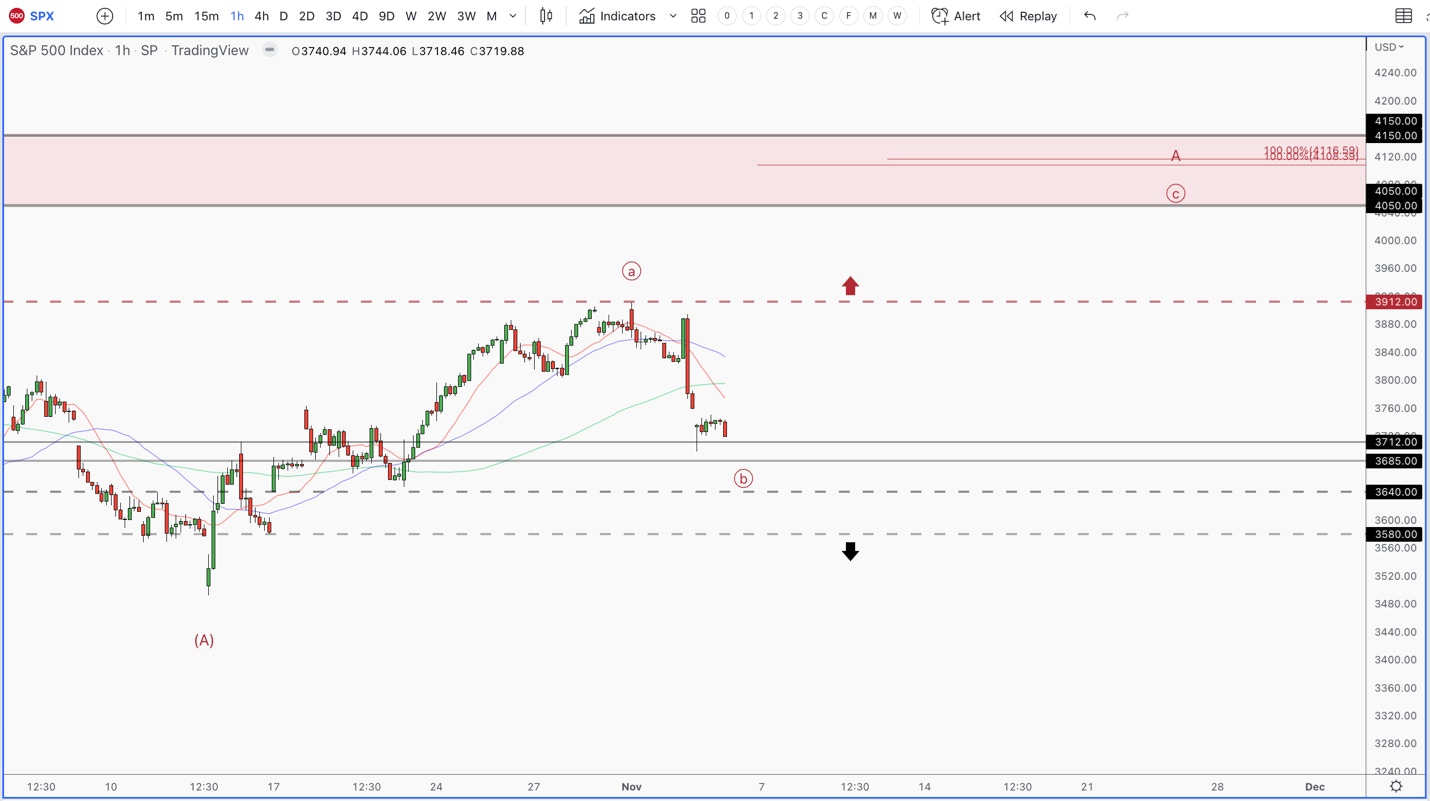
If we break below 3640-3580 SPX, we will start getting defensive. This will signal that we could be in for a deeper drop than expected. I have a hard time with this because typically when we see deep and sharp moves lower, it is due to a black swan event, which no one can plan for, or all markets and most stocks are moving in unison. As you can see, this is simply not the case right now.
If we can get back above 3912 SPX, this will be the first FED high the market has reclaimed. It will also be telling us that the market has priced in peak inflation and this rate cycle.
In conclusion, I expect to see some tech stocks make new lows, while other value stocks hold their lows. The FANNGs do not appear to be leading, as we have been accustomed to expect. However, weakness in these companies does not seem to be signaling weakness across the market. In fact, new leadership is developing, which does include one FAANG name. As long as rates hold their high, and many of the value stocks that are well of their highs hold, I see the coming volatility as a buyable event.
Every Thursday at 2:30 pm Eastern, we provide our weekly market webinar where we will discuss recent earnings reports, as well as analyzing specific stock charts. Our goal is to provide context, as well as identify actionable exits and entries for investors. We have used this information to successfully hedge our portfolio multiple times in 2022, as well as build positions at key levels.
Get Critical Weekly Stock Market Analysis during Stock Market Crashes
On the I/O Fund premium site, we provide weekly webinars that discuss what the I/O Fund is buying and selling. We also have a proprietary hedging signal that we monitor in real-time. Following the analysis, we provided for free on YouTube last month “This is Still a Warning Sign” and also in this article “Why the Next Two Weeks Could Determine 2022” we hedged going into the CPI number for a nice gain in a tough market and have had a hedge in place most of September
To watch more stock market analysis videos, follow me on YouTube here or sign up for the I/O Fund free newsletter to be notified when I publish the next weekly webinar.
Sign Up for the Next Premium Webinar where we continue to discuss Stock Market Bounces
About I/O Fund Portfolio Manager Knox Ridley
Knox Ridley began consulting on portfolios in 2007 and is an experienced growth investor in both bull and bear markets, which is hard to find these days. As the portfolio manager of the I/O Fund, he beat the top-performing funds on Wall Street in both 2020 and in 2021. His real-time trade notifications to premium subscribers have garnered 27 entries with over 100% gains in the last two years. Knox began his career as an ETF wholesaler in 2007 before becoming a portfolio consultant for large RIAs, FAs, and Institutional accounts. He is very keen on macro trends and is trained in Fibonacci Trading, Elliott Wave theory, as well as Gann Cycles. He also uses classical technical analysis to manage risk and identify great risk/reward setups. Knox is known for increasing and decreasing allocations for record-breaking returns.
To get more free stock analysis on fundamentals and technicals, sign up for I/O Fund's free newsletter with gains of up to 403% - Click here.
About I/O Fund Premium Stock Investing Services
Premium Members currently enjoy all 7 Premium benefits below.
- Premium library of institutional-level research and analysis, including fundamental stock analysis and advanced market signals on technicals and macro analysis.
- Weekly Webinars on advanced market signals and broad market, plus quarterly portfolio reviews on Long-Term Buy and Hold tech stocks.
- Technical Analysis on stocks and Broad Markets with charts on all major US markets, analysis of inflation and growth, as well as 60 global markets to help us focus on risk/reward for entries and position our portfolio based on the macro-environment.
- An Active Forum made up of a community of like-minded investors with robust conversations including both fundamental and tech product analysis.
- A completely Transparent Portfolio made up of long-term buy and hold positions, crypto, and Long/Short Momentum positions.
- Trade Alerts are sent directly to your phone via SMS and email.
- NEW! Automated Hedge with advanced signals to help spot approaching risk in the markets, with a 67% win rate going back to 2003 with only 40 signals triggered.
Please note: The I/O Fund conducts research and draws conclusions for the Fund’s positions. We then share that information with our readers. This is not a guarantee of a stock’s performance. Please consult your personal financial advisor before buying any stock in the companies mentioned in this analysis.


More To Explore
Newsletter

Nvidia, CXL, and the Battle to Improve AI Inference Economics
This is Part 2 of our two-part series on AI inference economics. In Part 1 — Why Nvidia's Next AI Battle Is About Tokens per Watt, we laid out why tokens per watt has become the defining metric for in

Why Nvidia’s Next AI Battle Is About Tokens per Watt
As hyperscalers move from building AI infrastructure to monetizing it, tokens per watt helps to reflect if revenue is scaling and if profitability is improving. Offload engines can increase tokens per

Micron Is Up 900%. Here’s Why the AI Memory Trade May Still Have Room to Run
Over the past 10 months, memory chip stocks have gone from being solid beneficiaries of the AI boom to capturing a massively outsized piece of the return pie. The inflection in Micron’s performance de
Why the S&P 500 Shrugged Off the Iran War — and What Could Finally Break the Rally
On February 28th, the U.S. went to war with Iran, and the market was handed the kind of shock it hasn't contended with for years. The conflict set off a chain reaction across the region: an ongoing su
Nvidia, CoreWeave, and Nebius: Inside the Circular Financing of the GPU Boom
Neoclouds are one of the more hotly debated AI business models, with CoreWeave and Nebius being the two most widely recognized names. These companies have seen their sales, backlog, and share prices s
AMD, Nvidia, Arm, Intel: Inside the $120 Billion CPU Gold Rush
CPUs have gone from an afterthought to becoming the AI trade’s next great bottleneck – and with AMD, Nvidia, Arm and Intel circling a market that is doubling nearly overnight, the only question left i

Google TPU v8 vs Nvidia: How Inference Is Rewriting the AI Market
In April, Google announced it would begin selling its TPUs to select third-party data center operators, which is something the market has anticipated for nearly a decade. The TPU-versus-Nvidia-GPU deb

The AI Networking Stock That Beat Nvidia by 7X YTD for Returns of 135% YTD
AI networking stock Lumentum is among the key I/O Fund winners in 2026. We allocated heavily to LITE in January—a month before Nvidia backed the company. While most investors couldn’t stomach taking a

Bloom Energy — Our 2026 Top Pick Was the Best Performing Stock in April
April was the best month in six years for the Nasdaq-100. The single best-performing large-cap stock wasn't Nvidia, Microsoft, or Meta. It was Bloom Energy, up roughly 109% in one month. As you'll rec

Inside Nvidia’s $4B Optical Strategy—and Why CPO Changes Everything
Within the AI investment theme, there is nowhere that the supply chain shifts faster than in networking, leading companies to gain content on new platforms or lose incremental share. The reason is str
