Why the Next Two Weeks Could Determine the Rest of 2022
September 02, 2022

Knox Ridley
Portfolio Manager

For most of August, we have been providing free webinars in prior blog posts outlining an “imminent pullback.” You can access these here, and here. In this article, we will discuss key levels that must hold in order to maintain a long-term bullish bias. We also discuss why a direct drop to new lows may not play out, even if the bear market resumes. We then discuss the supporting markets that need to work in unison with equities before we can see a meaningful uptrend resume.
There is a popular saying on Wall Street - equity markets are discounting machines. In other words, equities are looking 6-9 months into the future to create prices today. Because of this fact, we regularly see market scenarios that sometimes do not make sense.
For example, in April/May of 2020, the high-frequency data was literally off the chart. We were seeing record unemployment, as well as PMIs falling off a cliff. This was coupled with companies in the service sector reporting losses that were nearly unprecedented. Yet, the market powered higher as this data continued to come in week after week. Ultimately, the market was right, as the US economy saw a relative recovery, and avoided the worst-case scenario.
We saw this phenomenon again last month. The June CPI number hit another 40-year high, beating consensus expectations. This was followed up by the Producer Price Index beating estimates to the upside, which implies rising inflation into the future. We then saw bank earnings come in mixed to bad, kicking off the feared earnings contractions brought on by over a year of real earnings seeing MoM declines due to wages unable to keep up with inflation. On the back of this bad news, the market failed to make a new low, and instead rallied nearly 700 points into late August.
When we see the market rally on bad news, what the discounting machine is telling us, is that all the bad news that is currently known, and can be modeled, is now priced in. We tend to see markets bottom in a place of despair, with most market participants certain we are going lower, while markets tend to top into euphoria, where most market participants are certain we are only going higher.
How to Model Investor Sentiment
The inability to model investor sentiment has been an ongoing issue with economic models for many years. It was one of the primary issues in 2008 when most models failed to see such a dramatic drop. Sidney Winter, Wharton School Professor, stated, “As computers have grown more powerful, academics have come to rely on mathematical models to figure how various economic forces will interact. But many of those models simply dispense with certain variables that stand in the way of clear conclusions. Commonly missing are hard-to-measure factors like human psychology and people’s expectations about the future.”
The only way to truly model investor sentiment is through technical analysis. Market patterns show up time and time again throughout history and across all assets being traded between humans. The art of properly interpreting these patterns can help investors get ahead of big moves.
The market pattern we are currently trying to interpret in real-time is a corrective pattern, which will unfold in 3 legs: A wave down, B wave up, C wave down. The question for the remainder of 2022 is simple – is the current 3 legs of the bear market that bottomed on June 16th the entirety of the correction, or is it just the 1st leg of a much larger correction?
We should know the answer to this question within the coming month. Assuming that the June low was the low, the current uptrend would be developing a new large-degree 5-wave pattern off the low.
As of now, we only have 4-waves. So, in order for this to be true, we need to see the market bottom soon, and then push back above the 4330 SPX level. This would give us a clean 5-wave pattern off the low, which would be wave 1 of the larger 5-wave uptrend developing. Here is a visual to show what this would look like.

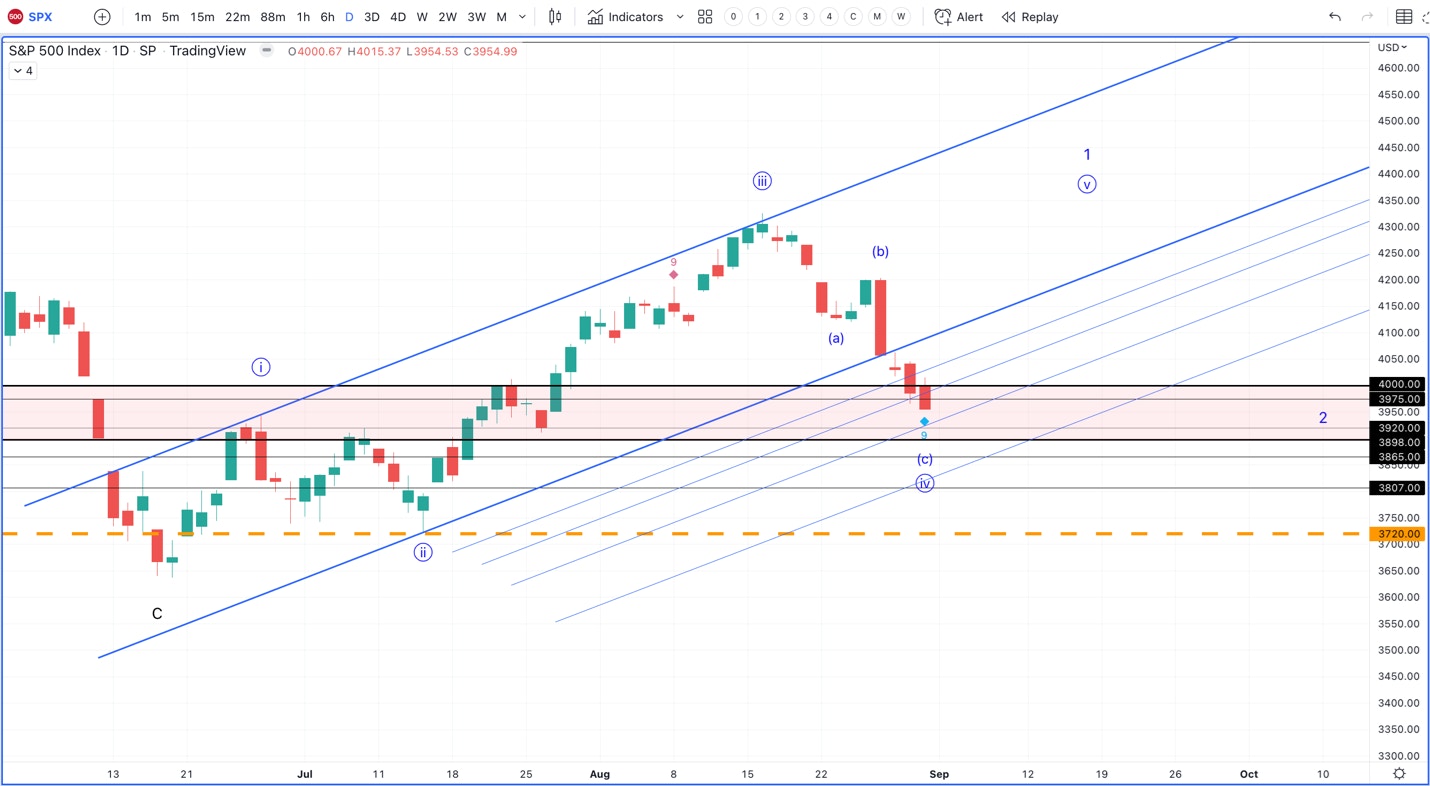
If we instead break below 3920-3900, then the odds favor a continuation of the bear market. However, I would not be expecting a straight drop, if this does happen. Assuming that we are currently in a large degree bear market bounce (B wave), there is one major clue that we do have to help us determine where this bear market will take us. The move from the ATH to the June low occurred in a rather straight-forward 3 wave fashion.

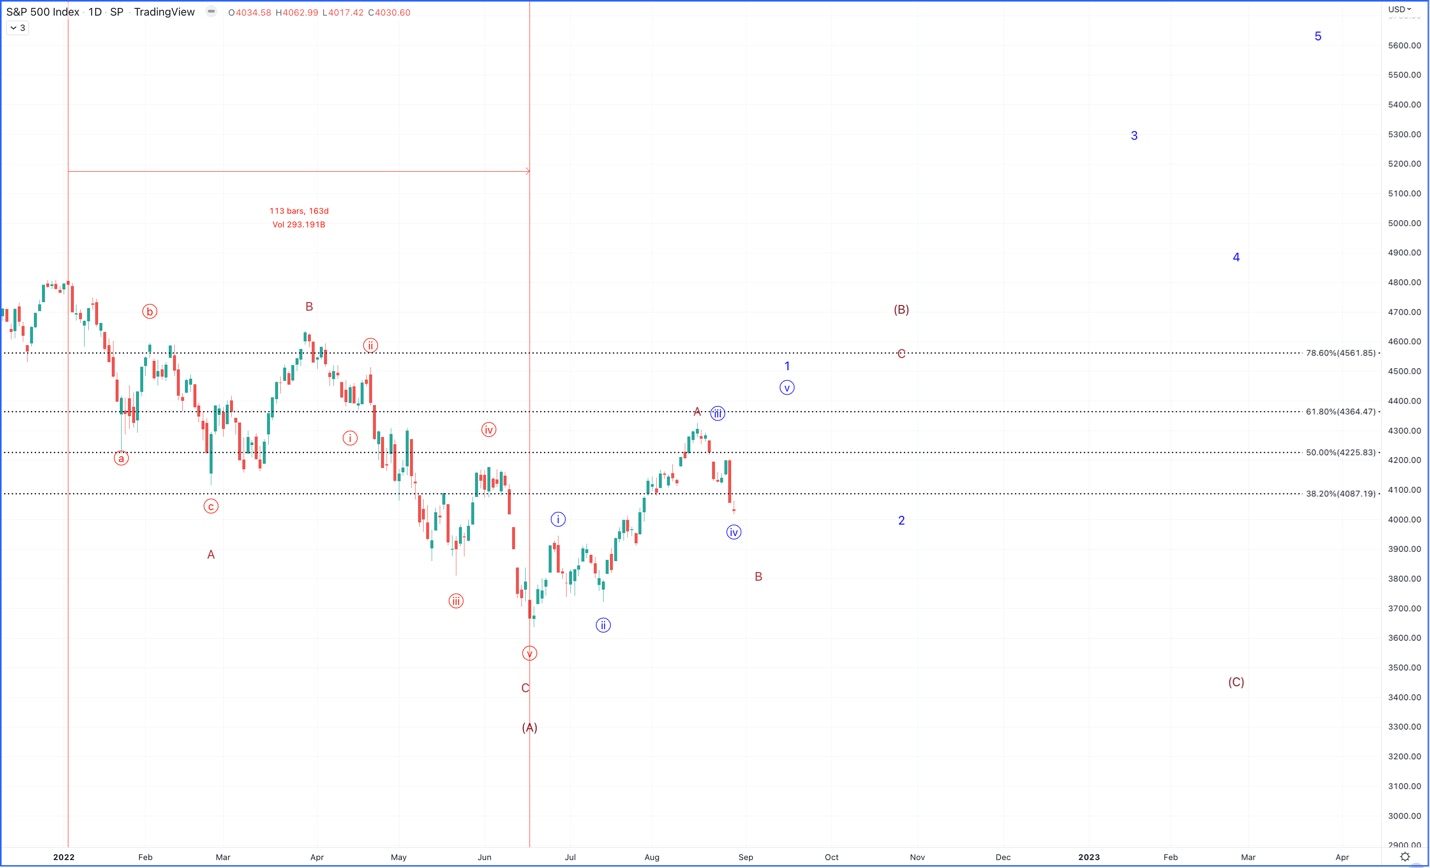
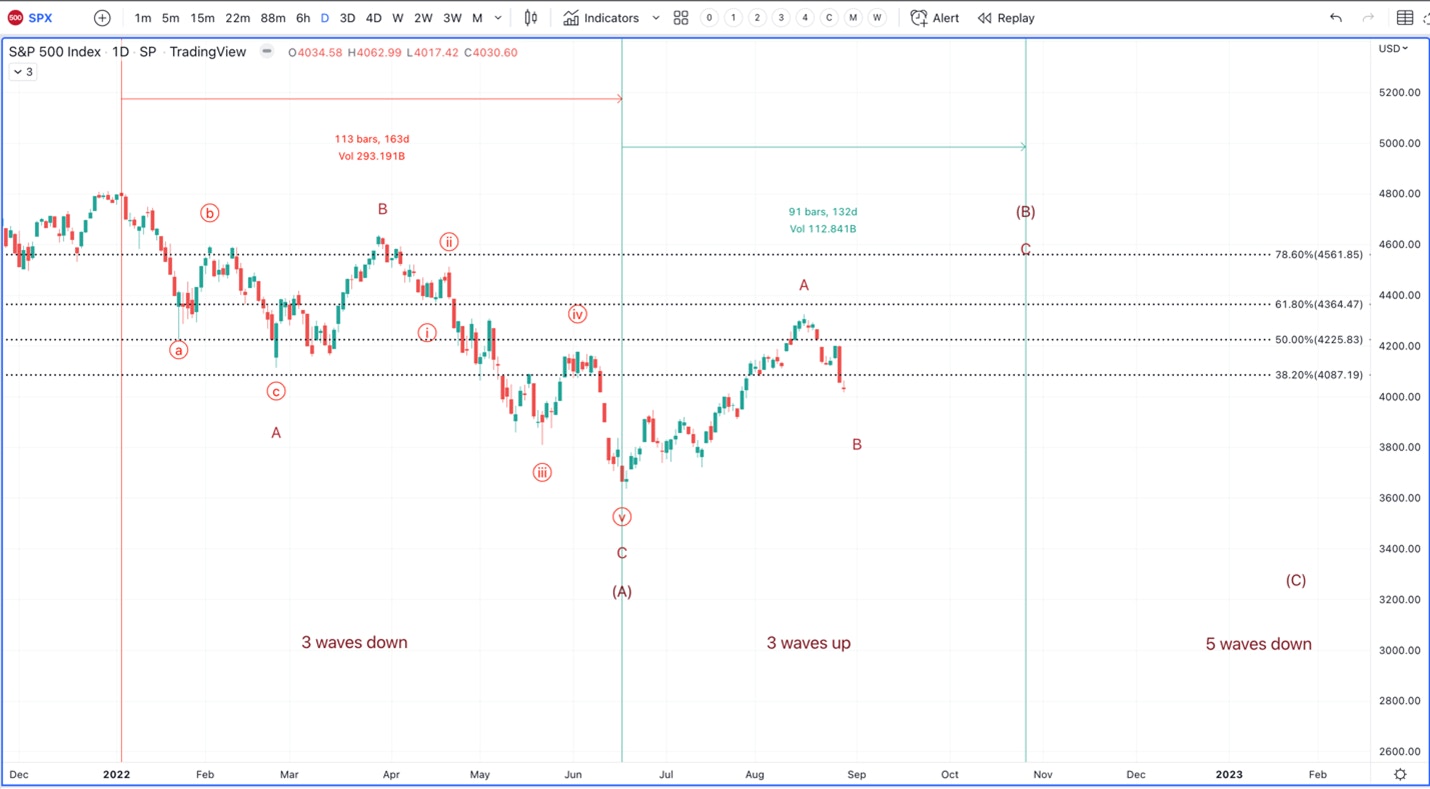
Note how the make-up of this larger 3 wave move was 3 down, 3 up, and then a 5 wave move into the June 16 low. If this is only the first leg of a larger bear market, it appears to be in the form of what is called a Flat corrective pattern. If this is true, then there are only 3 Flat Corrective Patterns to consider for an outcome.

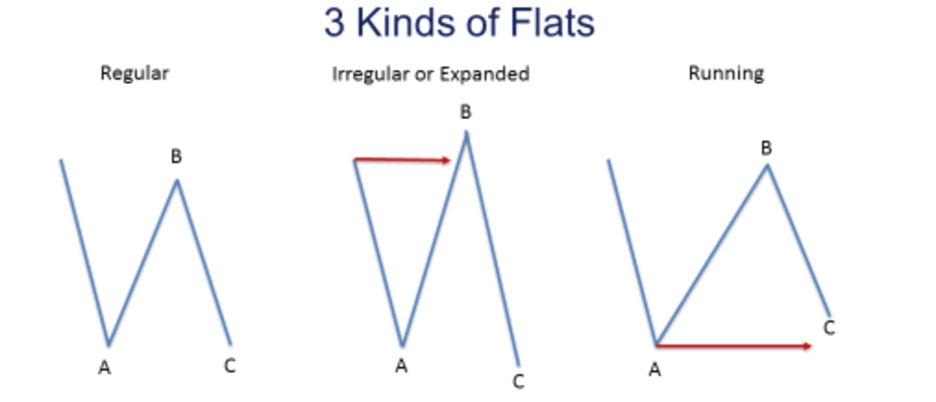
Note how in each Flat corrective pattern, the B wave (up) retraces a large portion of the A wave down. If we are in an Expanded Flat, the B wave makes a new high before the final leg drops to new lows. In my experience with Flat corrections, we tend to see the B wave retrace at least to the 61.8% retrace level of the entire A wave, and the B wave tends to be nearly as long as the A wave in time.
Sign up for I/O Fund's free newsletter with gains of up to 403% - Click here
As of today, we have come close to this target in price, yet we have fallen short in time. Playing the probabilities, it is highly irregular to see a Flat corrective pattern’s B wave be so brief relative the length of the A wave down. Anything is possible, which is why we plan to stick with the probabilities until critical supports break. If this is accurate, we are likely more than halfway through the bear market bounce. Once we bottom in the current selloff, as long as we hold the 3720 level, we should then see a 5 wave rally to a new local high into Fall.

Inter Market Analysis
Our economic grid analysis has moved into what we call the Big Risk-Off grid for the first time since 2020. This means that the rate of inflation is slowing along with the rate of economic growth.

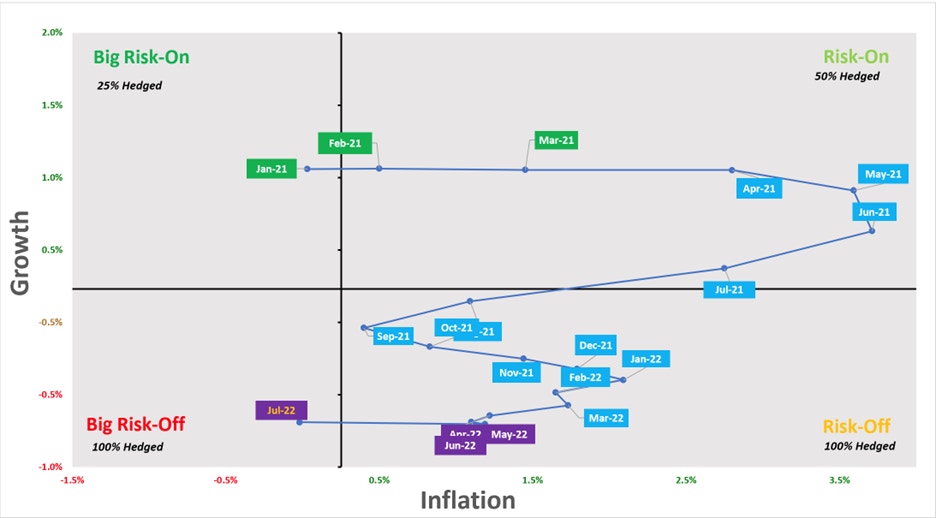
Historically, this grid tends to accompany the C wave down in a bear market. However, in 2022, the market exhibited a sell-now-and-ask-questions-later mentality, as we saw the S&P 500 decline by 24% and the NASDAQ-100 decline 34% over a 5.5 month period. These are rare moves, and one has to wonder if the worst is priced in – including the global slow-down in growth? I do believe it’s cavalier to assume that at this point, and prefer to let the broad market prove it to me over the coming month. We will remain cautious until then, and respect the Big Risk-Off grid that we are now in.
If we have, in fact, found a meaningful low, we would not only need to see the S&P 500 give us that 5th wave up, but we would also need to see rates, the USD and oil move down or sideways. Bull markets do not happen in vacuums and tend to be supported by various markets firing in unison. As of today, this confluence of inter-market dynamics is not supporting a direct uptrend in equities.
Bonds
We have talked for several months about how the bond market is not buying what the equity market was rallying on. If we did just to see peak inflation in the U.S., we would then expect the bond market to start trading on the global slow-down in economic data. This would cause a bid under bonds, as the bond market scrambles to lock in high yields as the economy moves towards a deflationary event. However, we are seeing the opposite.
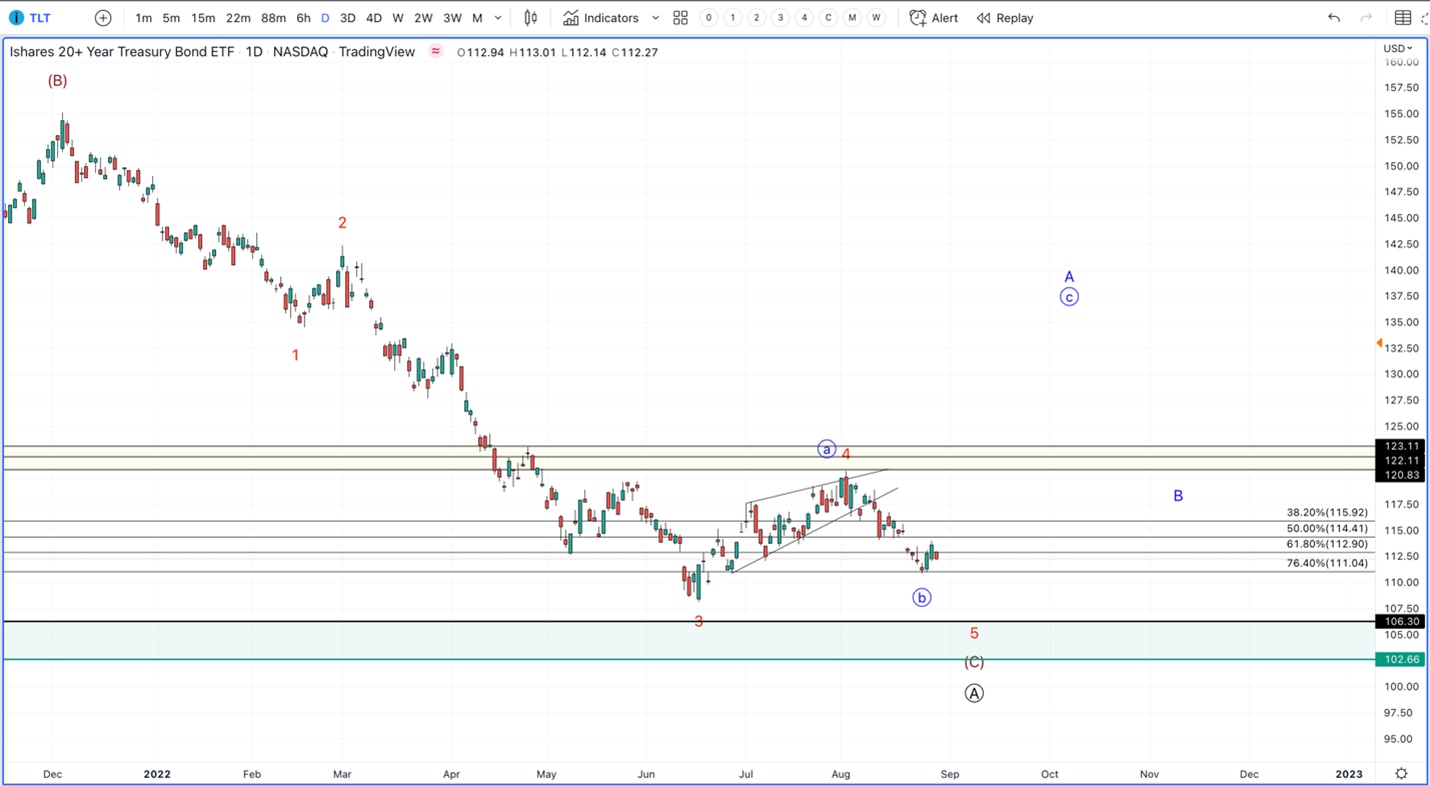
This suggests that the bond market is not yet convinced that inflation is behind us. Until TLT moves past $117.50, the odds remain that rates have not peaked, yet. If rates continue higher, expect volatility to follow, as companies must reprise their future cash flows/earnings due to rising borrowing costs.
The U.S. Dollar
The dollar (USD) has also been a catalyst for volatility in 2022. The USD has seen a sharp uptrend, drying-up international sales and thus affecting revenues. With peak inflation behind us, a FED pivot would likely start getting priced into the USD along with stocks.
Furthermore, The EU just posted the highest CPI and PPI readings sin e the inception of the Euro. Furthermore, Germany, who accounts for nearly 30% of the Eurozone economic output, just reported that consumer costs rose 8.8% vs. 8.5% a month prior. This is the largest increase since 1973, and far exceeds European wage growth of 3.8%. Therefore, the EU has accelerating inflation that far exceeds wages.
Sign up for I/O Fund's free newsletter with gains of up to 403% - Click here
The reason this matters is because the U.S. has potentially seen peak inflation, with data surprising to the downside.
The FED is far ahead of the ECB in terms of rate hikes, which means the EURO is likely to head higher, as the USD starts topping. As the FED reverses course to flight deflation, a loose dollar would be implied, causing a peak in the dollar. We are simply not seeing that yet. This implies that global fears are still present, as investor rush to the safety of the USD.

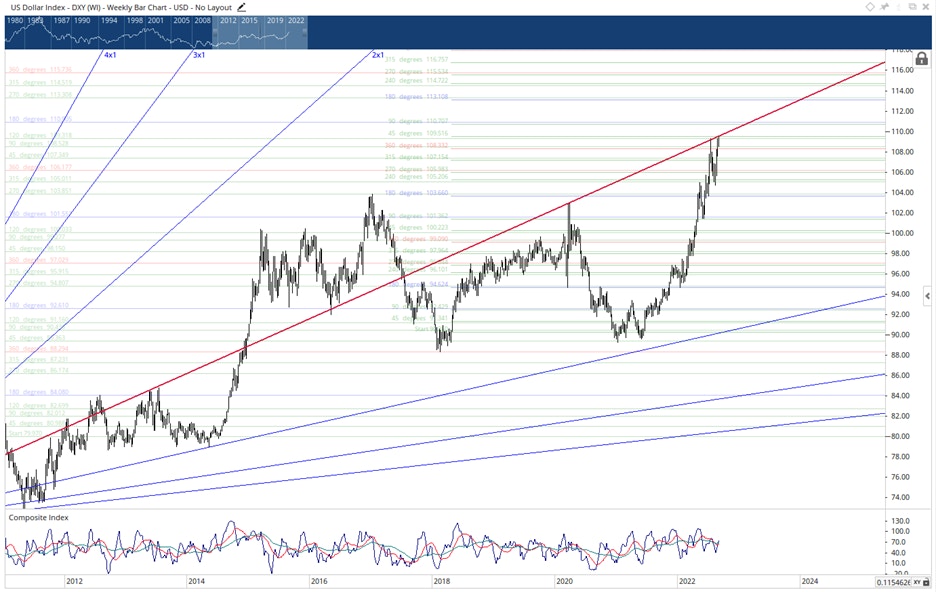
The Dollar Index, DXY, is hitting a confluence of big resistance on weakening momentum. If we see a strong break above the 45-degree line (1x1 in red) it could spell trouble for equities. As of now, it is holding the resistance, which we now need to see a follow-through to the downside to relieve pressure from equities.
Energy
The Oil market is also looking ready to push to new highs. The global economy is slowing down, making the need for energy less than it was a year ago. However, the crude oil charts look primed to make a new high.
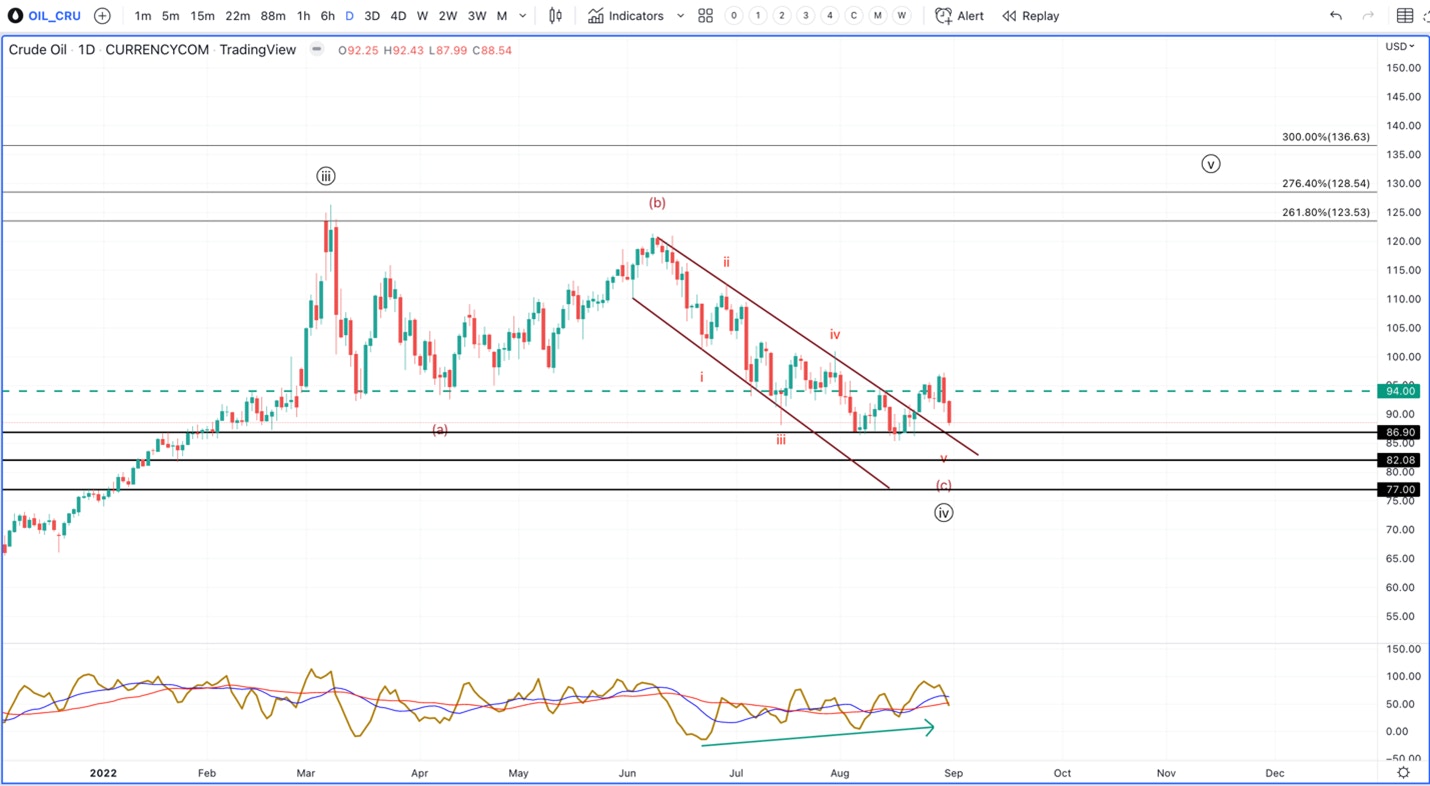
What would cause a push to new highs is yet to be known. However, in the face of slowing growth, it would likely be a catalyst the market is not pricing in yet. Many times, markets provide warnings that a new risk is on the horizon, and if we are to see a new leg lower, it would likely be a catalyst that is not known or being taken seriously.
Potential Catalysts
Next week, we will discuss the most concerning catalyst for the continuation of a bear market in our free newsletter. Here is a secondary catalyst we are tracking:
China/Taiwan:
Taiwan is an island off of the Chinese mainland that was governed independently from China since 1949. China views the island as a renegade province and has repeatedly threatened to force submission to Chinese law and political views. In 2016, the election of president Tsai Ing-wen, was a statement that the people wanted a further divide between Taiwan and China. Tsai instilled a movement of separatism and nationalism, which goes against the vision of the Peoples’ Republic of China, which continues to build today.
These tensions have continued to escalate into 2022 where they have reached a boiling point. We have seen numerous threats from China, coupled with Taiwanese leaks that seem to be preparing their citizens for war. Whether this will escalate or not is yet to be seen.
However, like Russia’s military drills in the region grew just before an invasion, China’s military drills continue to grow in the Taiwanese region as well. It also does not help that Russia and China have engaged in joint military drills recently, as the US announced that it has sent two warships to the Taiwan Straight.
If we do see an invasion, expect crude oil to move to new highs. This will put pressure on global oil markets, which will likely push inflation concerns higher, causing bonds to continue their decline as the USD is bought as a flight to safety.
Conclusion
The biggest tell will come from the US equity market over the next month. If we can get that 5th wave up, the US market is leaning towards the low being in, implying that the catalyst for a C wave lower is unlikely. On the other hand, if we break below 3975, the equity market is telling us that something is not right. The great discounting machine will be discounting something the rest of the market is simply not aware of until it is too late.
Please note: The I/O Fund conducts research and draws conclusions for the Fund’s positions. We then share that information with our readers. This is not a guarantee of a stock’s performance. Please consult your personal financial advisor before buying any stock in the companies mentioned in this analysis.


More To Explore
Newsletter

Token Growth is Surging - Here Are the Beneficiaries
The reality of AI demand growth has shattered early estimates for token processing, yet expectations continue moving up and to the right. In the second installment of our token processing series, we e

AI Token Demand is Shattering Forecasts
Total annual token processing is no longer measured in billions or trillions of tokens, but in the quadrillions and beyond. As annual token processing is now tracked in units with 15 trailing zeros, i

Nvidia and Google Are Crowding TSMC’s N3 Node - Can Intel Fill the Gap?
Nvidia is moving its next-generation Rubin GPUs from 4nm to 3nm, yet Google’s latest TPUs are already on N3 and are expected to remain there. Meanwhile, a growing number of AI CPUs from Nvidia, Amazon
Intel vs TSMC: How CoWoS Packaging Constraints Could Create an Opportunity for Intel Foundry
Taiwan Semiconductor (TSMC) is the single, most important company to the AI industry. However, to compete with the incumbent, Intel does not need to beat TSMC at leading-edge manufacturing. It only ne
Big Tech’s Free Cash Flow is Turning Negative – Who's Next?
Big Tech’s AI revenue is accelerating, but free cash flow is moving sharply in the opposite direction. Across Google, Microsoft, Meta and Amazon, capex is rising much faster than operating cash flow a
Big Tech Earnings Preview: Is AI Monetization Finally Catching Up to Capex?
The most pronounced difference between 2026’s tech rally compared to rallies in the past is which companies have been left out of it. The names most associated with the AI trade have hardly participat

Nvidia, CXL, and the Battle to Improve AI Inference Economics
This is Part 2 of our two-part series on AI inference economics. In Part 1 — Why Nvidia's Next AI Battle Is About Tokens per Watt, we laid out why tokens per watt has become the defining metric for in

Why Nvidia’s Next AI Battle Is About Tokens per Watt
As hyperscalers move from building AI infrastructure to monetizing it, tokens per watt helps to reflect if revenue is scaling and if profitability is improving. Offload engines can increase tokens per

Micron Is Up 900%. Here’s Why the AI Memory Trade May Still Have Room to Run
Over the past 10 months, memory chip stocks have gone from being solid beneficiaries of the AI boom to capturing a massively outsized piece of the return pie. The inflection in Micron’s performance de

Why the S&P 500 Shrugged Off the Iran War — and What Could Finally Break the Rally
On February 28th, the U.S. went to war with Iran, and the market was handed the kind of shock it hasn't contended with for years. The conflict set off a chain reaction across the region: an ongoing su
