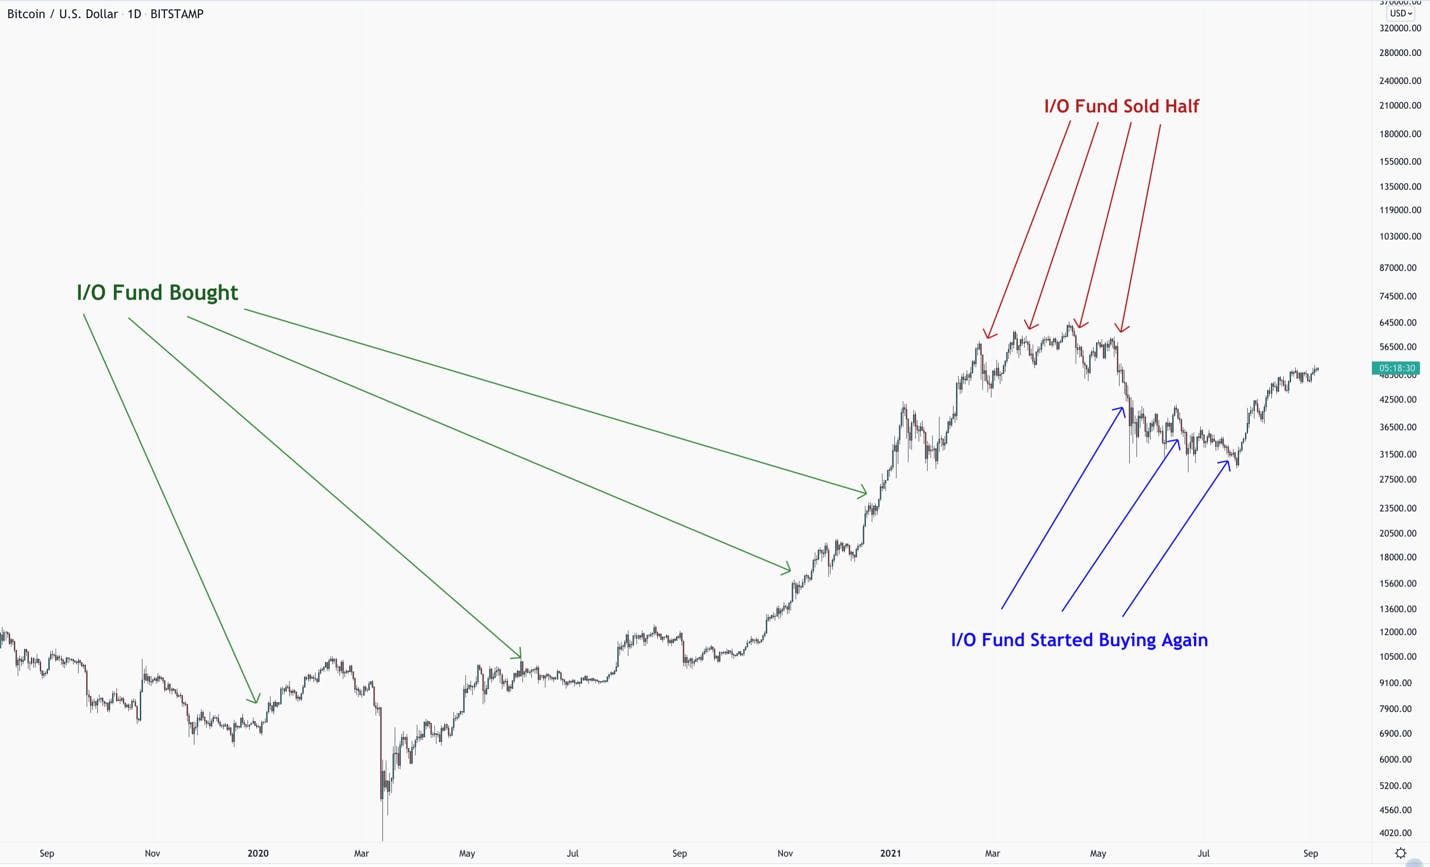

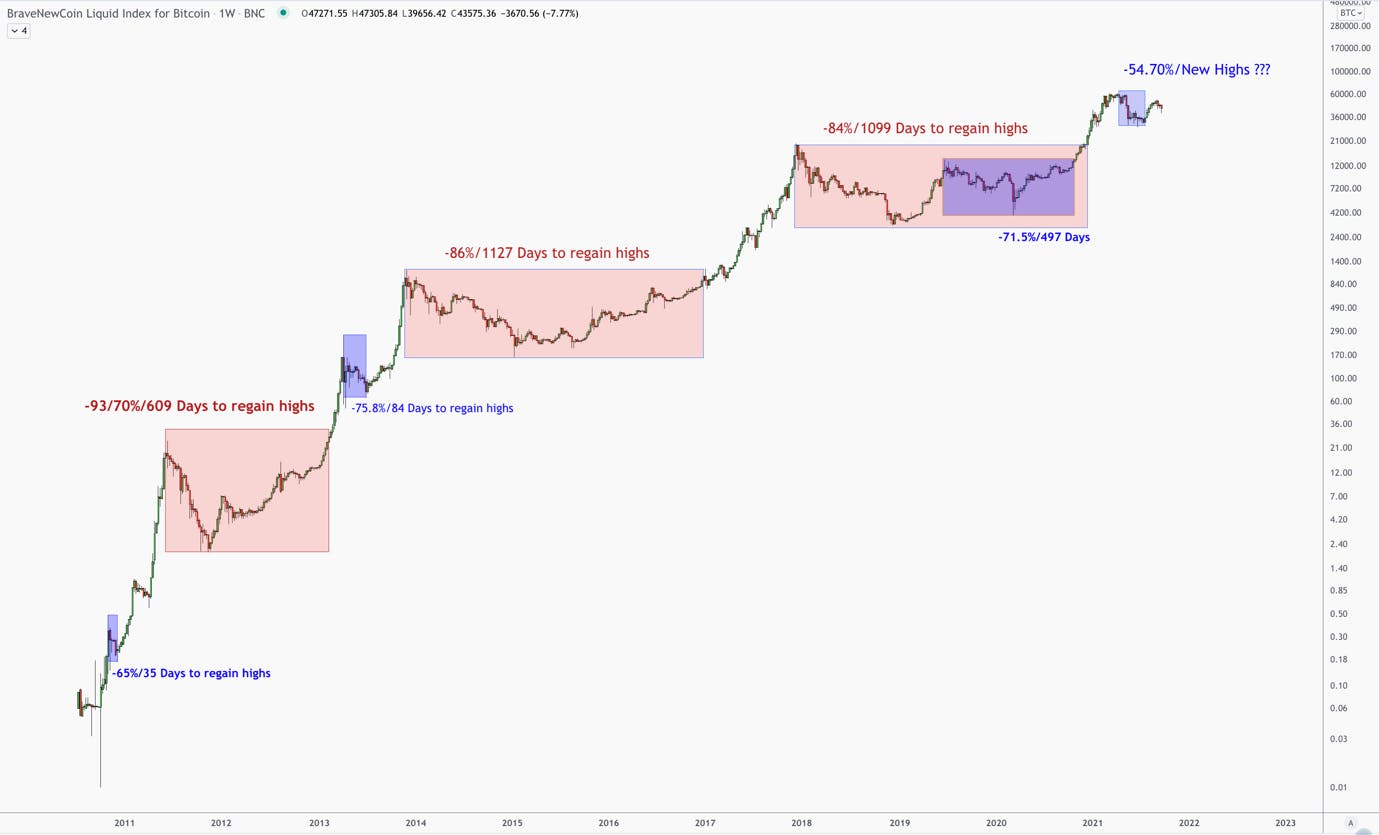
Despite Bitcoin’s recent decline, volatility is actually decreasing and the asset is beginning to stabilize in terms of historical performance. The last crypto peak to trough in 2019 saw a decline of 84% in price while this sell-off’s peak to trough was 55%It took three years to recover the all-time high from 2017 for Bitcoin yet the I/O Fund thinks Bitcoin will recover its current all-time high quicker this time as the long-term pressure for Bitcoin is up.
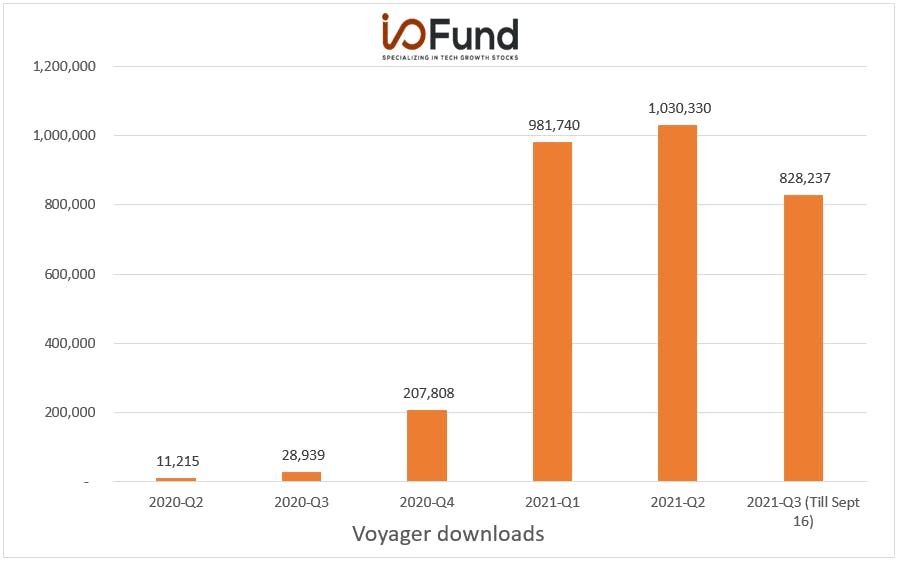
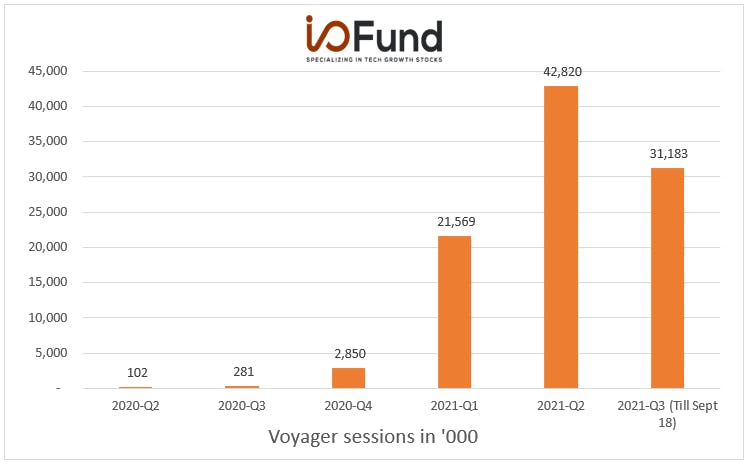
Naturally, with the steep drawdown of 55% (yet the very promising future of crypto - see our price targets below) we were wondering how crypto trading apps are faring after the Q2 sell-off now that Coinbase and Robinhood have gone public, two of the biggest names in the space. Below, we highlight data that is offered by Apptopia (and is also available on the Bloomberg Terminal) to show that in some cases crypto trading apps are down sequentially while others are down even year-over-year. Robinhood is stock trading app too, of course, yet we think any Q3 declines will be largely contributed to crypto trading. We also discuss Voyager, a company we have done a deep dive on before and currently hold a position in.
Two Popular Crypto Trading Apps Went Public in Q2
The I/O Fund figured it would be a good idea to check on the health of crypto trading apps to see how the asset class underperformance may have affected crypto trading apps. When Bitcoin and crypto go through a rally there will be a correlation with the crypto trading apps, yet how much of a fall-off do crypto apps see when there is a sell-off?
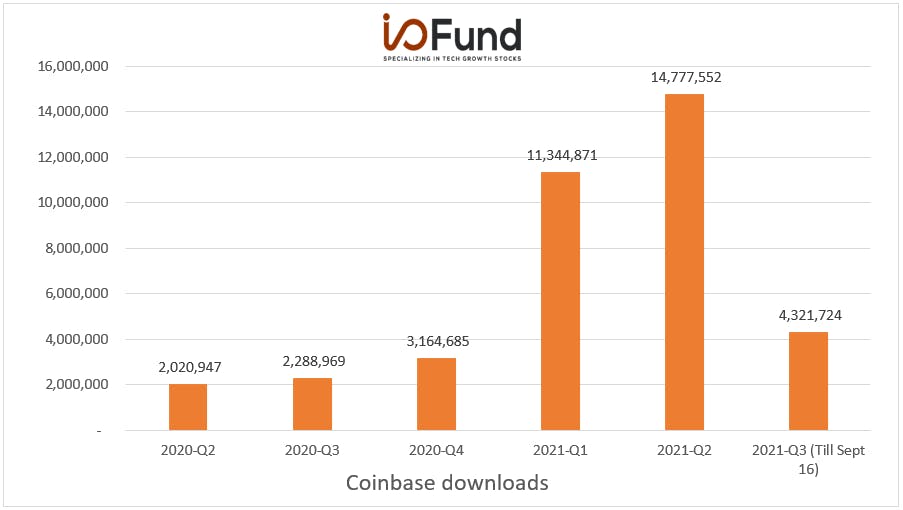
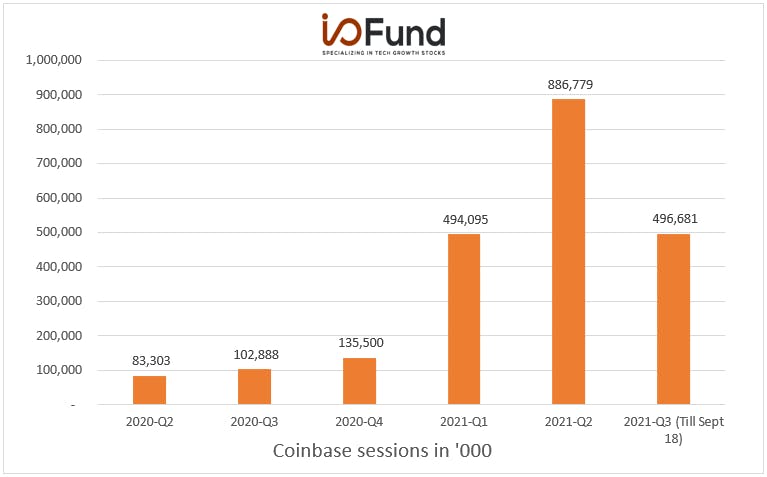
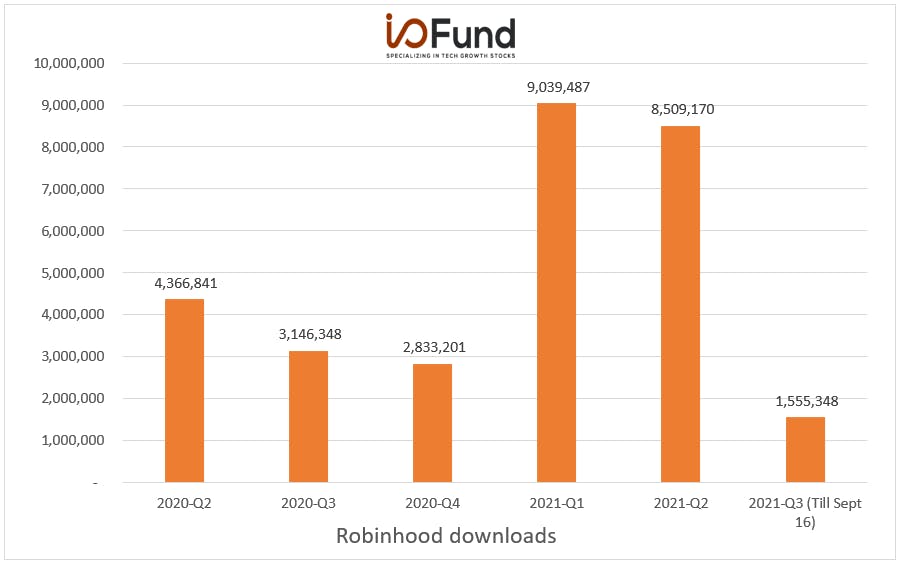
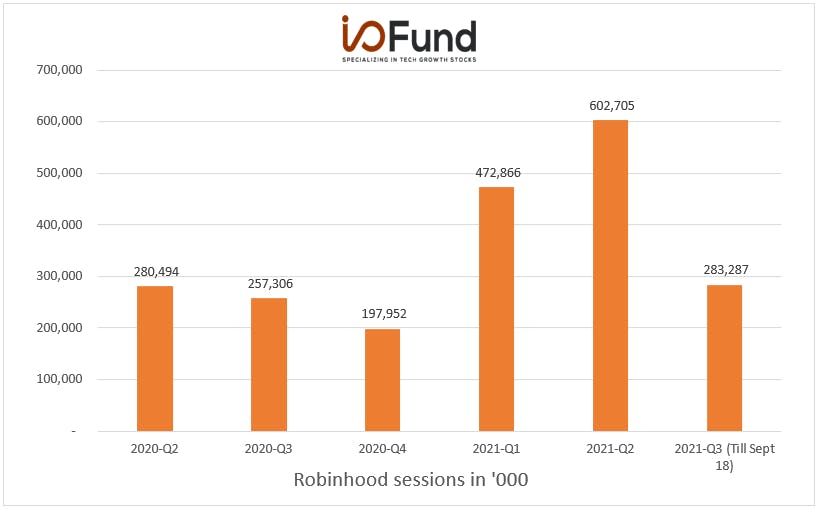
Coinbase and Robinhood seized the crypto rally to go public as the companies posted 1080% growth and over 309%+ revenue growth, respectively in the March quarter. You’ll see below in the downloads and sessions that there was unusually high activity during the period the two companies went public.
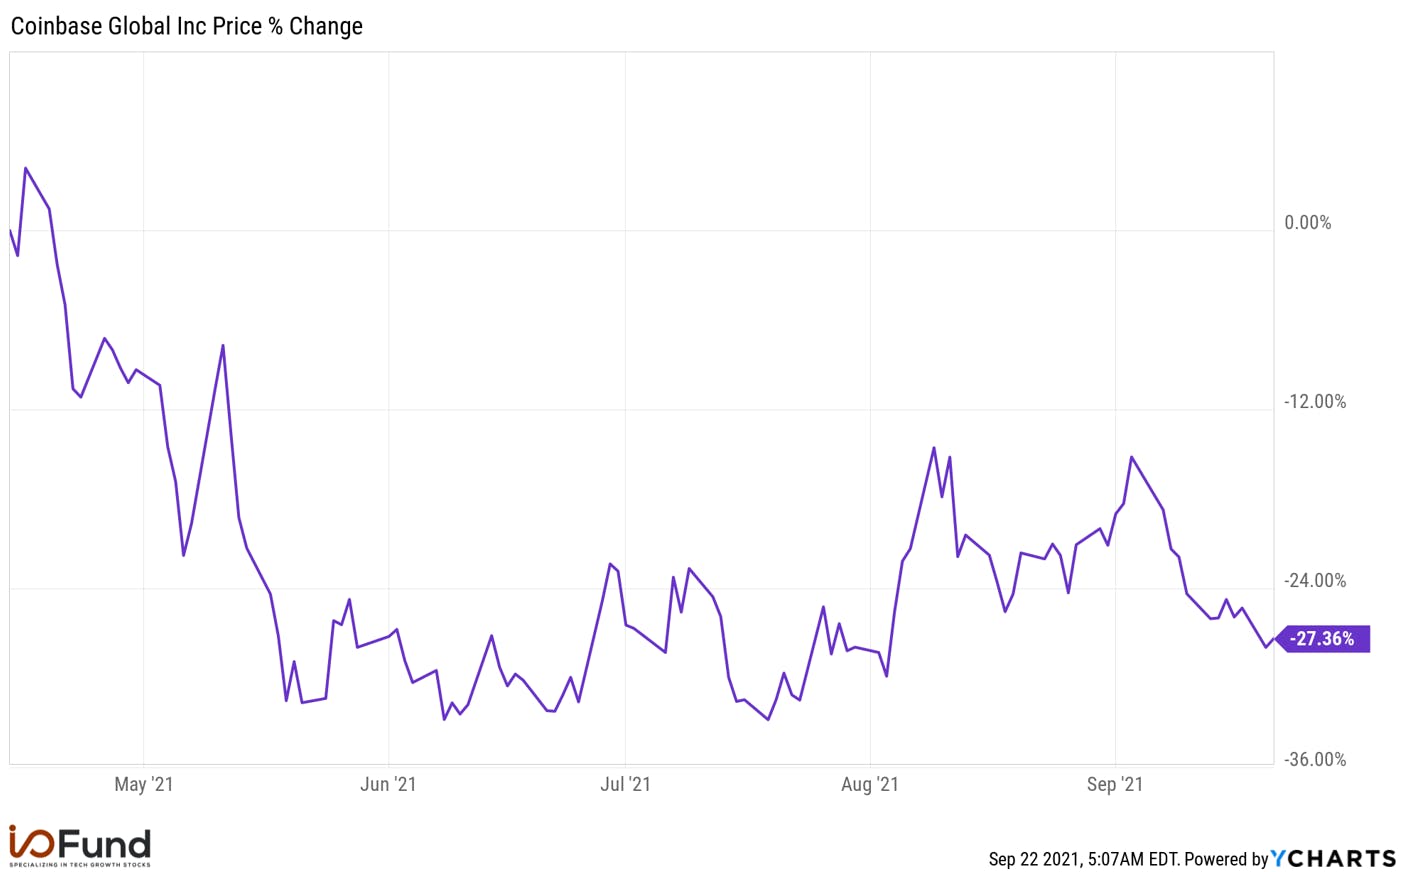
Coinbase was listed on April 14th at $381. The shares were off to a good start on the day of direct listing, but the shares sold drastically a month later. Lock-up periods are standard for Initial Public Offerings (IPOs). However, Direct Listings usually don’t have lock-up periods. There could be exceptions like Palantir, which despite the direct listing, had lock-up restrictions. Coinbase, which did a direct listing, did not have lock-up agreements. This is important because shares can come under pressure following a soft quarter.
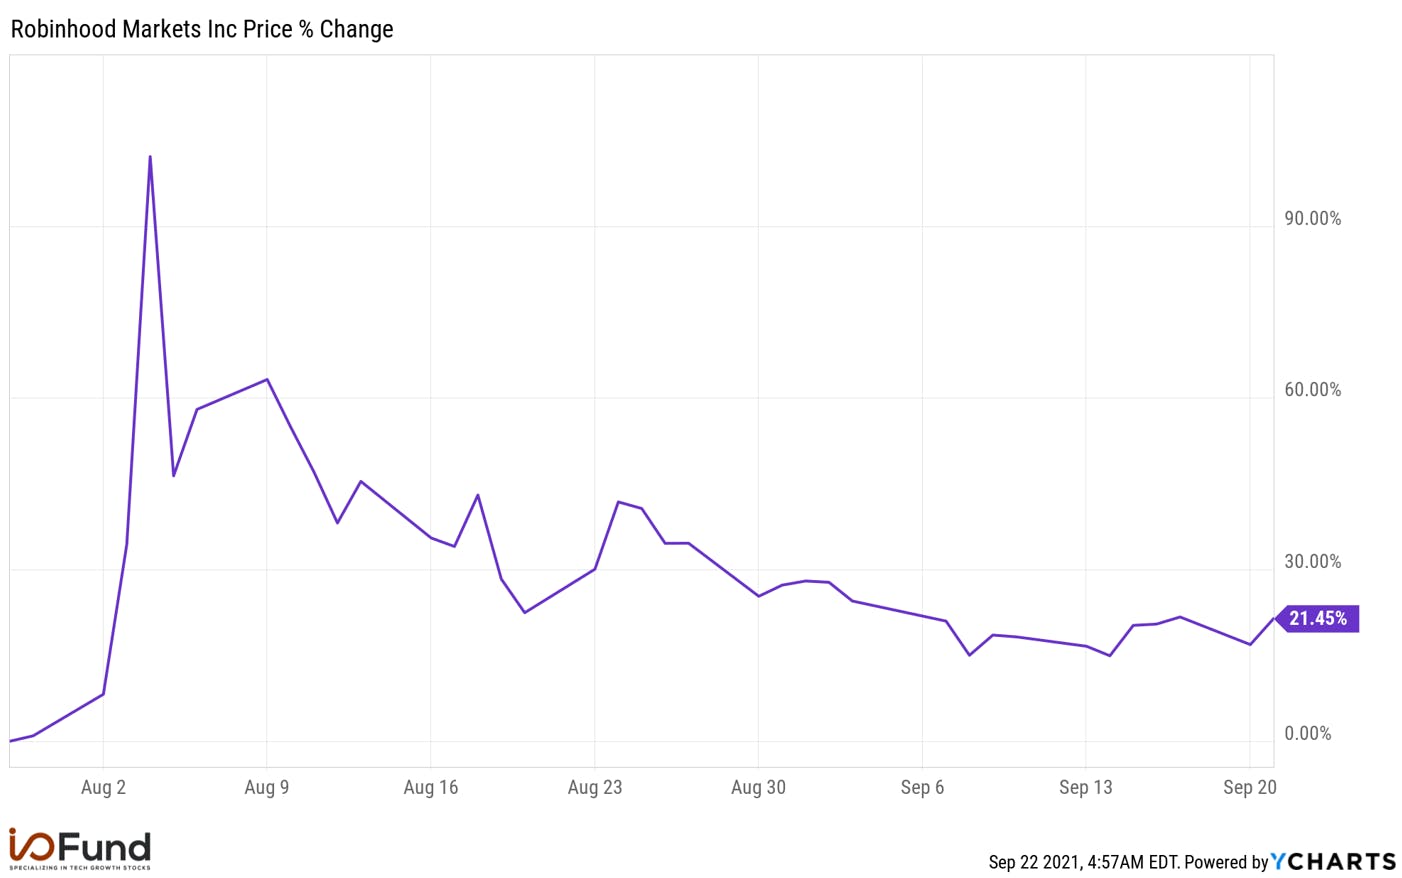
Robinhood shares were listed on July 29th at $38, which was at the lower end of the offering range. The shares peaked at $70.39 and are currently trading above the IPO price at $47.15. Many IPOs have 180 day lock-up periods yet Robinhood has a partial lockup schedule. In Robinhood’s case, 15% of the employees were able to sell their shares on the day of the company’s listing. The next 15% of the shares will be eligible for sale on October 27, 2021. There is mention of a final lockup expiring on December 1st in the amended S-1 filing here. There will likely be volatility during this period as insiders tend to sell after lockups expire. A soft quarter or two could exacerbate this. Doge Coin also peaked around $0.60 and is now trading around $0.20. Per Robinhood’s financials, this coin drives 62% of Robinhood’s crypto trading activity.
Quick Glance at Q2 Financials for Crypto Trading Apps:
Before we look at the current downloads and sessions for Q3, we want to review the Q2 financials for Coinbase, Robinhood and Voyager Digital.
Coinbase reported $1.3 billion in revenue in 2020 compared to $533.7 million in 2019 for growth of 143.6%. Revenue growth in Q2 was impressive at $2.2 billion compared to $186.4 million for 1080% growth. A similar trend was seen in H1 2020 compared to H1 2021 for 936% growth. Net income grew in line with the top line at net income of $1.6 billion and adjusted EBITDA of $1.15 billion compared to a net income of $32.3 million and adjusted EBITDA of $61 million for the same period last year.
Retail Monthly transacting users (MTUs) rose to 8.8 million in the recent quarter when compared to 2.8 million at the end of December 2020 and 1.5 million for the 2Q 2020. Verified users were 68 million. Absent a rally in Bitcoin and crypto, these will be tough comps to clear in future quarters this year. The data from July showed that retail MTUs came at 6.3 million. The management expects MTUs and total trading volume to be lower in the third quarter when compared to the second quarter with the company stating, “as volatility and crypto asset prices are highly correlated with trading revenue, the crypto market environment heavily influenced our Q2 financial results” citing declines of 45% in Bitcoin and Ethereum.
Coinbase emphasized they have 9,000+ institutional customers and 160,000 ecosystem partners. Trading volume is primarily driven by institutions at $317 billion compared to $145 billion from retail (about two-thirds) with trading volume at 24% for Bitcoin, 26% Ethereum and 50% other crypto assets. In terms of assets on the platform, the mix is more equal at $88 billion for retail and $92 billion for institutions with 47$ Bitcoin, 24% Ethereum and 25% other crypto assets.
The company derives its major revenues from the transaction revenue. This is correlated with the trading volume. The company plans to reduce the focus on the transaction revenue since it’s volatile and focus on the subscription & services revenue in the long run. The subscription & services revenue include custodial fees, blockchain rewards which includes staking revenue, earn campaign revenue, interest income and other subscription & services revenue. The third classification of revenue is other revenue which includes crypto asset sales revenue and corporate interest income.
Robinhood grew Q2 revenue by 131% YoY to $565.3 million. Revenue growth has been strong yet may have peaked in Q1 as growth has been slowing down. For the full year 2020 it rose by 245% to $959 million and in the 1Q 2021, it was up 309% to $522 million. Transaction-based revenue grew by 141% to $451.2 million, net interest revenue grew by 69% to $67.7 million, and other revenue grew by 177% to $46.5 million. Looking deeper into the transaction-based revenue, options revenue grew by 48% to $165 million while cryptocurrencies revenue increased to $233 million from $5 million in the same period last year. The equities transaction-based revenue dropped 26% to $52 million.
As stated above, Dogecoin accounted for 62% of crypto trading in Q2, which was up compared to 34% in the first quarter. Due to the price decline in this asset, it’s unlikely Q3 will comp well with Q2 partly due to this alt-coin.
Operating expenses increased 169% to $500.7 million. Notably, technology and development expenses increased 248% to $156.3 million and operations expenses rose 232% to $101.1 million. Due to the strong trading activity, the company procured additional cloud infrastructure, which increased technology expenses. Operations expenses were high due to the increase in the headcount of customer support staff.
The company also recorded stock-based compensation in the current quarter and expects to record a charge of $1 billion in stock-based compensation for RSUs related to the IPO in the third quarter. It reported a net loss of $502 million in the recent quarter and adjusted EBITDA of $90 million. In contrast, the company reported a net income of $58 million and adjusted EBITDA of $63 million in the same period last year.
According to the management, due to the seasonal nature of the business, trading activity has been generally strong in the first half of the year. On similar lines, they expect lower trading activity in the third quarter. The sessions and downloads confirm that Q3 will be much softer than Q2. At the end of June 2021, the company had about 22.5 million net cumulative funded accounts compared to 18 million at the end of March 2021 and 12.5 million at the end of December 2020. The customer growth has been strong due to the strong word-of-mouth referrals yet appears to have declined for Q3 (see below).
The company earns the majority of its revenues from payment for order flow (PFOF). This is a method in which the brokerages like Robinhood receive compensation for routing orders to market makers. The transaction-based fees represent 81% of the total revenues of the 1Q 2021 and 80% of the 2Q 2021. Notably, there are conversations going on in Congress about the risks and SEC might consider banning or putting restrictions on payment for order flow.
Similar to its peers, Voyager Digital demonstrated strong revenue growth in the first half of the year. The earnings release for May shows Q3 FY 2021 revenue came in at $60.4 million, up from $3.6 million in the previous quarter fiscal Q2, representing 21,000%+ growth (yes, you read that right). Fee revenue was $53.7 million and interest revenue from custodians was $6.7 million. Operating profit was $30 million for the 3Q FY 2021. There was a press release in July that showed revenue for fiscal Q4 ending in June in the range of $103 million to $107 million, up from less than $1 million in revenue in the year-ago quarter. Sequentially, this represented over 65% growth. Total funded accounts have exceeded 665,000, and total verified users are more than 1.75 million. You can read our full analysis here.