Market Cycles, Not Headlines: What History Says About the 2025 Rally and What Comes Next
November 06, 2025

Knox Ridley
Portfolio Manager

Despite how it may seem, modern-day narratives rarely drive market swings. Tariffs, political headlines, niche trends like rare earth materials, or speculation about which company OpenAI partners with next — these stories dominate the news cycle, but they do not reliably move markets, as the consensus believes. If they did, investing would be much easier.
Numerous well-known studies have come to this conclusion. One of the most famous is “What Moves Stock Prices?” by Harvard and MIT economists Cutler, Poterba, and Summers. Their goal was to model how news and macroeconomic events might predict stock market movements. To their surprise, they found that only about one-third of major price swings could be linked to identifiable news events.
This finding was later reinforced by Yale economist Ray Fair in his groundbreaking paper, “Events That Shook the Market.” Fair examined major one-day movements in the S&P 500 from 1950 to 1999 in search of their causes. He concluded that neither news, earnings, nor data releases could explain most of these large jumps. As Fair put it, “It is difficult to find any news that corresponds to many of the largest daily changes in stock prices.”
We’ve seen this phenomenon play out in real time. The COVID crash was perhaps the most striking example. Economic data went off the charts: 26 million Americans filed for unemployment within five weeks, as GDP fell 31.4% annualized — the steepest drop since World War II. Yet the stock market bottomed at the height of this deterioration and uncertainty, staging a V-shaped recovery that was impossible to justify by the data alone.
There are many forces that shape markets — liquidity, growth, and monetary and fiscal policy among them. But there are also powerful, less tangible forces that economics struggle to explain. One of these is herd sentiment, which we explored in last week’s report, Decoding the S&P 500: When Human Sentiment Meets Artificial Intelligence.
This week, we’ll turn to another underappreciated but potent influence on markets - cycles. Much like natural phenomena, financial markets move in rhythmic, repetitive patterns that can be observed, analyzed, and applied to better understand broader trends.
Understanding market cycles is essential for anyone seeking to interpret market behavior beyond the noise of daily headlines. While news and data provide short-term context, the deeper rhythm of expansion, contraction, and renewal has repeated throughout centuries of market history. These cycles reflect the underlying forces of liquidity, sentiment, credit, and innovation that collectively drive long-term trends. By studying them, investors can gain perspective — identifying where we may be in the broader sequence of optimism and fear — and making decisions grounded in historical precedent rather than emotion.
In this report, we will look at two dominant cycles that closely align with the price action in 2025. Both suggest a potential year-end rally, followed by the potential for volatility into Q1 of 2026. We’ll then line these cycles up with the broad market to outline what levels must hold, and what targets this uptrend is hitting, as we push higher.
The Gann Cycle Framework: Predictable Rhythms Behind Market Movements
The concept of market cycles gained mainstream attention through Neil Howe and William Strauss’s theory The Fourth Turning, which proposes that history unfolds in recurring 80–100-year cycles based on generational shifts. Each “turning” reflects a distinct societal mood—ranging from confidence and expansion to crisis and renewal—that repeatedly shapes political, economic, and market behavior.
However, the study of cycles long predates Howe and Strauss. In 1862, economist Karl Juglar identified what became known as the Juglar Cycle—an 8 to 11-year rhythm of expansion and contraction that still appears in modern market data. Juglar’s work established the foundation for viewing markets not as random systems, but as recurring patterns driven by predictable phases of human and economic behavior.
Decades later, W.D. Gann advanced this concept into one of the most comprehensive frameworks for understanding market structure. Gann demonstrated through decades of analysis that market movements often unfold in rhythmic, repeating patterns tied to both human psychology and natural law. His research suggested that the same behavioral and structural forces that shaped past bull and bear markets continue to influence markets today.
Gann identified several “master cycles”—notably the 100-year, 90-year, 60-year, 52-year, 45-year, and 30-year cycles. At any given time, one or more of these cycles, as well as divisions of these cycles, tend to influence the prevailing market trend. He used these relationships to issue remarkably accurate forecasts, many of which have held up over time.
While this may sound abstract, it holds historical merit. For example, 90 years back from the 1929 market top takes us to the end of the 1839 speculative boom, which ended in the Panic of 1839. Counting 90 years forward from 1929 brings us within months of the COVID top in 2020—an equally significant inflection point.
Another example is Gann’s 60-year “Great Cycle.” When we overlay the S&P 500 from 1962 onto today’s market starting in January 2022, the patterns align with remarkable similarity. While cycles can invert or distort temporarily, they consistently identify key inflection points and general directional bias.

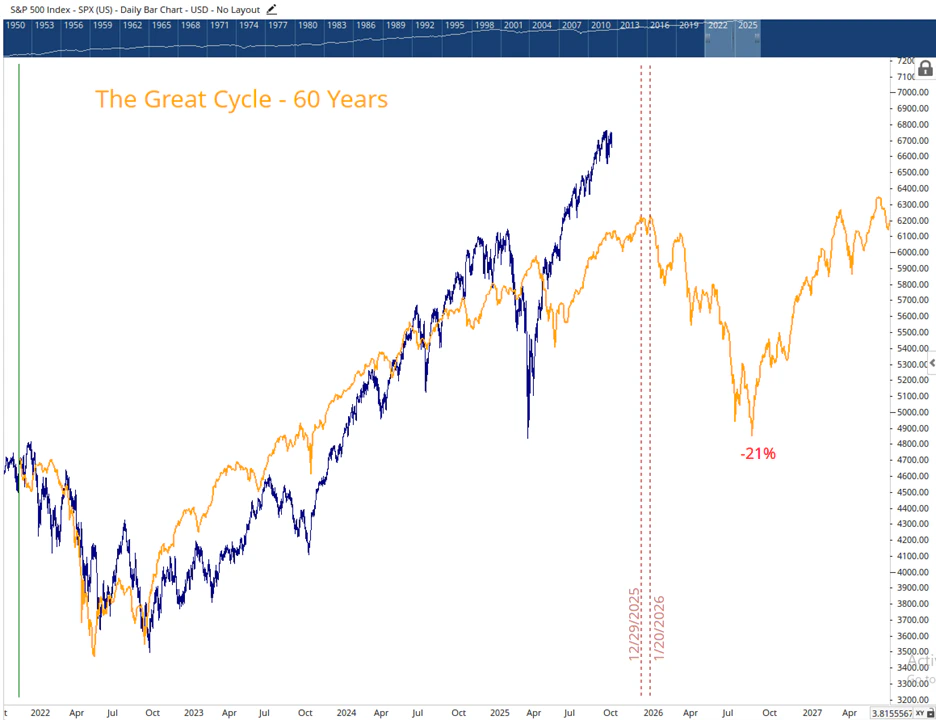
How the S&P 500 (2022–2025) Aligns with the 60-Year Historical Market Cycle
Chart by I/O Fund
Because sentiment moves in waves, the emotional extremes of fear and greed remain timeless. While technology, policy, and liquidity conditions evolve, the human response to opportunity and risk does not. Even if equities rise in 2025 on optimism surrounding AI, investor psychology mirrors that of prior generations—driven by the same patterns of exuberance and denial.
To see how these long-term cycles manifest in real markets, let’s look at two historical periods that mirror 2025 with uncanny precision.
With this in mind, we examined historical precedents for 2025—a year defined by a rapid 20% decline in Q1 that erased nearly all of 2024’s gains, followed by a strong seven-month rally with limited pullbacks. These conditions—a liquidity shock followed by a sharp rebound—are rare. Over two centuries of data, only two market periods fit this mold: 1980 and 1998. Interestingly, both align with significant Gann cycles—the 45-year (half of the 90-year) and the 26-year (half of the 52-year) cycles.
To summarize: History may not repeat — but it often rhymes.
The 45-Year Market Cycle: How 1980’s Policy Shock Is Repeating in 2025
The market in 1980 has a striking resemblance to what we’ve seen unfold in 2025. In both periods, a swift and unexpected policy shock triggered a sudden liquidity event that sent markets sharply lower, followed by a rapid V-shaped recovery that defied expectations.
In early 1980, the Federal Reserve—newly under the leadership of Paul Volcker—launched an aggressive campaign to control inflation. The Fed pushed interest rates to nearly 17% in February, an unprecedented move that instantly drained liquidity from the system and sent equity markets into a sharp correction.
prompt
Similarly, in early 2025, the executive branch imposed an unexpected increase in tariffs, creating a sudden liquidity squeeze that rippled across U.S. markets. The February decline that followed erased much of the prior year’s gains in a matter of weeks.
In both years, the shock proved temporary. Political pressure and a seizing credit market forced Volcker to reverse course in 1980, cutting rates back to roughly 9 percent. The result was an eight-month recovery that lasted through late November. Likewise, in 2025, just days after Liberation Day, the bond market began a disorderly unwind that pushed yields higher than the government could sustain. The policy reversal that followed restored liquidity and fueled a seven-month rally that continues today.
If this historical rhythm continues to guide market behavior, the current advance could extend through December, leading to a secondary high in mid-January followed by a period of elevated volatility into the second quarter of 2026.


How the S&P 500 in 2025 aligns with the 45-year cycle
Chart by I/O Fund
The 26-Year Market Cycle: How 1998’s Global Crisis Echoes Through 2025’s Rally
When we align the 26-year cycle with the 2025 decline, the parallels are difficult to ignore. The 1998 correction was sparked by a sudden global liquidity crisis that rippled through international markets. It began with the Asian Financial Crisis, as currencies in Thailand, Indonesia, and South Korea collapsed under the pressure of capital flight. The shock then spread to Russia, which defaulted on its domestic debt, setting off a global contagion.
One of the largest casualties was Long-Term Capital Management, a highly leveraged hedge fund managed by Nobel laureates and veteran Wall Street traders. As LTCM’s positions unraveled, liquidity evaporated across credit markets. Within two months, U.S. equities had dropped roughly 20 percent, forcing the Federal Reserve to intervene and backstop the system.
The Fed’s swift action reignited risk appetite, setting off one of the most powerful rallies in modern market history. Fueled by speculation about the transformative potential of the internet, investors poured into technology and growth stocks, propelling the market into the final and most euphoric phase of the dot-com boom.
While today’s AI leaders—such as Nvidia—are built on far stronger fundamentals than the speculative favorites of 2000, like Cisco and Pets.com, the behavioral pattern is strikingly similar. Both eras were defined by optimism surrounding an emerging technology with vast, untested potential and by investors’ willingness to price in future revolutions before they materialized.
If this 26-year cycle continues to guide the market, the current uptrend could extend through December and into the first quarter of 2026 before encountering the first meaningful correction. Unlike the 45-year cycle, however, this correction would likely be brief—more of a consolidation within a broader advance that carries into late 2026.


How the S&P 500 aligns with the 26-year cycles (1998)
Chart by I/O Fund
Interestingly, both cycles suggest continued strength into December, and both cycles suggest some period of volatility in Q1 of 2026. What separates the two is how far this uptrend pushes into Q1. While the 45-year cycle suggests a top in mid-December and lower high into mid-January, the 26-year cycle suggests a continuation of the aggressive uptrend into mid-Q1 of next year before seeing a small period of volatility.
Broad Market Levels
If we take the general direction of the above cycles and place it within the context of developing price patterns, there are two counts that best fit:
Subscribe for Free Below to see our updated game plan, which includes:
- The two scenarios we are tracking that best fit the potential cycles discussed in this report.
- Critical support levels that must hold for a year-end rally to continue.
- What the overhead targets are if we do see a rally into year-end.
One of these scenarios is starting to take shape — read this timely analysis below.


More To Explore
Newsletter

Nvidia and Google Are Crowding TSMC’s N3 Node - Can Intel Fill the Gap?
Nvidia is moving its next-generation Rubin GPUs from 4nm to 3nm, yet Google’s latest TPUs are already on N3 and are expected to remain there. Meanwhile, a growing number of AI CPUs from Nvidia, Amazon

Intel vs TSMC: How CoWoS Packaging Constraints Could Create an Opportunity for Intel Foundry
Taiwan Semiconductor (TSMC) is the single, most important company to the AI industry. However, to compete with the incumbent, Intel does not need to beat TSMC at leading-edge manufacturing. It only ne

Big Tech’s Free Cash Flow is Turning Negative – Who's Next?
Big Tech’s AI revenue is accelerating, but free cash flow is moving sharply in the opposite direction. Across Google, Microsoft, Meta and Amazon, capex is rising much faster than operating cash flow a
Big Tech Earnings Preview: Is AI Monetization Finally Catching Up to Capex?
The most pronounced difference between 2026’s tech rally compared to rallies in the past is which companies have been left out of it. The names most associated with the AI trade have hardly participat
Nvidia, CXL, and the Battle to Improve AI Inference Economics
This is Part 2 of our two-part series on AI inference economics. In Part 1 — Why Nvidia's Next AI Battle Is About Tokens per Watt, we laid out why tokens per watt has become the defining metric for in
Why Nvidia’s Next AI Battle Is About Tokens per Watt
As hyperscalers move from building AI infrastructure to monetizing it, tokens per watt helps to reflect if revenue is scaling and if profitability is improving. Offload engines can increase tokens per

Micron Is Up 900%. Here’s Why the AI Memory Trade May Still Have Room to Run
Over the past 10 months, memory chip stocks have gone from being solid beneficiaries of the AI boom to capturing a massively outsized piece of the return pie. The inflection in Micron’s performance de

Why the S&P 500 Shrugged Off the Iran War — and What Could Finally Break the Rally
On February 28th, the U.S. went to war with Iran, and the market was handed the kind of shock it hasn't contended with for years. The conflict set off a chain reaction across the region: an ongoing su

Nvidia, CoreWeave, and Nebius: Inside the Circular Financing of the GPU Boom
Neoclouds are one of the more hotly debated AI business models, with CoreWeave and Nebius being the two most widely recognized names. These companies have seen their sales, backlog, and share prices s

AMD, Nvidia, Arm, Intel: Inside the $120 Billion CPU Gold Rush
CPUs have gone from an afterthought to becoming the AI trade’s next great bottleneck – and with AMD, Nvidia, Arm and Intel circling a market that is doubling nearly overnight, the only question left i
