Apple Can’t Save This Tech Rally
January 31, 2024

Knox Ridley
Portfolio Manager
In 2023, the Nasdaq-100 saw its best year since 2009 with returns of 54%. Meanwhile, the S&P 500 finished the year up over 24%, which rivaled 2021’s banner year. The question that should be on every investor’s mind in 2024 is – will this performance continue?
In this article, I lay out both the bull and bear cases for 2024 and beyond. Interestingly, both are calling for a level of volatility in 2024 that will, at least, retrace the rally we’ve seen since November 2023.
Bull Case vs. Bear Case
All trends fit within repeatable patterns. In technical analysis, these patterns repeat in all markets and on all time scales. The only bullish interpretation of the pattern that has developed off the October 2022 lows is what we call a leading diagonal pattern, which generally develops as shown below.

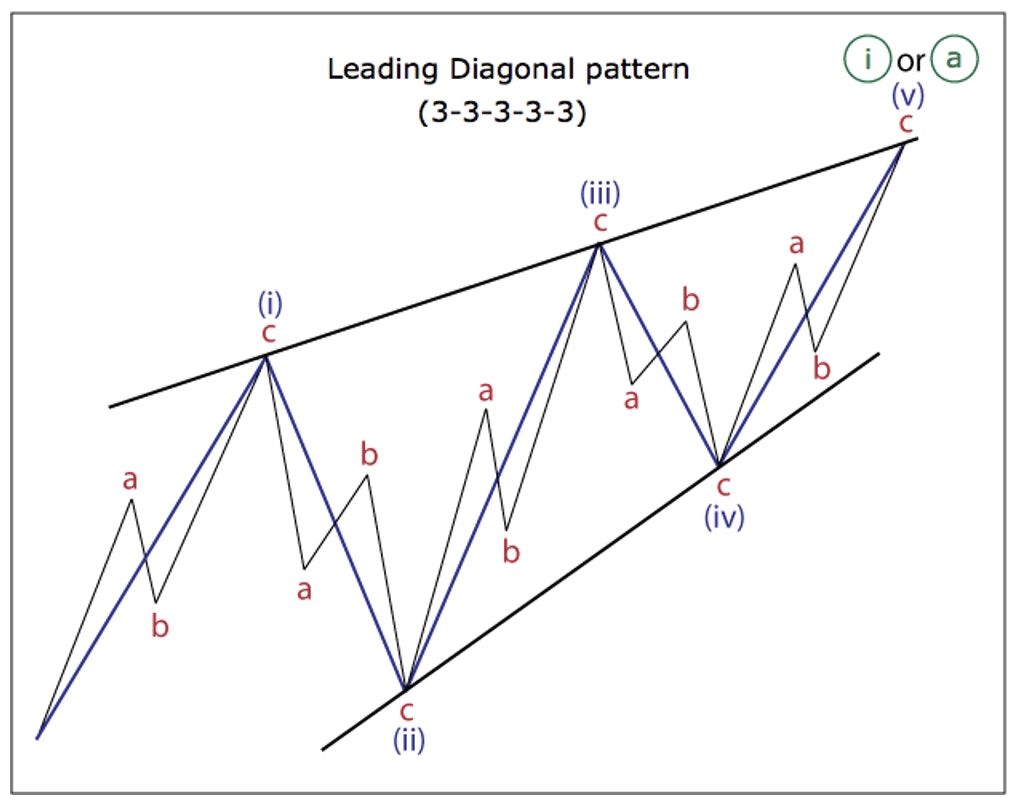
This is a 5 wave pattern that has large and choppy swings in both directions. The key is the 4th wave moving into 1st wave territory, which is what happened in 2023.

If this is what is playing out, then it’s worth noting the 5th wave is coming to an end. This means the larger pattern is almost complete, which should give way to a multi-month correction. The implication here is that the leading diagonal is the 1st wave in a very large 5 wave pattern that will take years to complete.
I have many problems with this scenario, the biggest one is that it does not fit within the context of the secular bull market that started in 2009. That bull market pattern simply does not have room to allow for another multi-year bull run, which makes this scenario a low probability outcome.
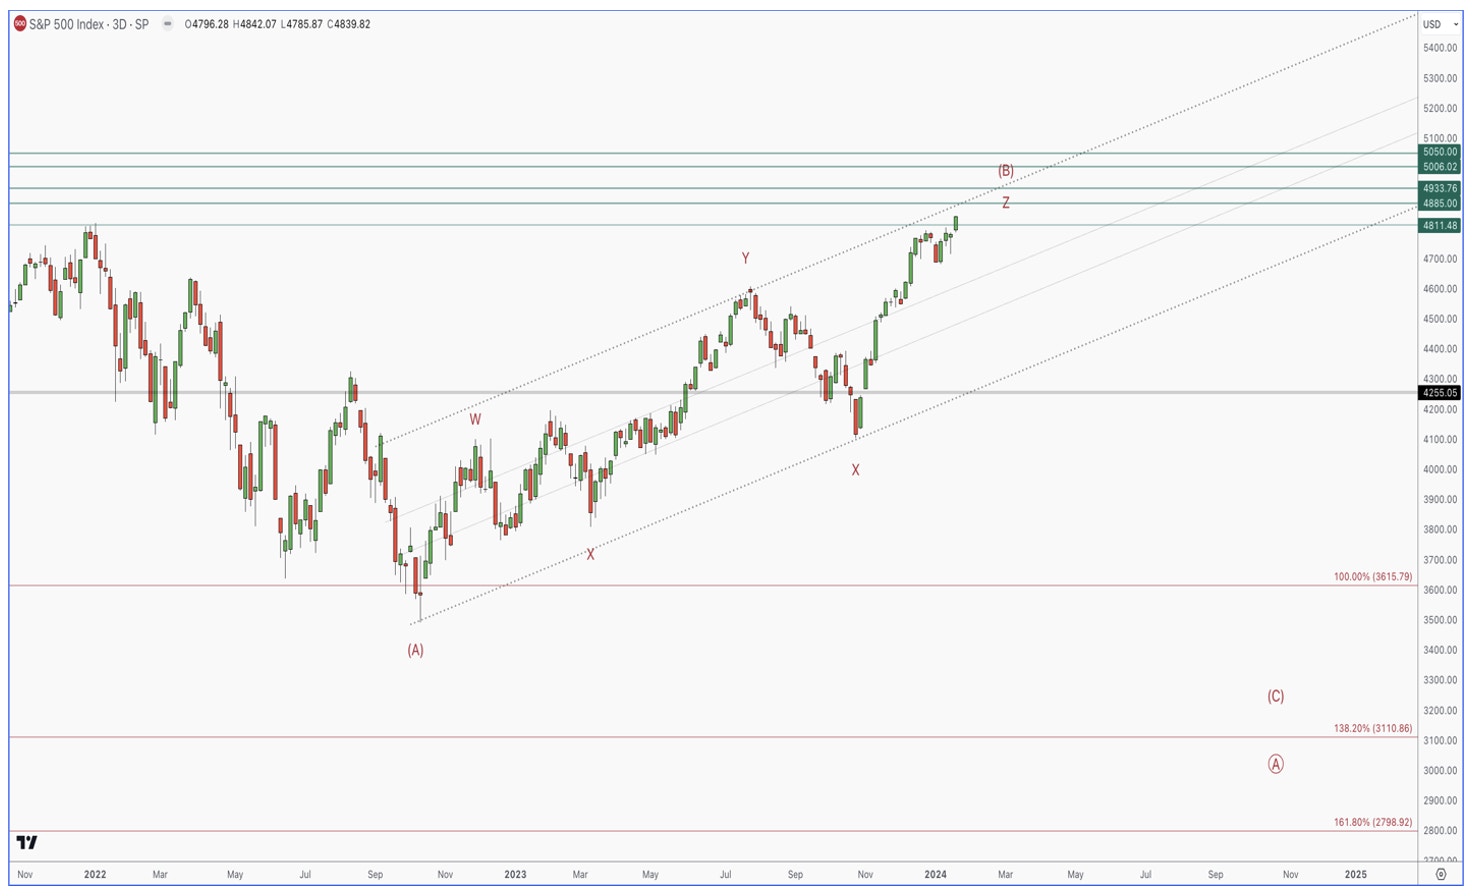
The bear case, which does fit in within the larger context, suggests that 2023 was a cyclical bull market within a secular bear market. In Elliott Wave speak, 2022 was your large A wave, 2023 is the large B wave bounce, and 2024-2025 will be your large C wave drop to new lows.

Regardless of whatever the long-term pattern that unfolds, it’s worth noting that both interpretations are calling for a multi-month drop into mid-2024, which should retrace the bulk of the rally off the November 2023 lows.
Timing the 2024 Top
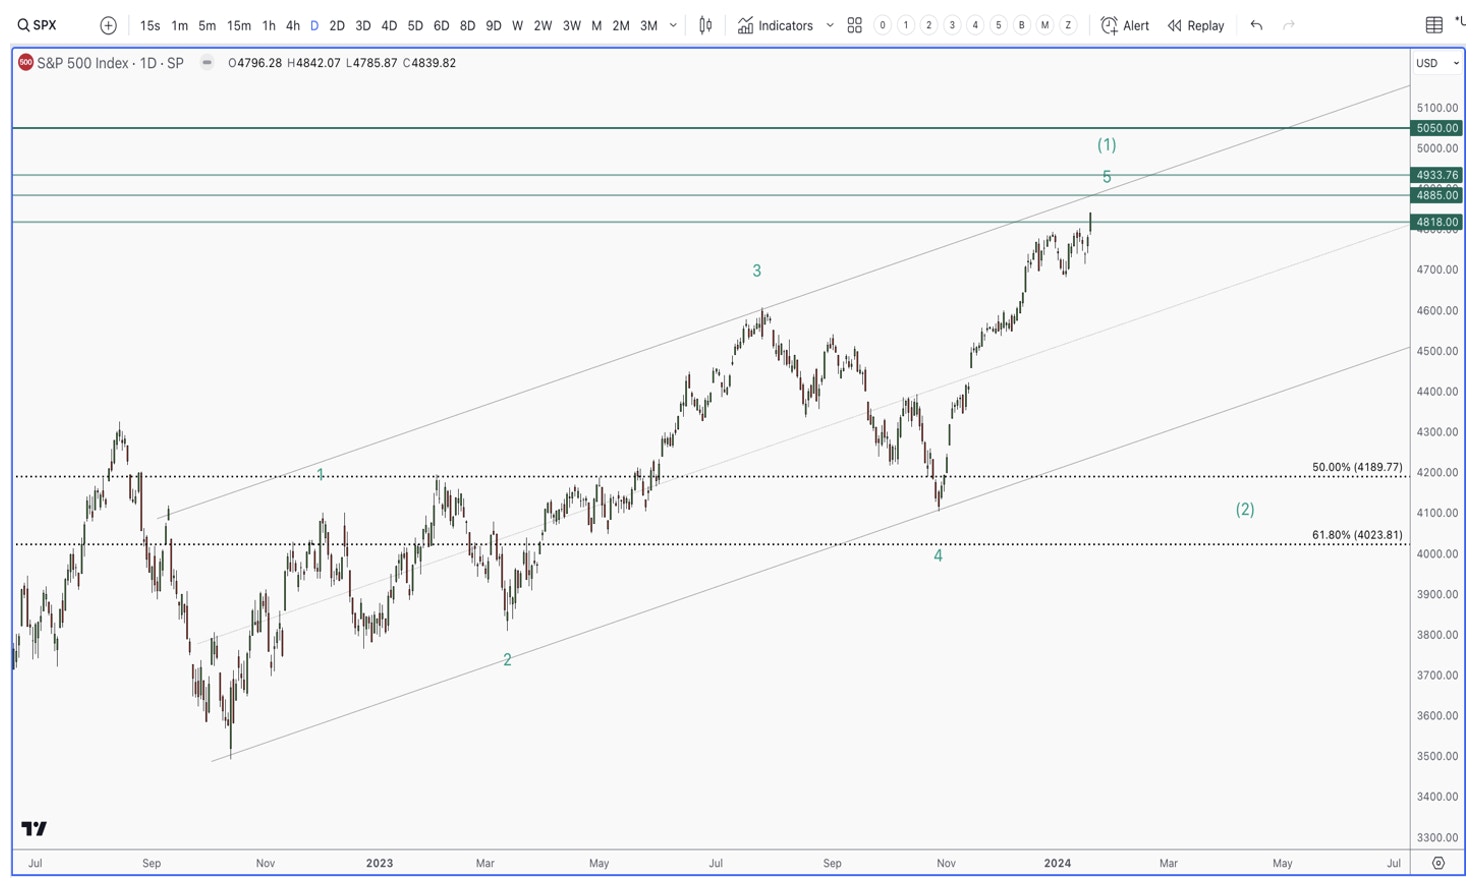
The pattern that is playing out since the November lows in 2023 can be interpreted in three general ways. Keep in mind, it is part of the larger leading diagonal pattern that started in 2022. This means that there is a limit to how high it can extend from here.

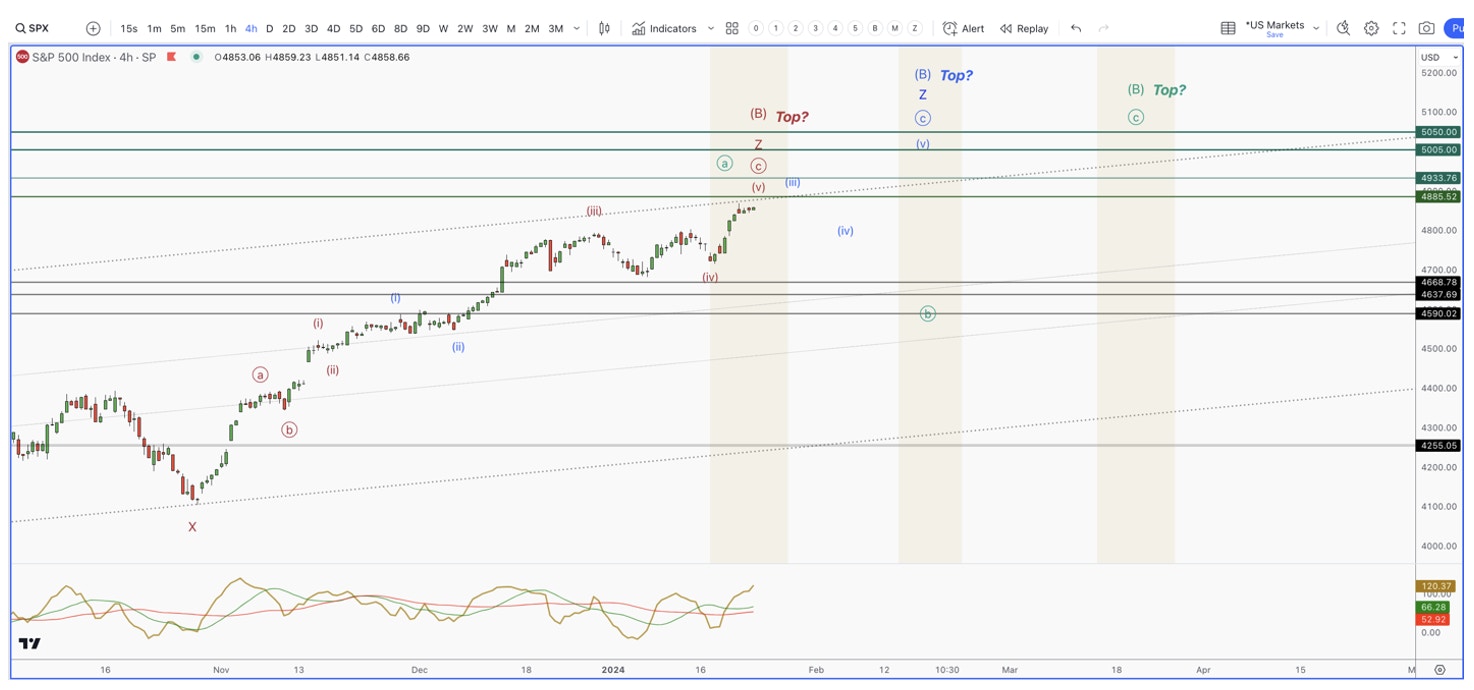
- Red Count – This count suggests that we are in the final 5th wave within the larger uptrend pattern that started in October of 2022. We should see the markets roll over soon once this final 5th wave ends.
- Blue Count – this count has us in a 3rd wave, which should lead to a minor dip, followed by a final 5th wave into the 5000 - 5050 region.
- Green Count – this pattern will see a deep retrace followed by a bullish leg into late March/early April.
When we analyze other markets, the evidence suggests that the green count is a low probability scenario. The likely outcome will be a complex topping process that starts in late January and lasts into mid/late February.
Intermarket Analysis
The green count is calling for a deep retrace of the November rally, followed by a rally that should be equal in length. The problem with this scenario is that most markets are only showing a potential minor swing higher from current prices before completing their larger pattern.
Dow Jones Industrial Average (DJI)
DJI appears to be in a complex correction that is taking us to new highs. If accurate, once complete, we should see a 5 wave drop that eventually retraces all of the 2023 rally. The current pattern is in the form of a 5-wave move, which has all 5 waves intact. The question is how much farther can this last swing extend?


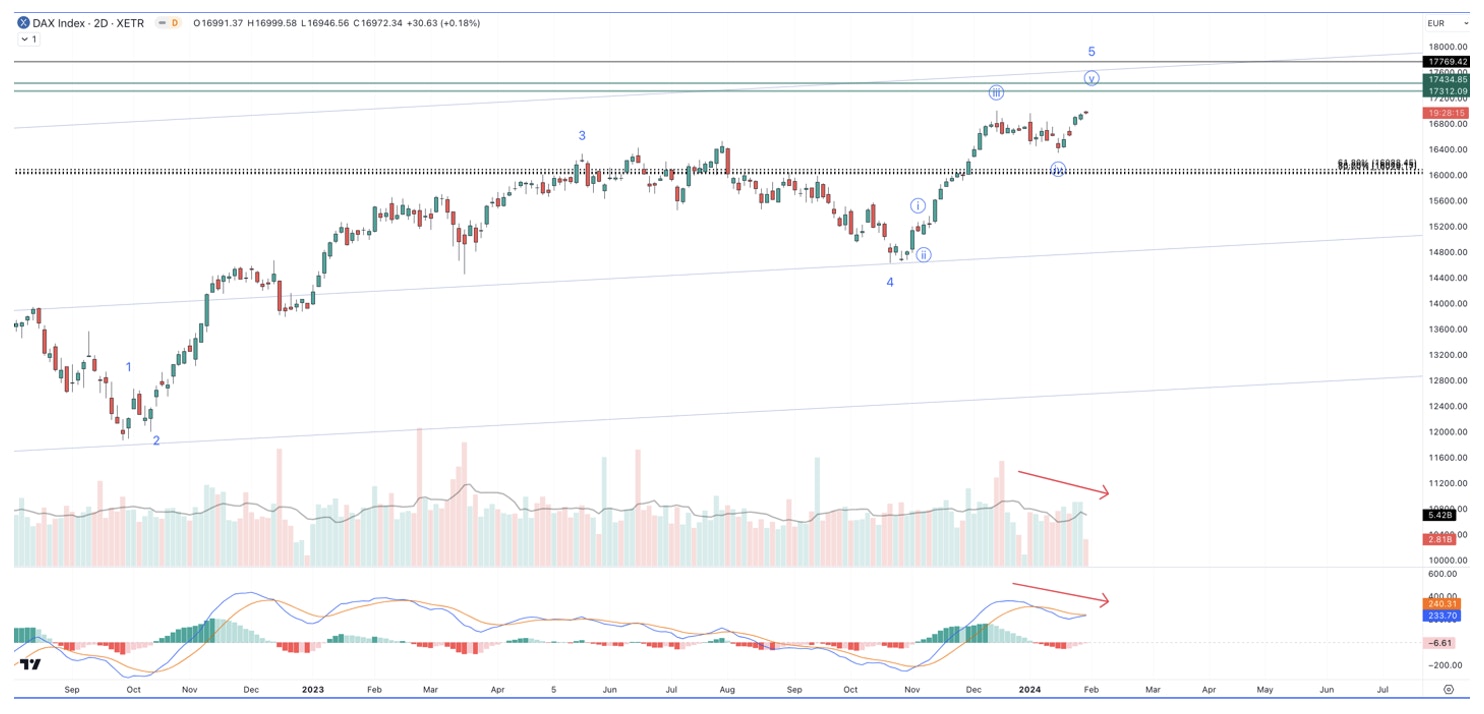
German Dax
The DAX, which has a history of leading the U.S. markets, also looks like it is in the process of working through the final 5th wave swing to complete the larger uptrend pattern. Note how price is making a higher high on lower volume and momentum. This is classic 5th wave behavior – peak volume and momentum tends to happen on the vertical 3rd wave, with less participants in the 5th wave. The question now is – how much higher can it go? We technically have all waves in place, so the upside is much more limited when compared with the downside potential from here.

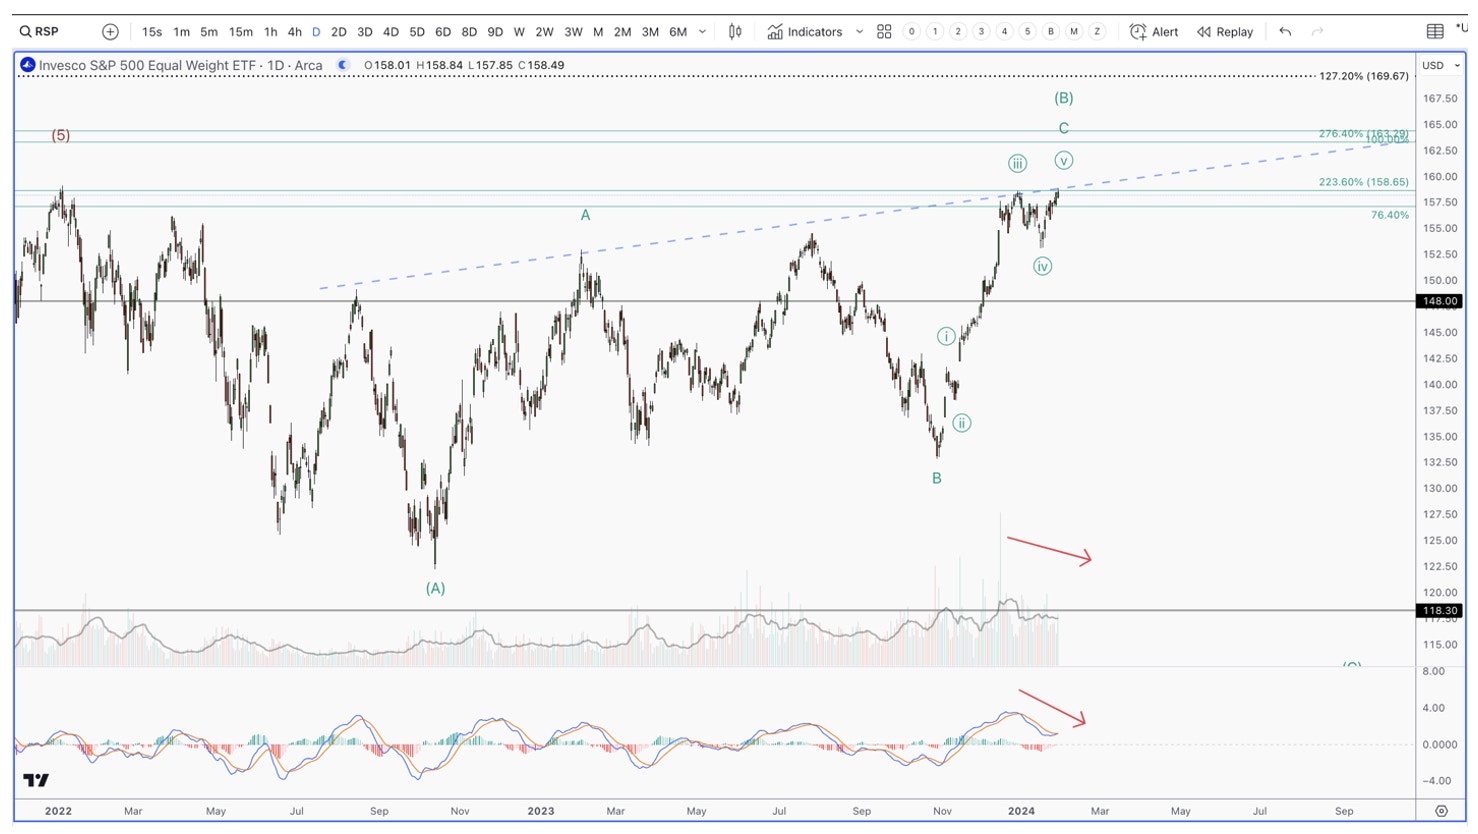
Equal-Weight S&P 500
The Equal Weight S&P 500, which is stripped of tech dominance due to each stock containing equal weighting, looks similar. It needs a 5th wave to complete the larger pattern. If this happens, it will likely be a bull trap for those attempting to buy the breakout to all-time highs.

Japanese Nikkei
The strongest global market, the Japanese Nikkei, is marching towards what could be one of the largest double tops in market history. the symmetry if this larger 5 wave push lines up with these levels quite well. If accurate, we still need a 4th and 5th wave push into this zone, which supports a limited continuation of the current rally.

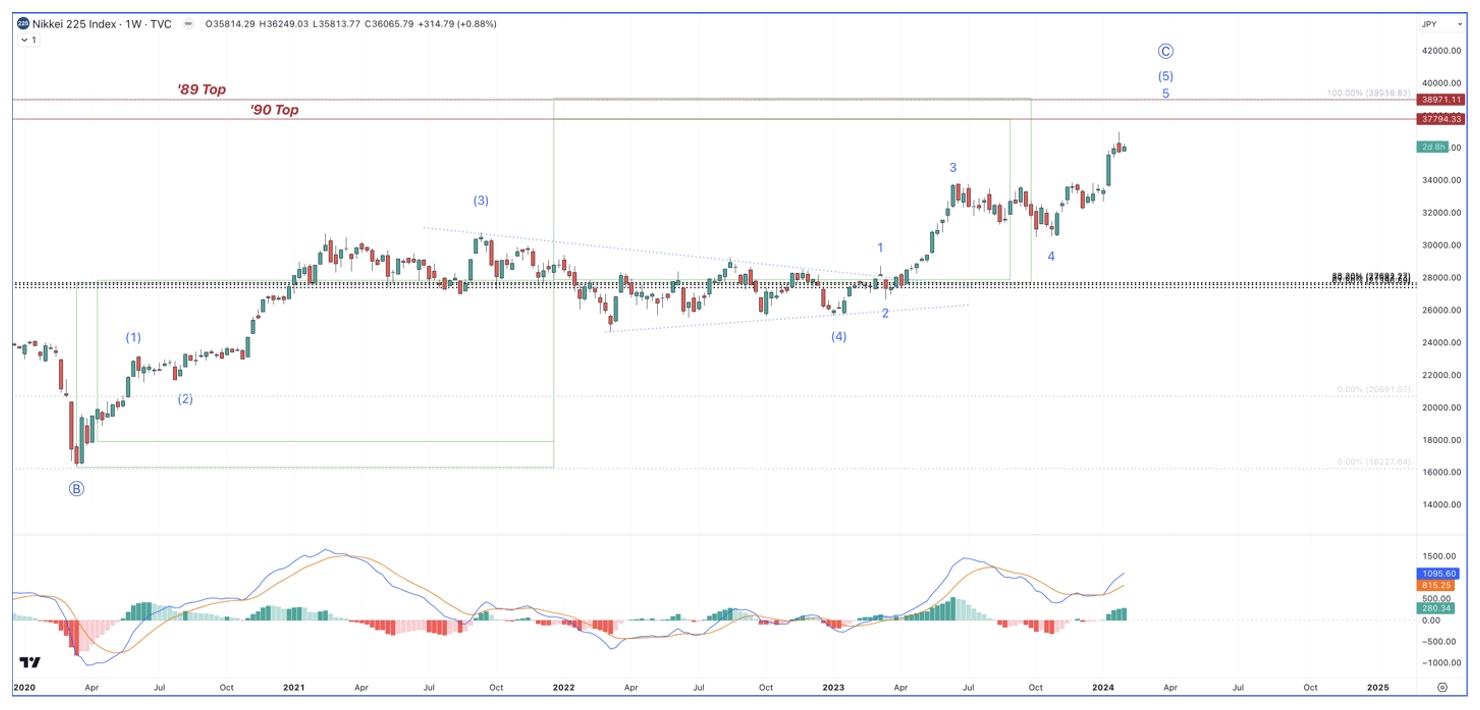
I’m showing some of the more bullish markets in the world. What they all have in common is the same scenario – we are looking at a minor swing higher, at most, which could take us into late mid-February – late-March, before we see a bigger pullback into 2024.
Even the bullish scenario suggests that a multi-week to multi-month correction is likely as we move into 2024. How this correction unfolds, and how deep it goes will tell us whether to raise more cash into any following bounce, or to continue to add to our longs. We will update our readers as we progress.
Divergences
When an index breaks out to new highs from a previous correction, a healthy trend would show many markets participating in that move higher. The more markets participating in the new move higher, the more likely it is to last. However, major indexes are breaking out to new highs while other markets are not, it is a warning sign that we are close to a turning point in the trend.
The below chart showing the S&P 500, NASDAQ-100 and Down Jones Industrial Average on the top panels, all are breaking out to new highs. However, on the below panels, small caps, high beta, and transportation stocks, prior leaders in the prior rally, are not confirming this move higher.


More importantly, one of the largest stocks in the S&P 500 and NASDAQ-100 is also not confirming this breakout move. Apple is currently 7% of the weighting in the S&P 500 and over 9% in the NASDAQ-100. This is a big weight within these indexes, which is signaling caution to the on-going bullish trend.

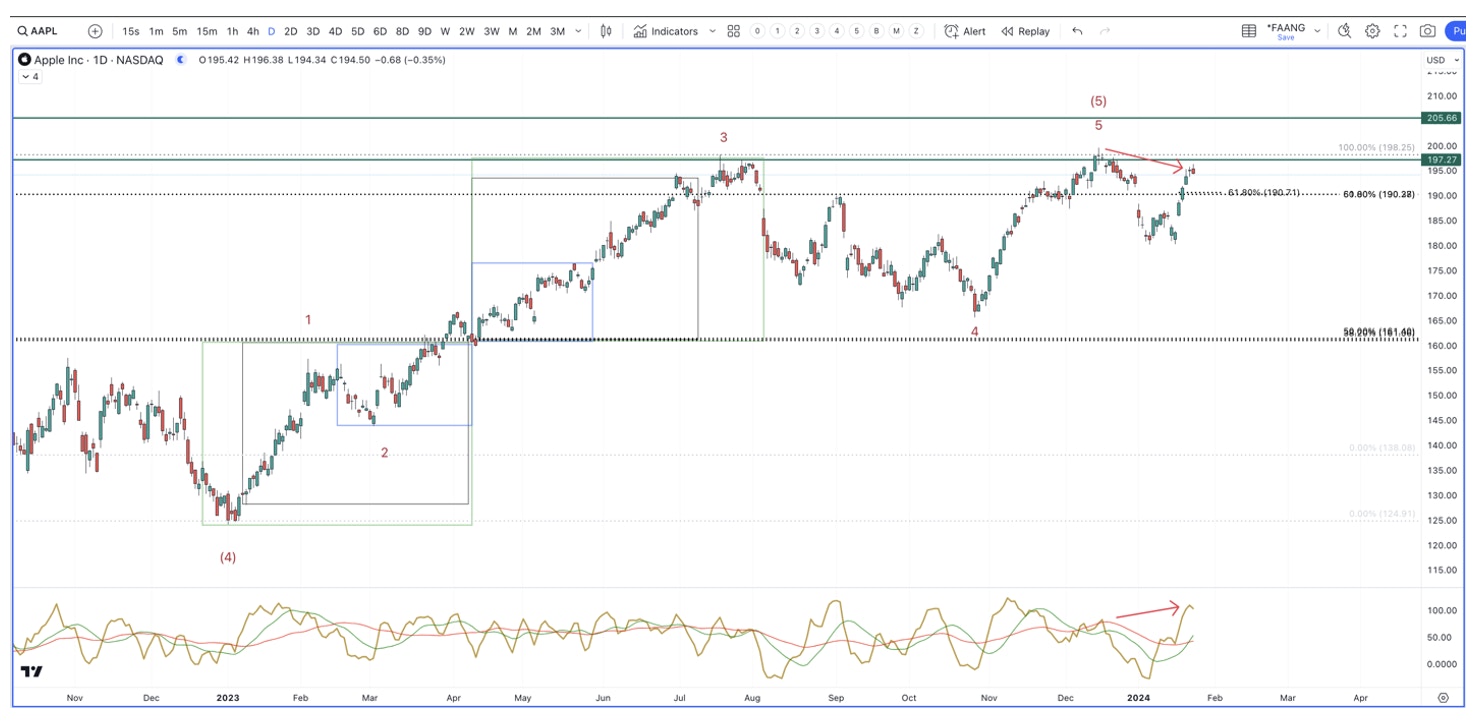
Apple is stalling at the $197 - $200 region, while heading for a triple top potential. The current bounce is happening on less volume and less momentum, while the internal momentum is at a new high without price. These tend to be sell signals.
With that said, we are watching Apple’s earnings results with outsized anticipation given the technical picture just described. On the other hand, a sustained break below $190 will further build the case that the market has likely already begun a larger correction than most anticipate.
What the bulls need to see is Apple break above the $200 region, then retest and hold that level as support. If this happens, then we could see the warnings stated in this report start to get reversed, as the market extends higher.
To reiterate, if Apple fails to break $200 in a meaningful way, and instead turns lower all tech investors should pay close attention.
In conclusion, regardless of what the long-term outlook is in the US markets, the near-to-intermediate term favors a deep retrace into 2024. As shown, most key global markets suggest more upside is likely, but they also support volatility into 2024. With key markets diverging, and not confirming this breakout to new highs, we are likely closer than most think to market reversal.
If you own any FAANGs, especially Apple, or are looking to own any of the FAANGs, we encourage you to attend our weekly premium webinars, held every Thursday at 4:30 pm EST for premium members to discuss how to navigate the broad market, as well as various stock entries and exits. We offer trade alerts plus an automated hedging signal. The I/O Fund team is one of the only audited portfolios available to individual investors. Learn more here.
Disclaimer: This is not financial advice. Please consult with your financial advisor in regards to any stocks you buy.
Recommended Reading:


More To Explore
Newsletter

Big Tech Earnings Preview: Is AI Monetization Finally Catching Up to Capex?
The most pronounced difference between 2026’s tech rally compared to rallies in the past is which companies have been left out of it. The names most associated with the AI trade have hardly participat

Nvidia, CXL, and the Battle to Improve AI Inference Economics
This is Part 2 of our two-part series on AI inference economics. In Part 1 — Why Nvidia's Next AI Battle Is About Tokens per Watt, we laid out why tokens per watt has become the defining metric for in

Why Nvidia’s Next AI Battle Is About Tokens per Watt
As hyperscalers move from building AI infrastructure to monetizing it, tokens per watt helps to reflect if revenue is scaling and if profitability is improving. Offload engines can increase tokens per
Micron Is Up 900%. Here’s Why the AI Memory Trade May Still Have Room to Run
Over the past 10 months, memory chip stocks have gone from being solid beneficiaries of the AI boom to capturing a massively outsized piece of the return pie. The inflection in Micron’s performance de
Why the S&P 500 Shrugged Off the Iran War — and What Could Finally Break the Rally
On February 28th, the U.S. went to war with Iran, and the market was handed the kind of shock it hasn't contended with for years. The conflict set off a chain reaction across the region: an ongoing su
Nvidia, CoreWeave, and Nebius: Inside the Circular Financing of the GPU Boom
Neoclouds are one of the more hotly debated AI business models, with CoreWeave and Nebius being the two most widely recognized names. These companies have seen their sales, backlog, and share prices s

AMD, Nvidia, Arm, Intel: Inside the $120 Billion CPU Gold Rush
CPUs have gone from an afterthought to becoming the AI trade’s next great bottleneck – and with AMD, Nvidia, Arm and Intel circling a market that is doubling nearly overnight, the only question left i

Google TPU v8 vs Nvidia: How Inference Is Rewriting the AI Market
In April, Google announced it would begin selling its TPUs to select third-party data center operators, which is something the market has anticipated for nearly a decade. The TPU-versus-Nvidia-GPU deb

The AI Networking Stock That Beat Nvidia by 7X YTD for Returns of 135% YTD
AI networking stock Lumentum is among the key I/O Fund winners in 2026. We allocated heavily to LITE in January—a month before Nvidia backed the company. While most investors couldn’t stomach taking a

Bloom Energy — Our 2026 Top Pick Was the Best Performing Stock in April
April was the best month in six years for the Nasdaq-100. The single best-performing large-cap stock wasn't Nvidia, Microsoft, or Meta. It was Bloom Energy, up roughly 109% in one month. As you'll rec
