Social Media Stocks: One Metric Shows Meta’s Clear Leadership
January 16, 2024

Beth Kindig
Lead Tech Analyst

This article was originally published on Forbes on Jan 11, 2024,05:24pm EST
Social media stocks Meta (META), Pinterest (PINS), and Snapchat (SNAP) enjoyed strong gains in 2023 as the broader ad market stabilized and fundamentals improved. Social media ad spend is expected to remain robust in 2024, with one of the fastest projected growth rates in the ad industry at +13.8% to reach $227.2 billion, less than 1% shy of search ad spend.
This upbeat ad market forecast leaves investors questioning if more upside awaits social media stocks in 2024. In this analysis, we dig into Meta’s leadership in the space, some improving trends at Pinterest, and how Snapchat has weaker ARPU than its peers.
Meta’s strength in ARPU and cash flow generation stands out here, setting it clearly apart from Snapchat and Pinterest – it can maintain spending 30% of gross profit on R&D while driving significant cash flow growth.
Ad Pricing Recovers While Impressions Remain Strong
Ad impression growth remains strong for Meta and Pinterest, while ad pricing is in the initial stages of a recovery after declining for multiple quarters as companies optimized budgets through much of 2022 and early 2023.
Sign up for I/O Fund's free newsletter with gains of up to 221% - Click here
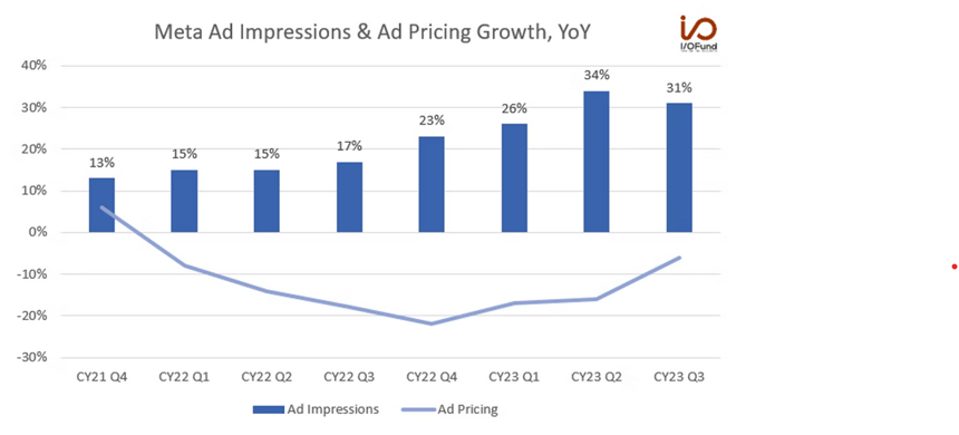
Meta: Ad Impressions Remain Strong
Meta reported 31% YoY growth in ad impressions in Q3, a second straight quarter with growth above 30% YoY after a string of growth in the teens in 2022. Impression growth was driven by APAC and Rest of World, Facebook’s two largest and fastest growing geographies for daily active users. DAUs rose ~6% higher in both regions to top 1.57 billion combined, equivalent to 75.5% of Facebook’s global DAUs.
Ad pricing declined (6%) in Q3, adding further confirmation that pricing bottomed in Q4 2022. The decline was driven by that strong growth in impressions in APAC and Rest of World, as the two are Facebook’s lowest monetizing regions with ARPU less than half of global ARPU. Meta said that “overall engagement on Facebook and Instagram remains strong,” and Reels “continues to grow and drive incremental engagement.”
What investors should watch for is if improved ad targeting from AI features can help drive ad pricing back to growth, supported by a favorable spending backdrop and continuing strength in ad impressions globally.

Source: Meta
Pinterest: Pricing Remains Depressed
Pinterest reported similarly strong trends in ad impression growth while pricing also remained depressed. Pinterest said in its Q3 earnings call that it has “been able to drive increases in both total impressions and in ad loads simultaneously,” thus driving impression growth of 26% YoY. This marked a significant 10 percentage point increase from the 16% impression growth from Q2 and Q1.
Pricing declined (12%) in Q3, an 8 percentage point sequential improvement from a (20%) decline in Q2. Pinterest chalked up the improvement to “industry-wide demand stabilization” and its “AI-fueled ad stack efficiencies.” However, a double-digit decline for ad pricing is weighing on strong impressions growth, as Pinterest has struggled to meaningfully improve ARPU this year.
Snapchat: Growth Still in Single Digits
While its peers are reporting high double-digit impressions growth, Snapchat’s growth remains in the single-digits, reporting just 7% YoY growth in Q3. This marked a slight 2 percentage point acceleration over Q2, though it remained below the growth levels seen throughout 2022, a stark contrast to both Meta and Pinterest who have witnessed double-digit percentage point accelerations.
Pricing is nearing an inflection, recovering to just a (5%) decline in Q3 compared to an (18%) decline in Q1 as impressions growth continues to outpace demand.

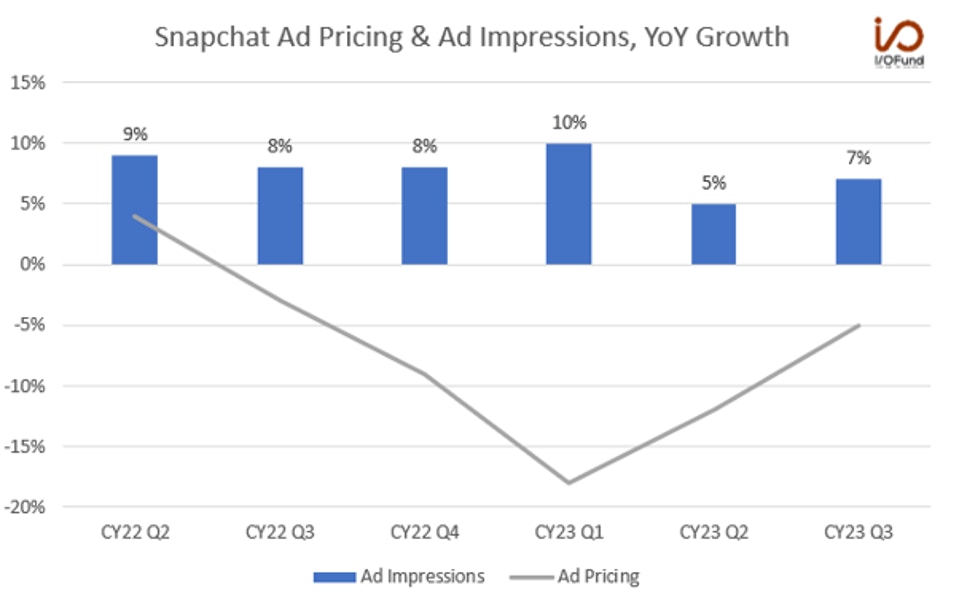
Source: Snapchat
Every Thursday at 4:30 pm Eastern, the I/O Fund team holds a webinar for premium members to discuss how to navigate the broad market, as well as various stock entries and exits. We offer trade alerts plus an automated hedging signal. The I/O Fund team is one of the only audited portfolios available to individual investors. Learn more here.
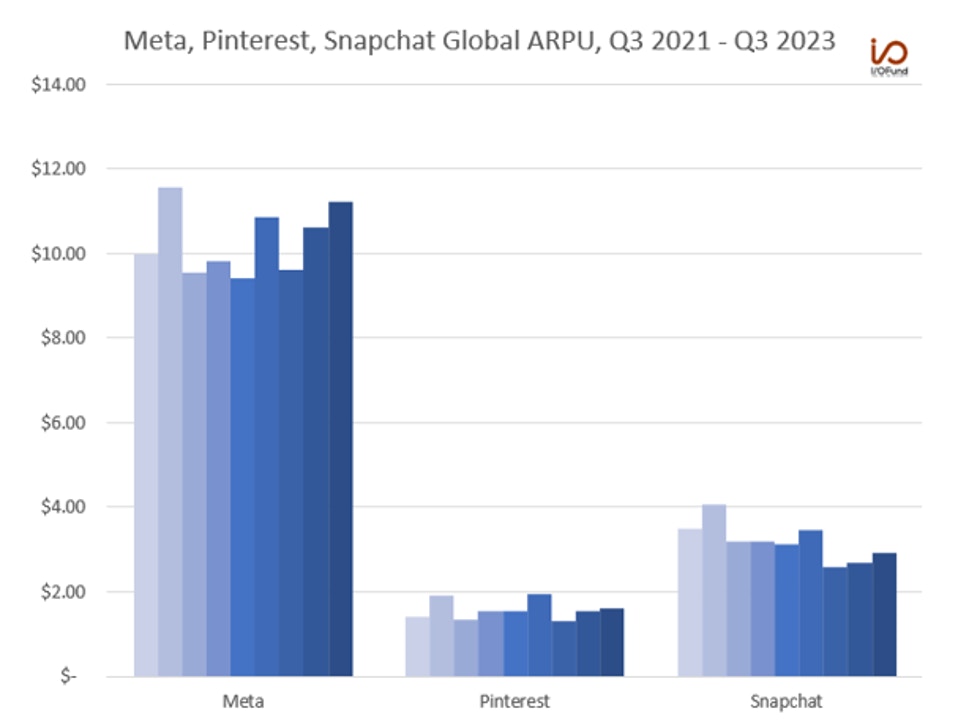
Meta & Pinterest ARPU Accelerating
Meta and Pinterest both are demonstrating accelerating ARPU in core geographies, whereas Snapchat is struggling to improve monetization of its user base, with ARPU in core geographies declining. All three displayed solid double-digit ARPU growth in Europe, a dominant factor in global ARPU growth in Q3.
- Meta’s global ARPU increased 19% YoY to $11.23, aided by 34% YoY growth in Europe to $19.04. US & Canada ARPU rose 14% YoY to $56.11, marking a solid acceleration from 7% growth in Q2.
- Pinterest’s global ARPU rose just 3% YoY to $1.61, aided by 5% YoY growth in US & Canada $6.46. Europe’s ARPU rose 26% to $0.91 in the quarter.
- Snapchat’s global ARPU declined (6%) YoY to $2.93, as North America ARPU fell (4%) YoY to $7.82 as monetization struggles persist. Europe mirrored peers with double-digit growth, at 15% YoY to $2.11.

Source: Company Filings
Over the past two years, Snapchat’s ARPU weakness is visible. Global ARPU is down (16%) relative to Q3 2021, compared to a 12% increase for Meta over the same period. Pinterest’s ARPU is trending relatively in line to 2022’s levels, and looks relatively weak, sitting around half of Snapchat’s ARPU with slow growth reported in Q3. Meta’s ARPU has accelerated through 2023 and is on track to potentially reach a record level in Q4.
R&D Expenditure Trends Highlight Meta’s Leading Position
Snapchat lags both Pinterest and Meta with weaker impressions growth and declining ARPU. That is the key shortcoming in Snapchat’s growth story: an inability to effectively monetize its user base to generate GAAP-profitable growth.
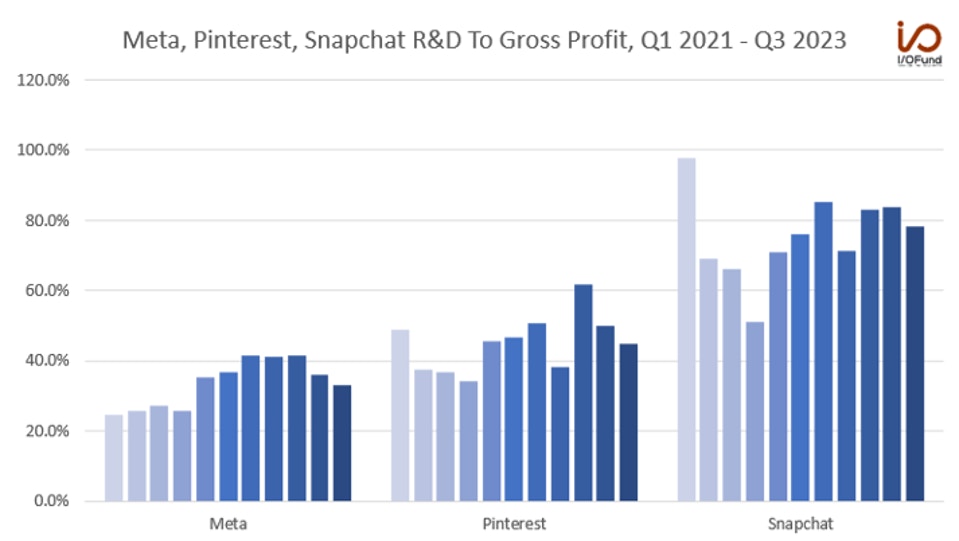
R&D expenditure trends highlight both Snapchat’s inefficiencies, while clearly demonstrating Meta’s ability to maintain high R&D spend and be a cash machine.

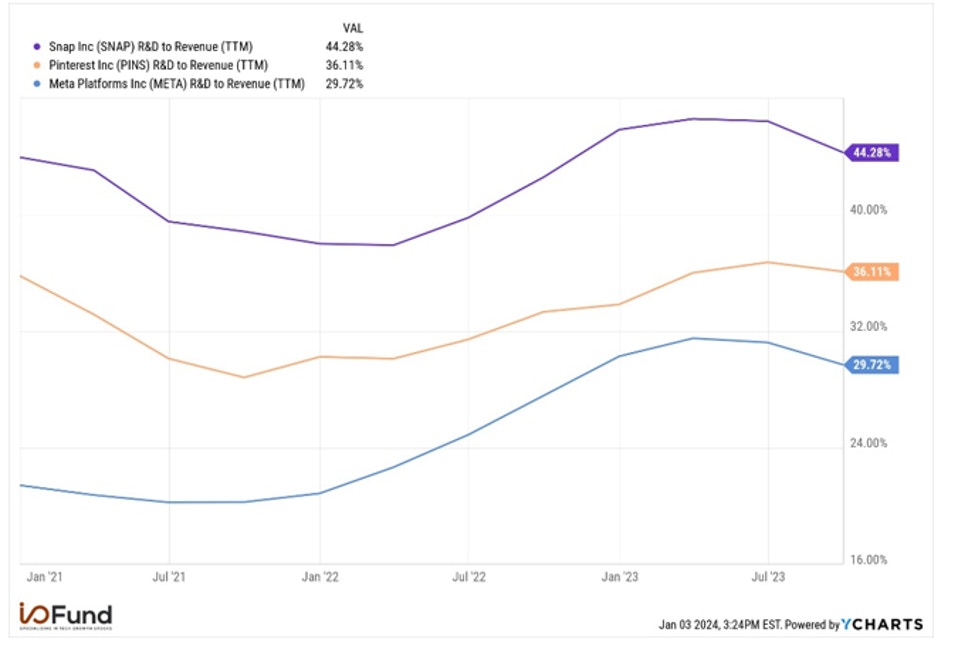
Source: Ycharts
Snapchat is putting more than 44% of its revenue into R&D, compared to 36% for Pinterest and nearly 30% for Meta – the three have all increased R&D expenditures as a percentage of revenue since 2022, for the development and deployment of AI and ML features as well as other product innovations. Snapchat’s primary R&D investment is augmented reality, both to increase user engagement – more than 60% of DAUs interact with AR features – and to drive increased ROI and click-through rates for advertisers.
However, the real issue for Snapchat -- what sets it apart from Pinterest and Meta and the reason it will struggle to reach and generate GAAP profitable growth over the medium term – is that it is spending around 80% of its gross profit dollars on R&D.

Source: Ycharts
Essentially, Snapchat is spending a disproportionately high amount on R&D relative to peers while failing to increase ARPU and monetization within its user base. This is creating a downward spiral for GAAP profitability from operations, with GAAP operating margin below (30%) in each quarter in 2023 and below (22%) for seven straight quarters.
What sets Meta apart is that it can maintain a high level of R&D spend – at more than 33% of gross profit in Q3 and above 36% YTD through Q3 – while remaining a cash cow with strong operating cash flow and free cash flow growth. Meta’s operating cash flow margin rose to nearly 60% in Q3 as it generated $20.4 billion in OCF during the quarter. Meta is on track to deliver nearly 50% growth in OCF in 2023 to nearly $75 billion, assuming OCF margin in Q4 stays in line with Q3’s level. Free cash flow totaled $13.64 billion in Q3, a 40% margin, while YTD free cash flow was $31.51 billion, a 33% margin.
Valuation
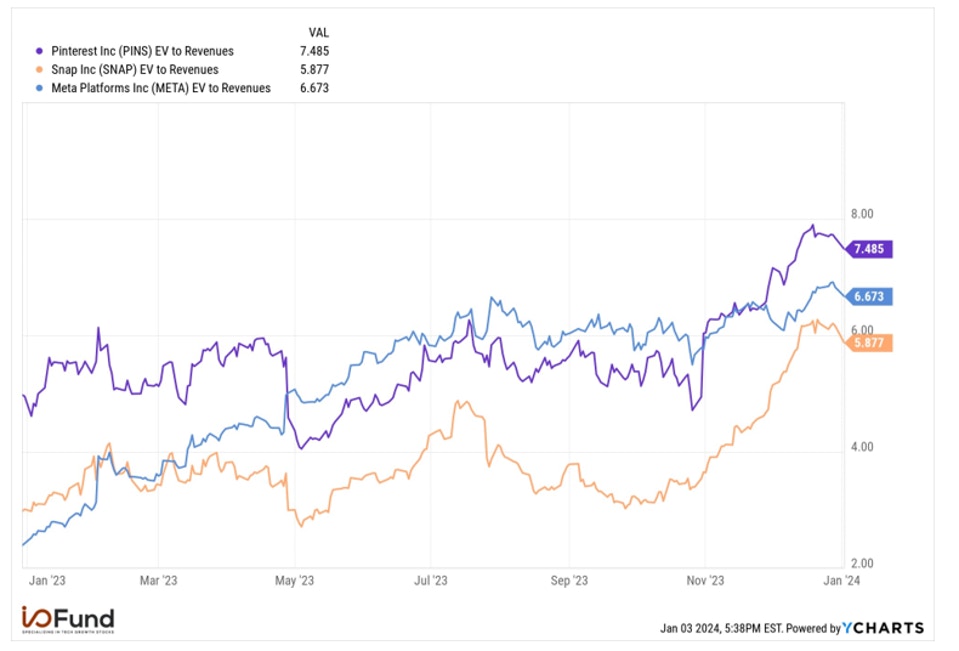
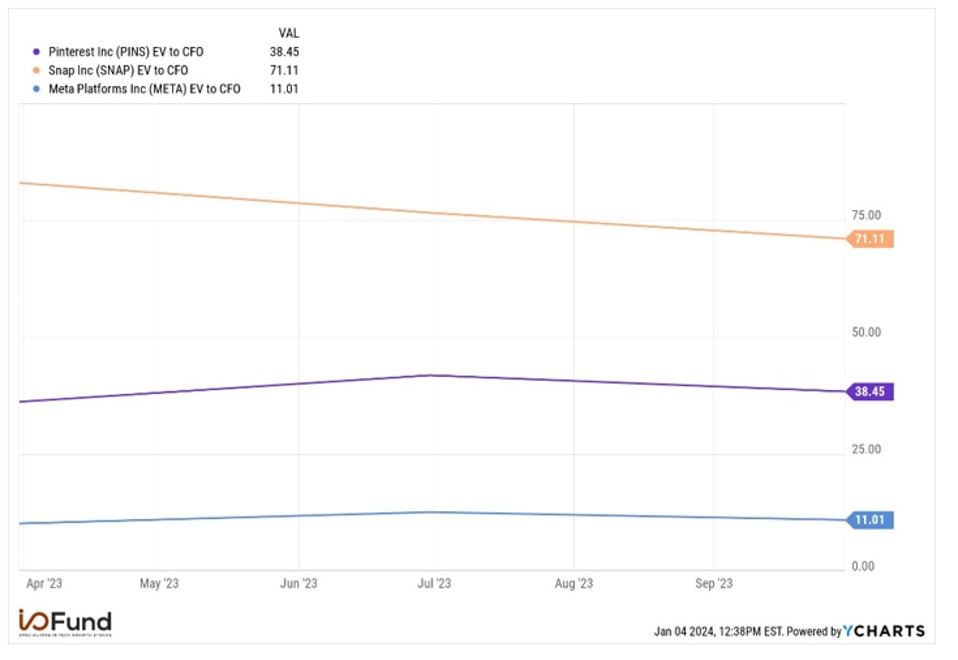
Snapchat’s 90% rally in Q4 has taken its valuation on an EV to revenue basis nearly in line with Meta and Pinterest, though Snapchat is much more expensive than the two on an EV to operating cash flow basis.

Source: Ycharts
Snapchat is trading at nearly 5.9x EV/revenue, compared to 6.7x EV/revenue for Meta and 7.5x EV/revenue for Pinterest. Forecasted revenue growth rates for the three currently sit in the teens: 13.4% for Snapchat, 16.5% for Pinterest, and 13.0% for Meta.
In terms of EV to operating cash flow, Snapchat trades at a high premium given it sees inconsistent growth in OCF – it currently trades at 71.1x OCF, versus 38.5x for Pinterest and 11x for Meta. Pinterest’s operating cash flow growth has also been lumpy, though its cash flow generation remains stronger than Snapchat’s. Meta is significantly cash flow positive, and may deliver nearly 50% growth in OCF in 2023 to nearly $75 billion.

Source: Ycharts
Conclusion
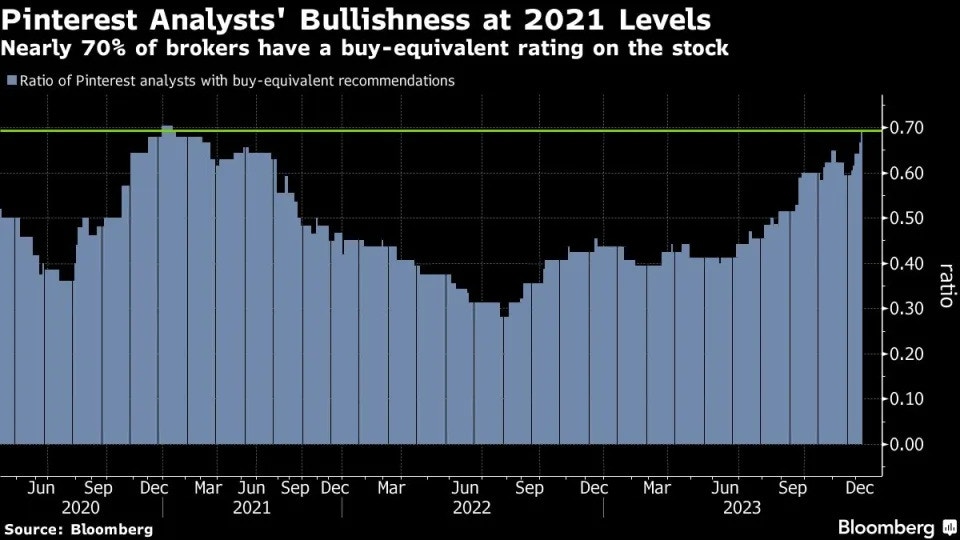
Bullishness on social media stocks has risen rapidly – Meta leads the tech universe with the most analyst buy recommendations heading into 2024 with 41, and bullishness on Pinterest has reached 2021 levels, with approximately 70% of analysts giving it a buy rating.

Source: Bloomberg
Meta’s ability to drive significant growth in multiple key metrics sets it apart from Snapchat and Pinterest as a clear leader in the social media sphere. The Facebook and Instagram parent continues to witness strong growth in ad impressions as pricing recovers, driving ARPU higher, while its superior margin profile allows it to spend 18x more than Snapchat on R&D while generating substantial cash flow.
Pinterest’s ARPU is relatively in line with 2022’s levels, but single-digit growth raises red flags as ARPU is much lower, around half of Snapchat’s and less than one-tenth of Meta’s. Snapchat is struggling to effectively monetize its user base, and is spending substantially more of its gross profit dollars on R&D without seeing material benefits to growth.
I/O Fund Equity Analyst Damien Robbins contributed to this analysis.
Please note: The I/O Fund conducts research and draws conclusions for the Fund’s positions. We then share that information with our readers. This is not a guarantee of a stock’s performance. Please consult your personal financial advisor before buying any stock in the companies mentioned in this analysis.
Recommended Reading:


More To Explore
Newsletter

Google TPU v8 vs Nvidia: How Inference Is Rewriting the AI Market
In April, Google announced it would begin selling its TPUs to select third-party data center operators, which is something the market has anticipated for nearly a decade. The TPU-versus-Nvidia-GPU deb

The AI Networking Stock That Beat Nvidia by 7X YTD for Returns of 135% YTD
AI networking stock Lumentum is among the key I/O Fund winners in 2026. We allocated heavily to LITE in January—a month before Nvidia backed the company. While most investors couldn’t stomach taking a

Bloom Energy — Our 2026 Top Pick Was the Best Performing Stock in April
April was the best month in six years for the Nasdaq-100. The single best-performing large-cap stock wasn't Nvidia, Microsoft, or Meta. It was Bloom Energy, up roughly 109% in one month. As you'll rec
Inside Nvidia’s $4B Optical Strategy—and Why CPO Changes Everything
Within the AI investment theme, there is nowhere that the supply chain shifts faster than in networking, leading companies to gain content on new platforms or lose incremental share. The reason is str
Is Nvidia Stock a Buy? Why Semiconductor Strength May Signal a Market Top
In this report, we take a deeper look at the technical scenarios, which suggests that Nvidia’s latest high is shaping up to be a potential bull trap. That view is corroborated by the broader semicondu
Nvidia’s $20 Trillion Thesis Is Intact. My 2026 Allocation Isn't
The thesis on Nvidia's hardware moat has played out exceptionally well, but that also highlights one of the biggest risks investors face, which is becoming emotionally attached to a winning stock. Whi

Bitcoin 2026 Price Prediction: Why the Dollar, Global Liquidity and Volume Signal More Downside Ahead
In our last Bitcoin analysis, "Bitcoin After the Cycle Peak: What Comes Next and How We're Positioning", we argued that Bitcoin was closer to a cycle low than most believed, even if one final drop rem

2026 Stock Market Outlook: Cycle Convergence & What's Next
In our last broad market update, the S&P 500 was trading near 6,850, grinding through its fifth consecutive month of going nowhere. I drew a clear line in the sand at the 6,780 level. This was where t

Arm Stock Could Win as Agentic AI Shifts the Bottleneck to CPUs
Arm unveiled an AGI CPU to address one of AI’s biggest bottlenecks, which is orchestration. During the chatbot craze of 2023-2025, GPUs did most of the heavy lifting while CPUs had become an afterthou
Nvidia Stock Prediction: The Path to a $20 Trillion Market Cap is Strengthening
The $20 trillion market cap will not come from GPU unit growth alone, though unit growth remains very important. Rather, the value proposition will increasingly focus on economic output. This marks a
