Major Top or One More High
September 08, 2023

Knox Ridley
Portfolio Manager

September is widely known to be the worst month for tech as it’s the only month to see negative average returns for the past decade for the Nasdaq 100. Meanwhile, the index is entering September up 42.5% YTD, setting up investors who are sitting on paper gains for potentially a large disappointment.
There are many cross currents driving the markets in 2023, which can make positioning challenging for investors right now.
On the positive side, the economy grew at a 2.4% annualized rate in Q2, with an early projection for Q3 to be a stunning 5.8% annualized, This is accompanied with a strengthening consumer, and a resilient employment market with room to grow. If there was ever an environment for the Central Bank to pull off a soft-landing, this would be it.
On the other hand, the track record for the FOMC’s ability to pull off a soft landing is not very good. There have been previous instances where low inflation environments allowed them to rescue equities with injections of liquidity, such as the mid-1990s, 2016, 2020. However, there is no instance in market history where they were able to pull off a soft-landing in an environment with heightened inflation. This coupled with the most inverted yield curve in decades, and the Money Supply going negative for the first time since the 1930s, it makes sense to give up some additional gains in any further swing higher, just to be prepared for the coming crash.
With this many cross currents, there is no shortage of well-supported narratives. For this reason, we believe the best means to navigate the current markets is by focusing on price. If we are going to see a major pullback, this will show up in specific price patterns breaking through critical support. Until then, we believe it wise to not fight the current trend, even with the high probability of a recession manifesting within the next six months.
It is our belief that inflation will likely start surprising to the upside in the next three months. We’ve been talking about the strong economy = strong inflation theme for several months, and with energy and food prices in sustained uptrends, this theme will likely start to manifest soon. We also believe the US will enter a recession within the November 2023 to March 2024 time frame. This will cause a top in equities, which is showing up in the charts. The only question is if this top will coincide with a recession, which we will use technical analysis to help guide us.
We have a solid history of using these techniques to identify turning points. For example, between October 12 – November 9th of 2022, we put all of our cash to work in the markets. On October 12th, we timed the bottom perfectly, buying companies like NVDA at $108.


Two Scenarios for Potential Tops
There are three general counts I'm tracking into Q1 of 2024. The Green count, or some variation of it, is the most likely. This suggests that we see one more swing into the 4680 - 4730 region after a drop into the 4275 region, which is likely playing out now. The red count will mimic the Green count with the possibility of a larger swing higher into Q1 of 2024. The targets here are 4890 – 5000 SPX. The Blue count has us topping. We would need to see a break below 4245 SPX for confirmation of the Blue count.

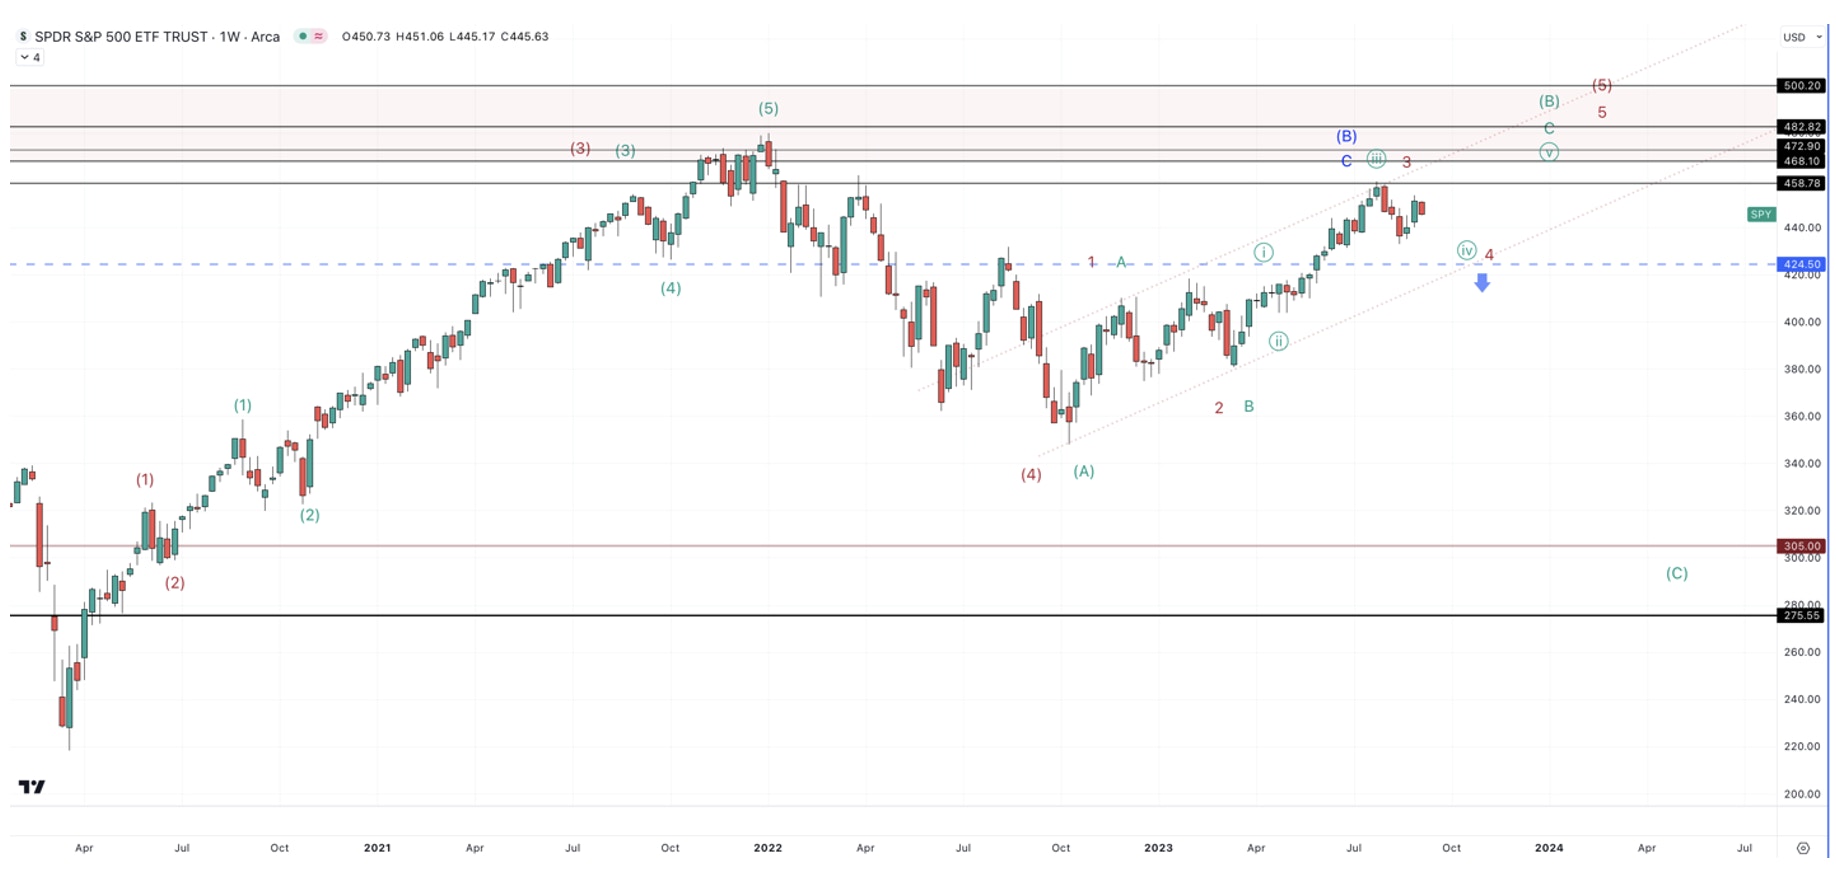
I believe that we are marching towards a recession, which will cause a top in equities. This view has become contrarian, as the consensus is now calling for a soft-landing.


Even though this is my thesis, as a portfolio manager, I cannot be too attached to a thesis and must be willing to pivot. This is the reason I put so much weight on price. It is because it is the only metric that ultimately matters, and it will be the final arbiter of what narrative will win out in this market. Price can help you pivot when you are wrong, and also confirm an unexpected scenario is starting to play out.
The reason I say this is because of the Blue count, which suggests a top has already happened. There is no evidence in the macro data suggesting a Q3 recession is underway. However, if we see price break below 4245 SPX, I'll have no choice but to make this the primary count. So, that is the ultimate bail-out for the Green and Red counts.
Sign up for I/O Fund's free newsletter with gains of up to 221% - Click here
If we zoom into the cyclical bull market that started in October of 2022, we can get some more clarity on where this trend can go. Let's start with the push higher that started two weeks ago. With price breaking below 4478 SPX, it appears that we are starting the next leg lower in this correction, which we have 4275 as a strong target.

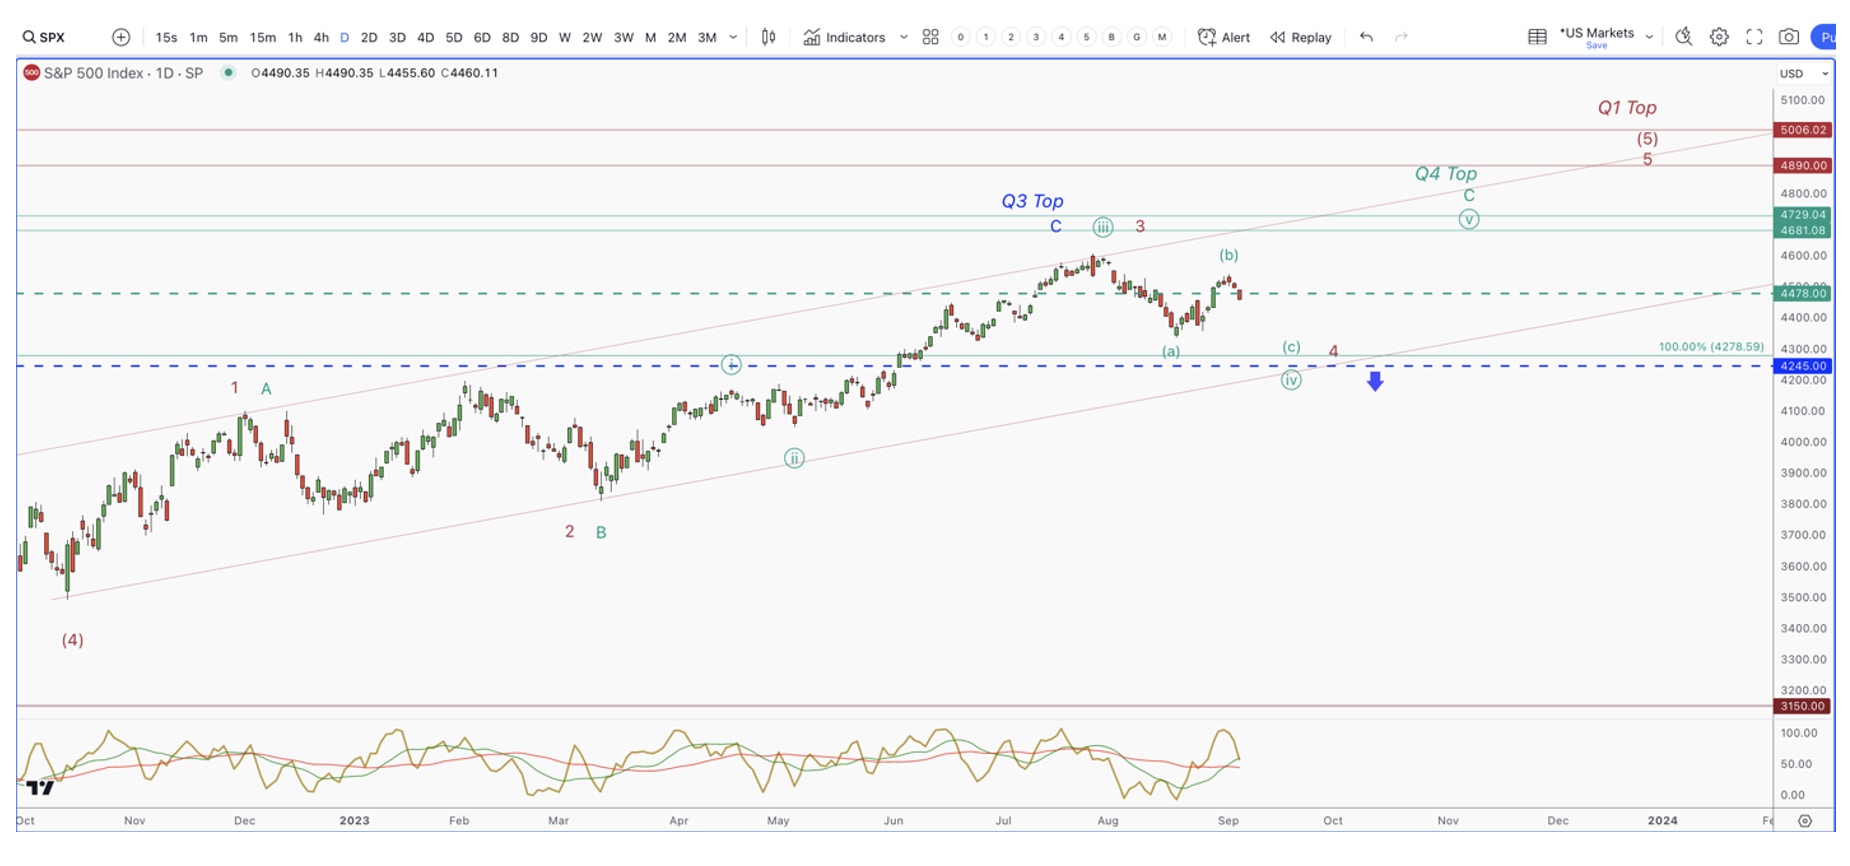
In conclusion, as stated earlier, as long as this drop stays above 4245 SPX, we are expecting a push higher into Q4/Q1. This will likely set up a nice buying opportunity for those looking to capture the final swing in the large uptrend that started in October of 2022.
This is the most likely outcome, considering the resilience of the US economy, which is not in threat of going into recession right now. Also, we expect the new uptrend in energy prices to hit CPI data in October. If we start seeing a return to upside surprises in inflation data, it will likely trigger a risk-off environment for equities that is worth monitoring. We will update you as we go along.
Next week we’ll discuss the most important markets to track for a continued push higher in equities.
If you want to track the potential top in equities, join I/O Fund next Thursday, September 14th at 4:30 pm EST, for our premium webinar. We will go over in detail all possible scenarios, plus the levels that need to hold that can confirm what is likely playing out. We will also go over the specific AI stocks we are targeting for this final run higher, as well as our game plan for when we confirm a top.
Disclaimer: This is not financial advice. Please consult with your financial advisor in regards to any stocks you buy.
Recommended Reading:


More To Explore
Newsletter

Token Growth is Surging - Here Are the Beneficiaries
The reality of AI demand growth has shattered early estimates for token processing, yet expectations continue moving up and to the right. In the second installment of our token processing series, we e

AI Token Demand is Shattering Forecasts
Total annual token processing is no longer measured in billions or trillions of tokens, but in the quadrillions and beyond. As annual token processing is now tracked in units with 15 trailing zeros, i

Nvidia and Google Are Crowding TSMC’s N3 Node - Can Intel Fill the Gap?
Nvidia is moving its next-generation Rubin GPUs from 4nm to 3nm, yet Google’s latest TPUs are already on N3 and are expected to remain there. Meanwhile, a growing number of AI CPUs from Nvidia, Amazon
Intel vs TSMC: How CoWoS Packaging Constraints Could Create an Opportunity for Intel Foundry
Taiwan Semiconductor (TSMC) is the single, most important company to the AI industry. However, to compete with the incumbent, Intel does not need to beat TSMC at leading-edge manufacturing. It only ne
Big Tech’s Free Cash Flow is Turning Negative – Who's Next?
Big Tech’s AI revenue is accelerating, but free cash flow is moving sharply in the opposite direction. Across Google, Microsoft, Meta and Amazon, capex is rising much faster than operating cash flow a
Big Tech Earnings Preview: Is AI Monetization Finally Catching Up to Capex?
The most pronounced difference between 2026’s tech rally compared to rallies in the past is which companies have been left out of it. The names most associated with the AI trade have hardly participat

Nvidia, CXL, and the Battle to Improve AI Inference Economics
This is Part 2 of our two-part series on AI inference economics. In Part 1 — Why Nvidia's Next AI Battle Is About Tokens per Watt, we laid out why tokens per watt has become the defining metric for in

Why Nvidia’s Next AI Battle Is About Tokens per Watt
As hyperscalers move from building AI infrastructure to monetizing it, tokens per watt helps to reflect if revenue is scaling and if profitability is improving. Offload engines can increase tokens per

Micron Is Up 900%. Here’s Why the AI Memory Trade May Still Have Room to Run
Over the past 10 months, memory chip stocks have gone from being solid beneficiaries of the AI boom to capturing a massively outsized piece of the return pie. The inflection in Micron’s performance de

Why the S&P 500 Shrugged Off the Iran War — and What Could Finally Break the Rally
On February 28th, the U.S. went to war with Iran, and the market was handed the kind of shock it hasn't contended with for years. The conflict set off a chain reaction across the region: an ongoing su
