Blogs -Tesla’s Margins: How Low Will They Go?

Tesla’s Margins: How Low Will They Go?


August 31, 2023

author

Knox Ridley

Portfolio Manager

As the I/O fund looks to position itself for the remainder of 2023. Fundamentally,  we’re avoiding ‘Crocodile Jaw’ situations where the stock price is going up but fundamentals are decelerating. This is one of the reasons we greatly reduced our Tesla position for a ~60% gain. 

Tesla stock has rallied through most of 2023 during a time when consensus was estimating sales to grow +23% y/y but earnings to decline 15%. The main driver behind the decline in earnings estimates is that Tesla has decided to lower prices to increase volumes at the expense of margins.

Starting in Q322 through Q223, operating margins have declined from 17.2% to 9.6%. Initially, Tesla cited making sure certain models qualified for the EV tax credit and later higher interest rates as the primary reasons for lowering prices.

Higher interest rates are effectively a price hike that increases monthly payments for those who finance their purchases. Tesla recently announced 84 month financing to lower monthly payments. Reducing the sales prices also helps lower monthly payments. Meanwhile, increasing EV inventory at dealerships and discounting at an industry level are likely another contributing factor.

However, the challenge of higher interest rates is not unique to Tesla. All OEMs face the same obstacles. Below are reported operating margins for the major global OEMs from Q322 through Q223. Either they were relatively stable for the Germans and Koreans or bottomed in Q123 and have improved in the case of the Japanese.

Despite this, Tesla is the one OEM whose operating margins have continued to decline.
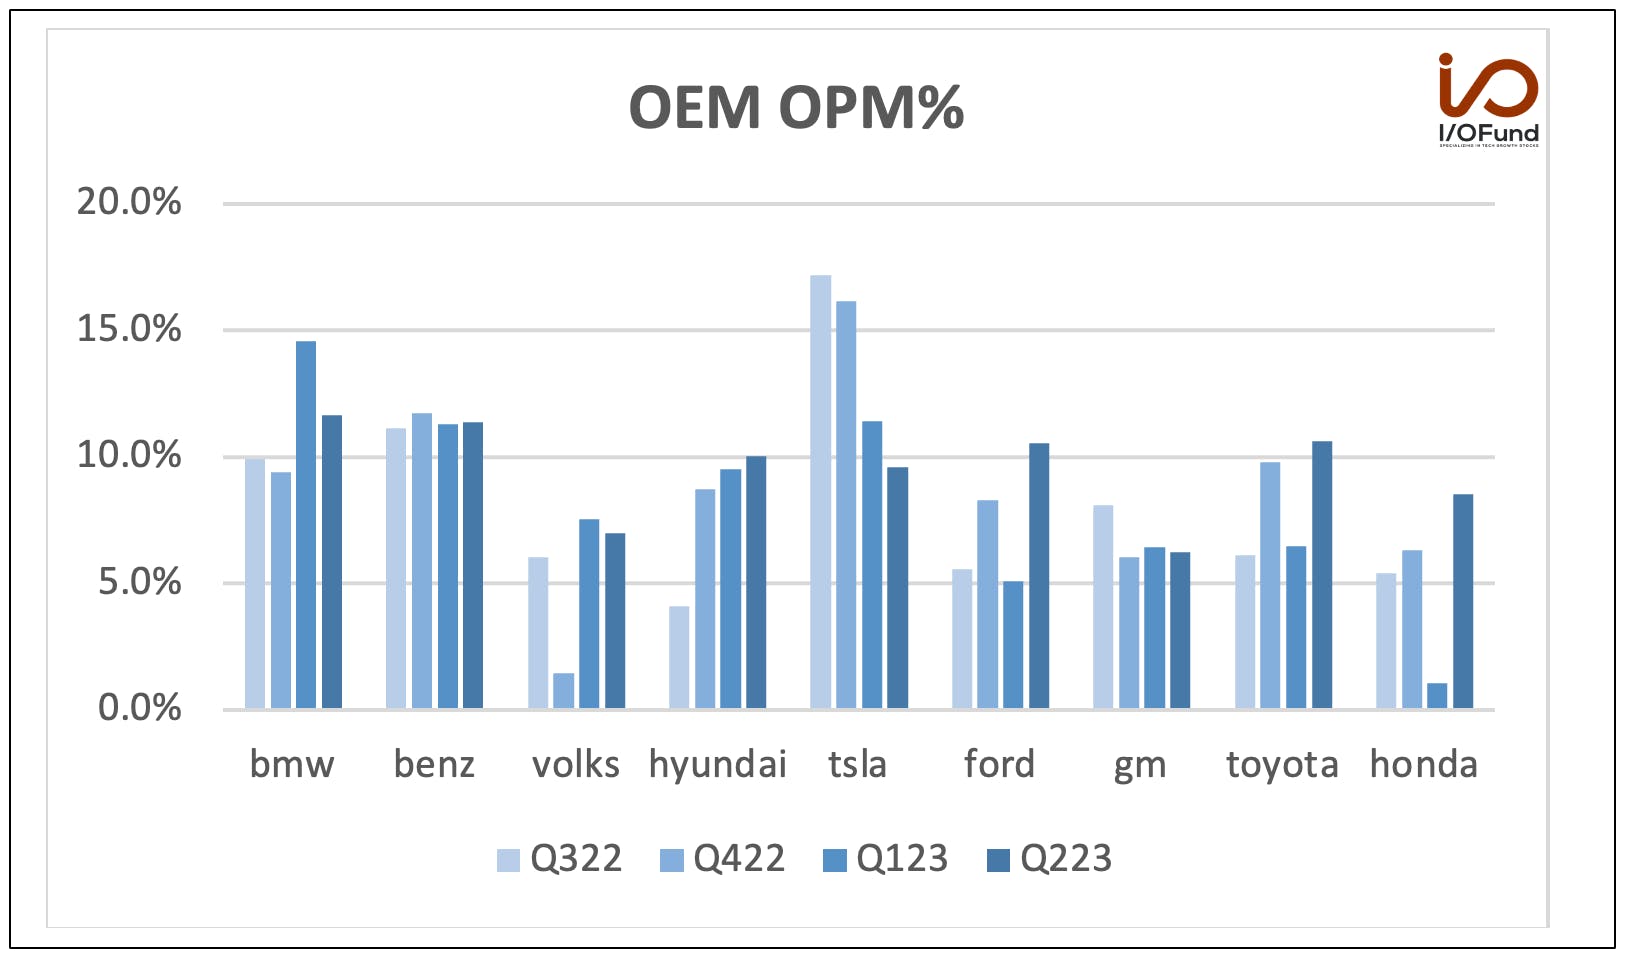
OEM operating margins graph

 Source: Y-Charts

It’s Not Just Macro

This highlights that there are other forces at work beyond the macro. We believe it points to Tesla implementing a pricing strategy to gain market share. Taking into consideration the competitive factors at work will help in trying to decipher Tesla’s pricing strategy and how that will impact operating margins for the remainder of 2023. It is through this competitive analysis framework that we will try to parameterize how low Tesla operating margins can go.

For this analysis, we chose to focus on reported group operating margins. Although this metric includes non-EV businesses, we believe it’s the most objective and public measure to provide an apples-to-apples comparison across the auto landscape globally.

At the end of Q422, Tesla's operating margin was 16%. To provide some context, at the time this was greater than the German OEMs. Tesla had firmly positioned itself in the premium segment.

The Germans have been dealing with their own challenges integrating EV offerings, and have been trying to catch-up with Tesla. Perhaps sensing its competitive moat within the premium market was fortified, this gave Tesla an impetus to lower prices further to attack the mass market segment. In Q223, Tesla’s operating margins declined to 9.6% after enacting a series of price cuts.

Currently, this is how Tesla’s operating margins compare to its main competitors. As can be seen below, Tesla’s Q223 reported operating margins are below those of most of the major US, German, Japanese and Korean OEMs.
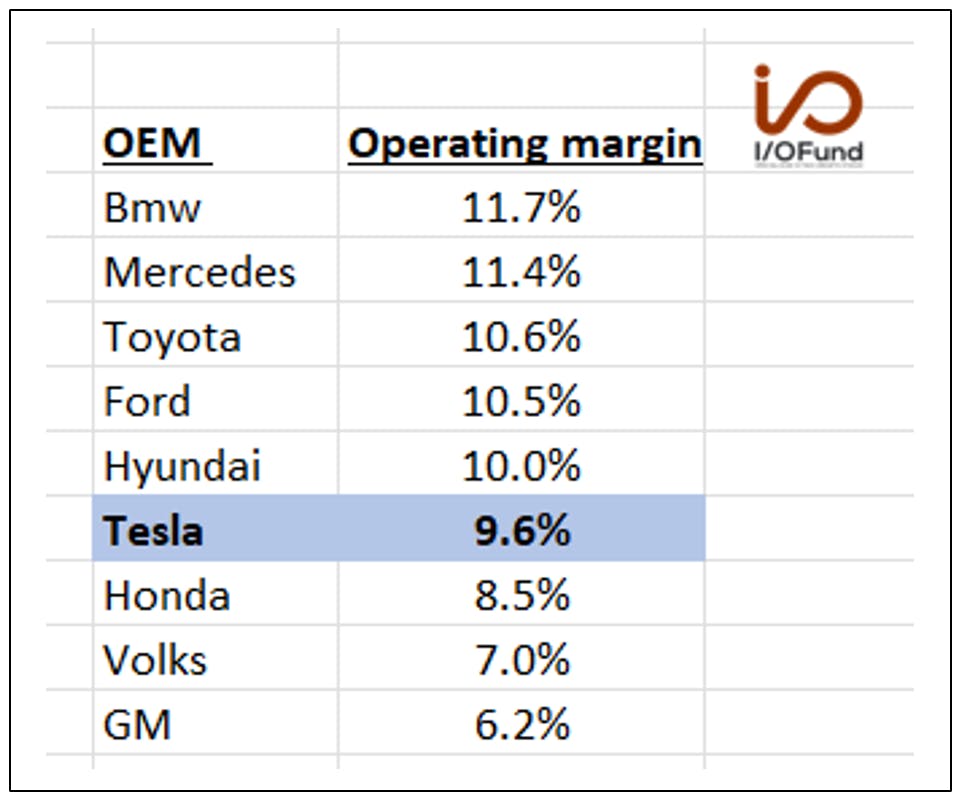
OEM operating margins

Source: Y-Charts

How Low Can Operating Margins Go?

Strategically, Tesla will likely continue to lower prices to increase its leading EV market share to stave off competition which will intensify over the next few years. Tesla’s electric market share peaked at 78% in 2018 and stood at 62% in 2022.   By 2026, Merrill Lynch estimates it will decline to 18%
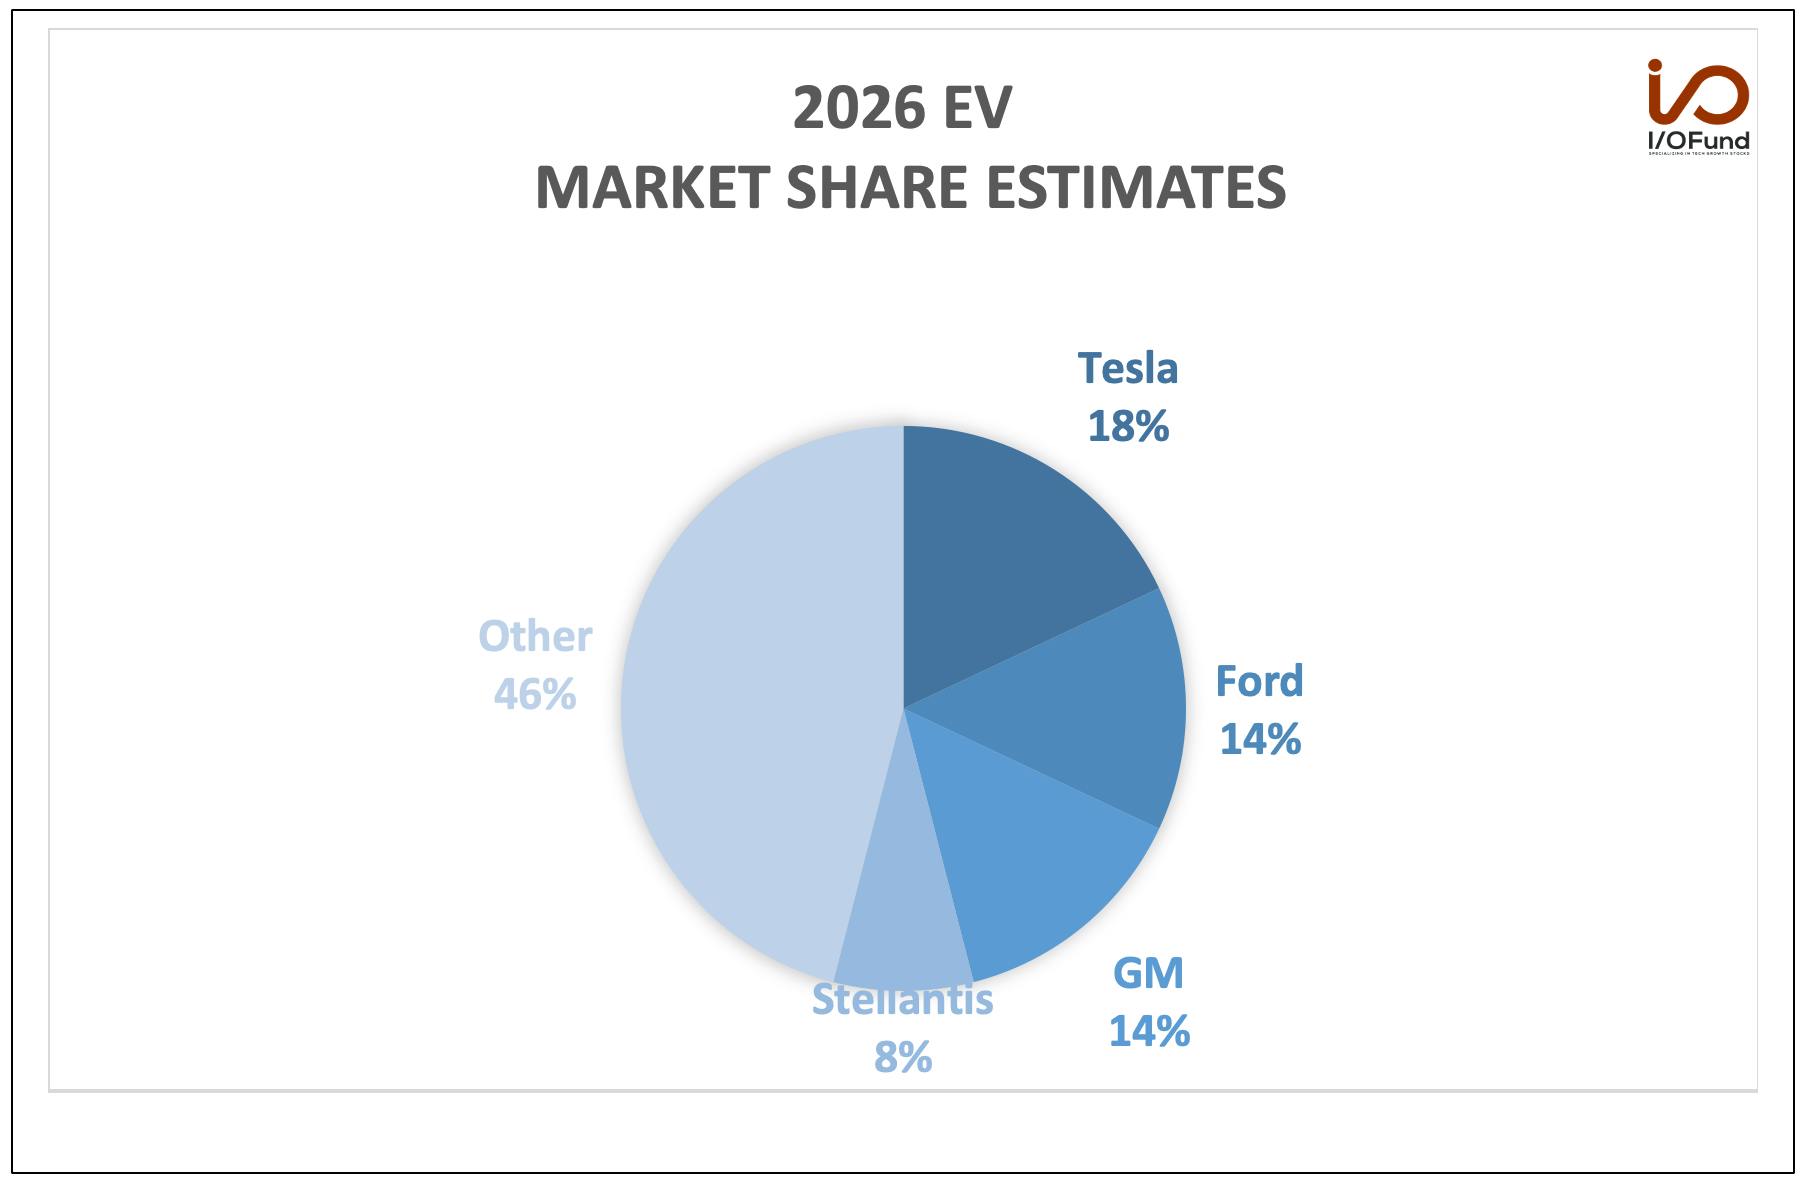
2026 EV market share estimates

Source: Merrill Lynch

In the most recent Q2 call, both Elon Musk and Zachary Kirkhorn, former CFO, signaled Tesla‘s focus will continue to be on volumes.

Musk 

“So, I think it’s sort of, it would be -- I think it -- it does make sense to sacrifice margins in favor of making more vehicles because we think in the not too distant future, they will have a dramatic valuation increase.”

Kirkhorn

“We continue to work towards our goals of maximizing volumes on our vehicle business … in a way that generates the capital to continue our pace of R&D and capital investments.”

Through this competitive analysis framework, we believe Tesla’s Q3 operating margins can decline to a level between Honda and VW. Taking the midpoint, operating margins may go to 7.8% compared to most recent 9.6%. If operating margins were to reach a level closer to -- or below GM perhaps --- that could be sign they’re close to the bottom. This highlights the broader concern for investors in that Tesla has not provided any parameters nor guidance to assess how low margins may go. It is why we significantly reduced our position.

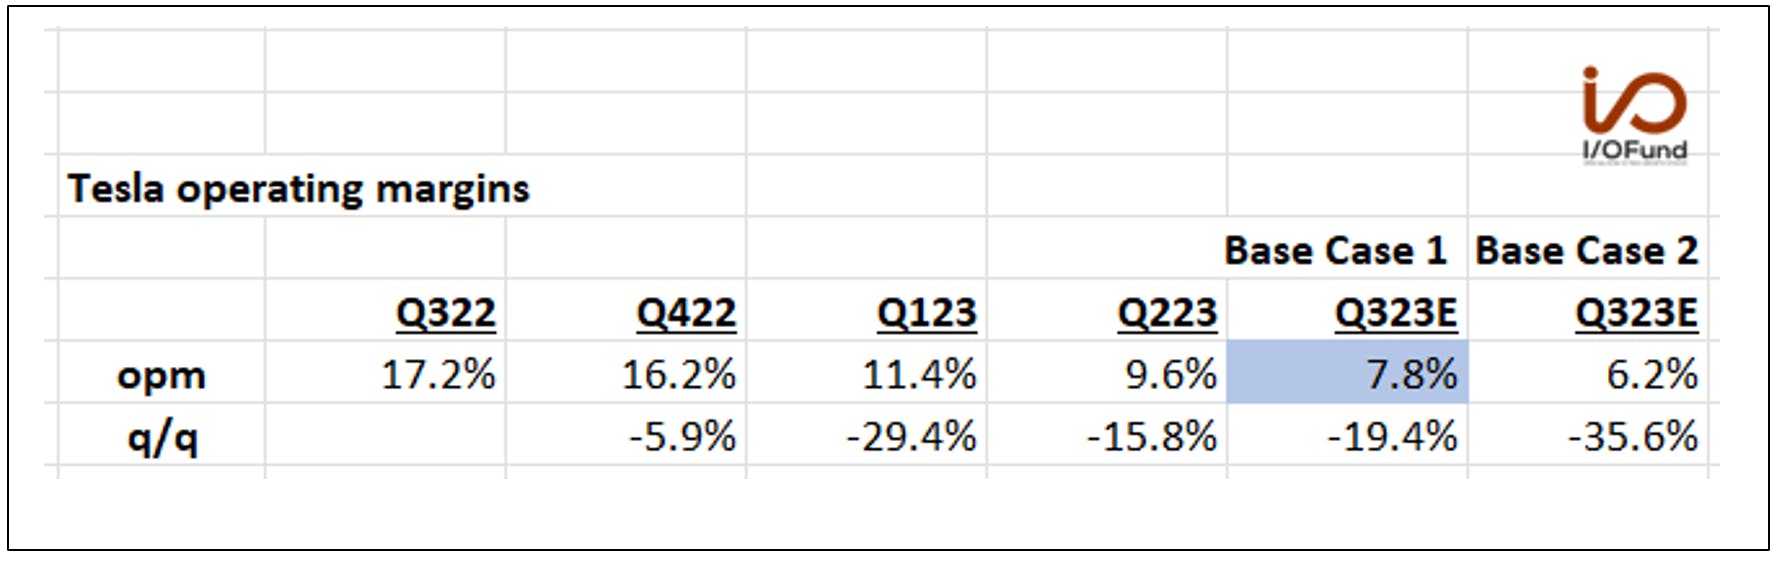
We have two base cases.

Base Case 1 is that Q3 operating margins are between Honda’s and VW at 7.8%.

Base Case 2 is more bearish in that they reach GM’s at 6.2%. For now, we believe Base Case 1 is the most likely. Consensus opm estimates are higher and consensus will have to revise down their Q3 and Q4 operating profit estimates if either case materializes.

tesla operating margins

In the medium term, there are reasons to be optimistic that Tesla’s strategic moves may bear fruit and its margins will rebound. In addition to lowering prices, the move from the CSS to Tesla’s NACS EV charging standard may help Tesla take market share away from those who have not yet announced plans to shift to NACS. Namely, Toyota and Honda who together have 25% automotive market share in the US. Meanwhile, Tesla deserves credit for maintaining its premium brand perception despite lowering prices. For now, the Tesla brand is almost synonymous with EVs. The refreshed Model 3  may further strengthen Tesla’s position in the minds of consumers.

Sign up for I/O Fund's free newsletter with gains of up to 221% - Click here

Tesla’s Price Action:

We continue to see a bifurcated market, which has been one of the leading themes in 2023. Some markets/stocks have likely put in tops, while big tech, especially those names perceived to be involved in AI, suggest another high is likely. Tesla falls into this camp, where one more high is still on the table before we have to deal with a bout of extended volatility. You can read more about our broad market analysis here.

The question for Tesla investors is whether the January low was a major low, or do we have one push lower before a major low is struck? There are some stocks, like NVDA and NFLX, for example, that will likely see similar bouts of volatility in the coming months, yet they have a high probability of making a lower high. Tesla could fall into this category.

There are two large counts that I’m tracking based on the current price information that account for these scenarios.

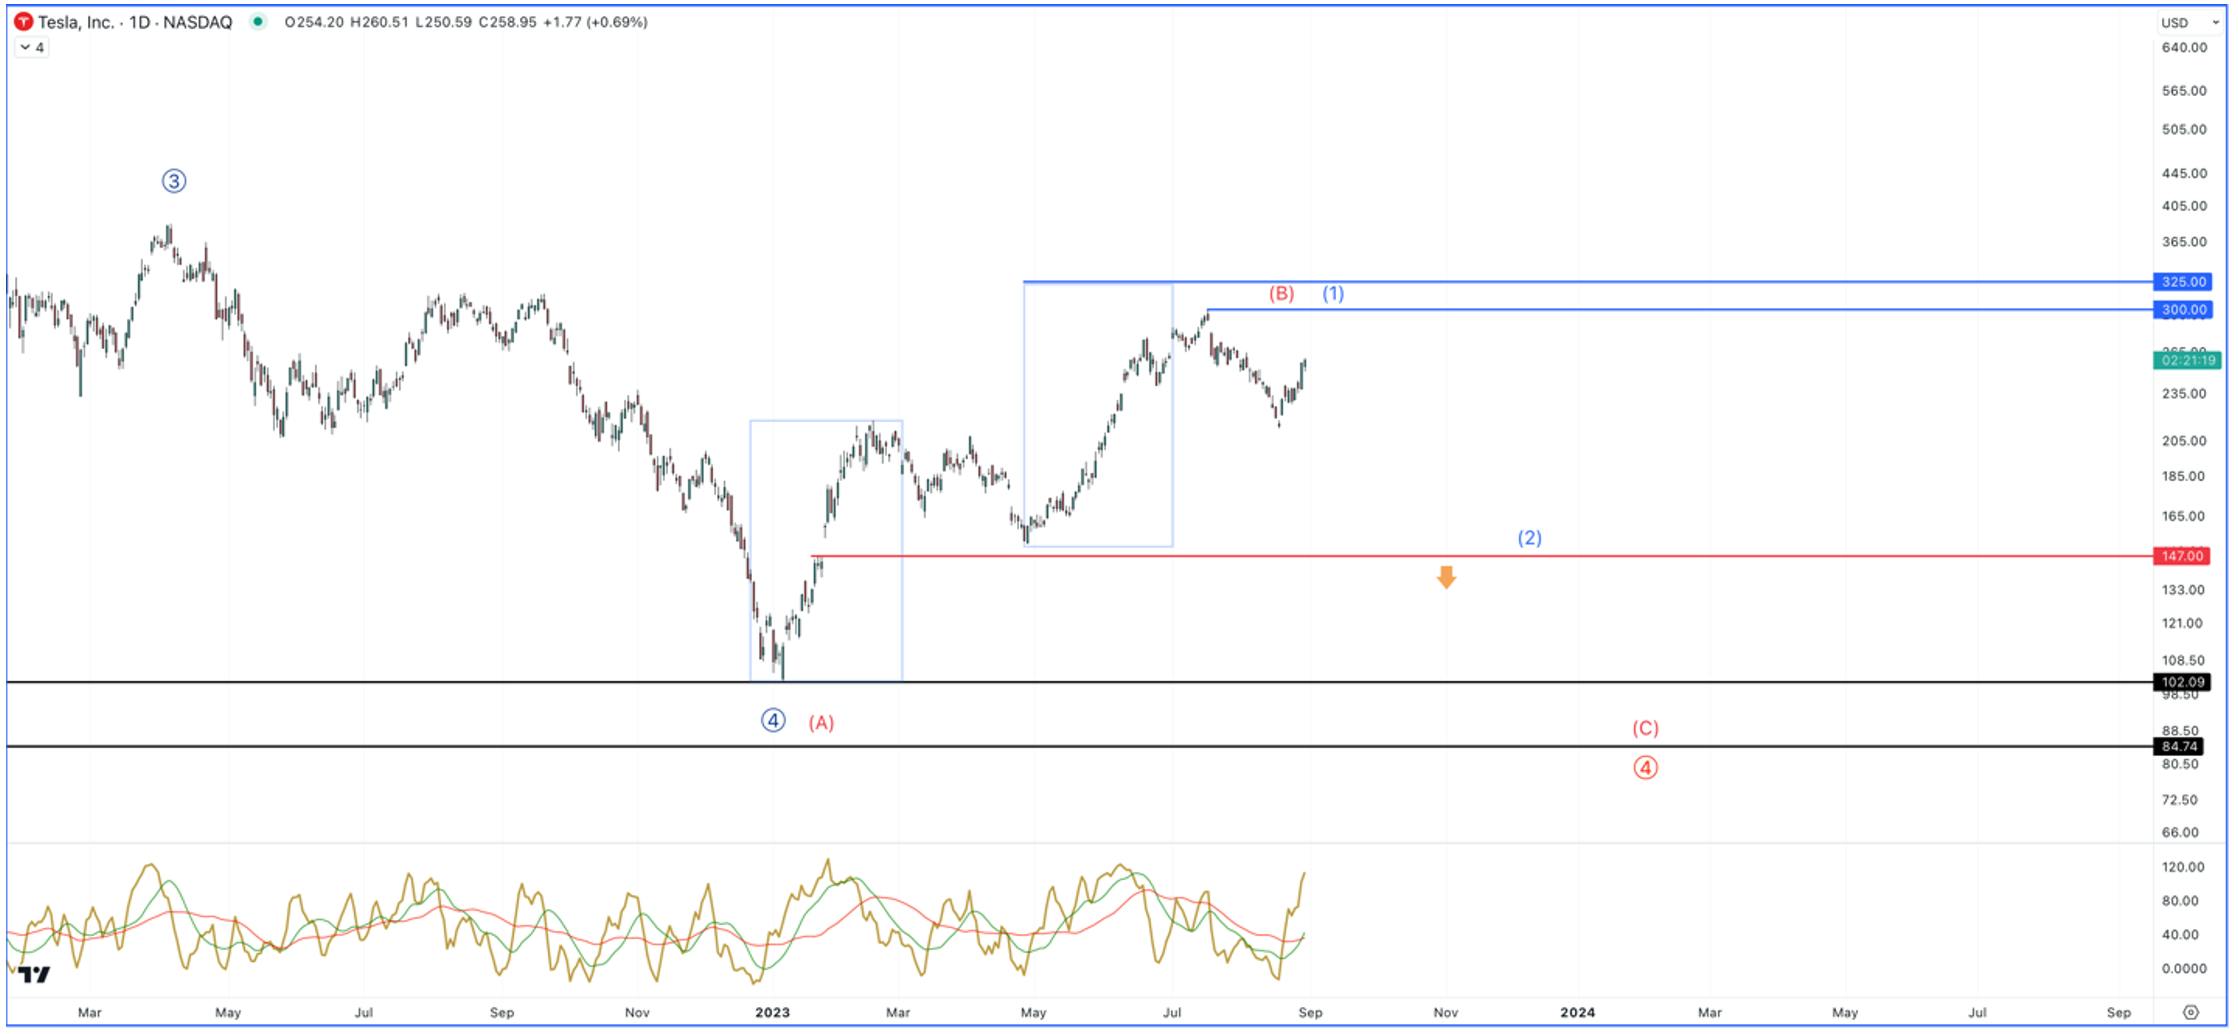
  • Blue – The big picture here has TSLA making a higher low in the coming period of volatility. The key to this count will be a large pullback that both holds $147 and is a 3-wave retrace. If this happens, it will be setting up a great buying opportunity.

    On a shorter-time horizon, TSLA has ended the topping region from $300 - $325. We could see one more swing into the $325 region. This will be very strong resistance to monitor, if we get another push. The August low around $213 will be very important. If we break below this level, then it is likely the top is in.
  • Red – on a shorter time horizon, the above analysis applies to both counts. Where this one differs will be in the pattern of the larger retrace.  Instead of a 3-wave retrace, it will have to be a 5-wave pattern that breaks below $147. If this happens, the odds will be quite high that we will see one more low before a major buying opportunity presents itself.
tesla chart

If you own Tesla stock, or are looking to own Tesla, we encourage you to attend our weekly premium webinars, held every Thursday at 4:30 pm EST. This week, we will discuss Tesla, as well as a handful of other AI plays – what our targets are, where we plan to buy as well as take gains.

Recommended Readings:

head bg

More To Explore

Newsletter

Abstract illustration of layered AI computing hardware processing digital tokens, symbols, and data streams representing AI infrastructure and inference demand growth.

Token Growth is Surging - Here Are the Beneficiaries 

The reality of AI demand growth has shattered early estimates for token processing, yet expectations continue moving up and to the right. In the second installment of our token processing series, we e

July 31, 2026
Abstract visualization of a flowing stream of digital tokens, numbers, and symbols representing AI token processing and inference demand growth.

AI Token Demand is Shattering Forecasts 

Total annual token processing is no longer measured in billions or trillions of tokens, but in the quadrillions and beyond. As annual token processing is now tracked in units with 15 trailing zeros, i

July 30, 2026
TSMC N3 wafer technology connected to Intel EMIB advanced packaging in an AI semiconductor manufacturing graphic.

Nvidia and Google Are Crowding TSMC’s N3 Node - Can Intel Fill the Gap?

Nvidia is moving its next-generation Rubin GPUs from 4nm to 3nm, yet Google’s latest TPUs are already on N3 and are expected to remain there. Meanwhile, a growing number of AI CPUs from Nvidia, Amazon

July 26, 2026
Illustration of Intel EMIB-T advanced packaging connecting AI compute dies and HBM memory as an alternative to TSMC CoWoS.

Intel vs TSMC: How CoWoS Packaging Constraints Could Create an Opportunity for Intel Foundry 

Taiwan Semiconductor (TSMC) is the single, most important company to the AI industry. However, to compete with the incumbent, Intel does not need to beat TSMC at leading-edge manufacturing. It only ne

July 24, 2026
Amazon, Meta, Microsoft, and Google displayed with financial charts, illustrating rising AI capex and growing free cash flow pressure across Big Tech.

Big Tech’s Free Cash Flow is Turning Negative – Who's Next? 

Big Tech’s AI revenue is accelerating, but free cash flow is moving sharply in the opposite direction. Across Google, Microsoft, Meta and Amazon, capex is rising much faster than operating cash flow a

July 19, 2026
Illustration of Google, Microsoft, Meta, and Amazon stock dashboards against a digital circuit-board background, symbolizing Big Tech earnings, AI growth, and investor performance.

Big Tech Earnings Preview: Is AI Monetization Finally Catching Up to Capex?

The most pronounced difference between 2026’s tech rally compared to rallies in the past is which companies have been left out of it. The names most associated with the AI trade have hardly participat

July 17, 2026
Side-by-side image of an NVIDIA CMX server and a CXL memory expansion card against a data center background.

Nvidia, CXL, and the Battle to Improve AI Inference Economics

This is Part 2 of our two-part series on AI inference economics. In Part 1 — Why Nvidia's Next AI Battle Is About Tokens per Watt, we laid out why tokens per watt has become the defining metric for in

July 12, 2026
NVIDIA BlueField networking platform card shown on a green digital network background.

Why Nvidia’s Next AI Battle Is About Tokens per Watt 

As hyperscalers move from building AI infrastructure to monetizing it, tokens per watt helps to reflect if revenue is scaling and if profitability is improving. Offload engines can increase tokens per

July 10, 2026
Micron HBM3E chip with glowing data streams representing AI memory demand and high-bandwidth memory technology

Micron Is Up 900%. Here’s Why the AI Memory Trade May Still Have Room to Run

Over the past 10 months, memory chip stocks have gone from being solid beneficiaries of the AI boom to capturing a massively outsized piece of the return pie. The inflection in Micron’s performance de

June 26, 2026
Fighter jets flying over a city with smoke rising, overlaid by a rising S&P 500 chart, illustrating markets climbing despite the Iran war.

Why the S&P 500 Shrugged Off the Iran War — and What Could Finally Break the Rally 

On February 28th, the U.S. went to war with Iran, and the market was handed the kind of shock it hasn't contended with for years. The conflict set off a chain reaction across the region: an ongoing su

June 19, 2026
newsletter

Sign up for Analysis on
the Best Tech Stocks


Copyright © 2010 - 2026