Broad Market Update: The FED versus Inflation
September 30, 2022

Knox Ridley
Portfolio Manager
Given the extreme FED action this year that has gnarled the stock market, I think it’s important for investors to look at how we got here to draw conclusions on what may be coming down the line. For brevity, we begin the discussion dating back one year.
In September of 2021, the FOMC decided to keep the Fed Funds rate at 0% and continue their asset purchasing at a regular interval, maintaining a loose policy as a result of the COVID panic. They reiterated rapid growth of the economy into 2022, while most members saw no need for a rate hike in 2022. Some members disagreed that a new tightening cycle would need to be started in 2022, but it was believed that it could be at a slow and tapered pace.
Interestingly, real-time market data related to inflation was flashing signs that inflation was becoming a concern. Here are some examples of data points that contradicted the FOMC’s policy decision at the time:
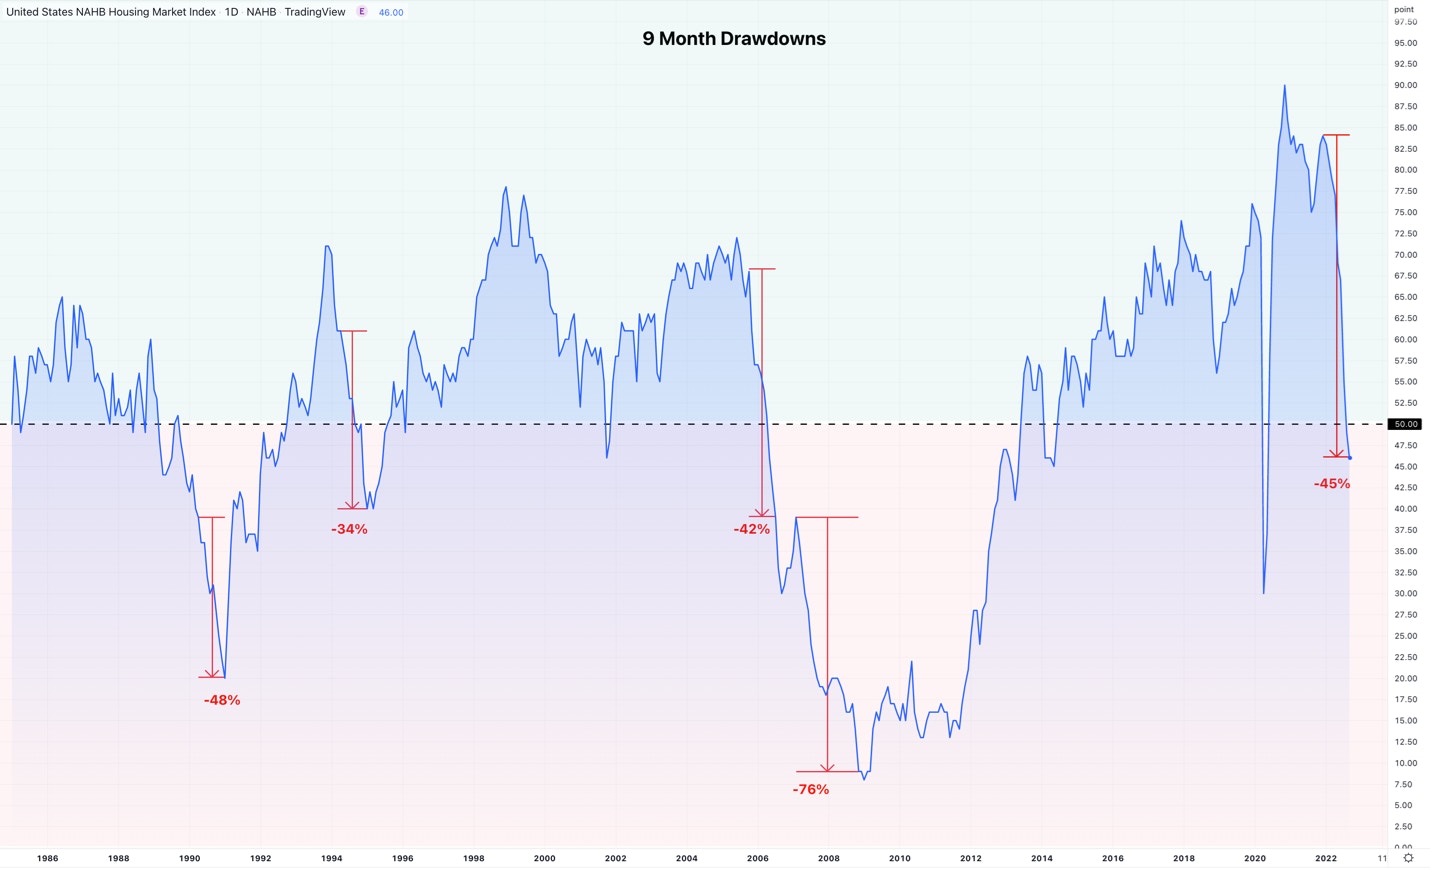
- The NAHB Index, which tracks the sentiment within the home builder’s sector, saw a 160% increase from the COVID low into the September meeting.
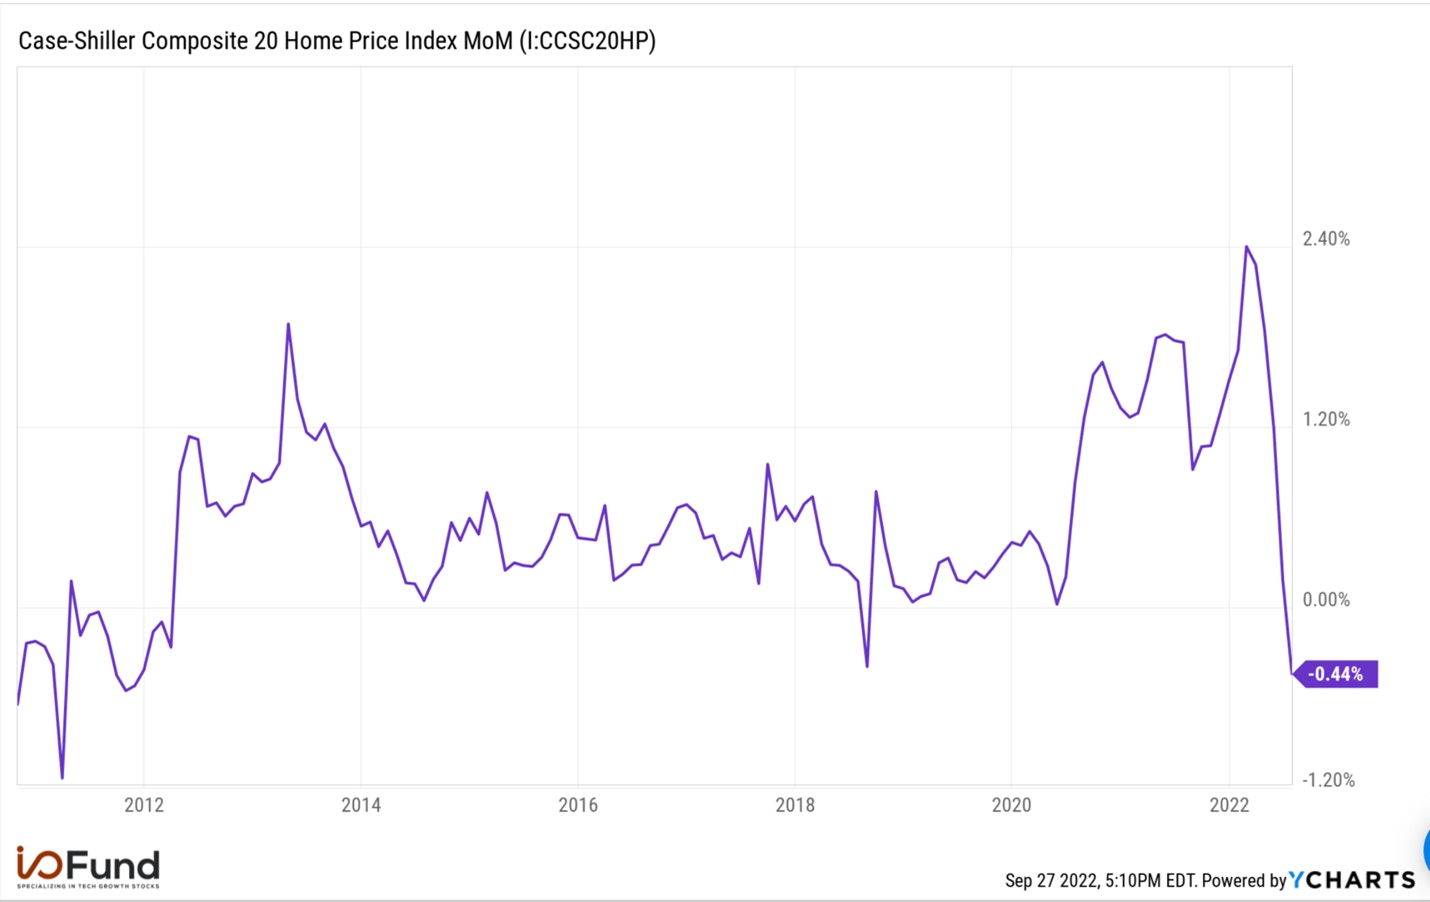
- The Case-Shiller Home Price Index was showing a ~25% increase in nation-wide home prices. It further showed the highest YoY reading in its history in July with a greater than 20% increase.
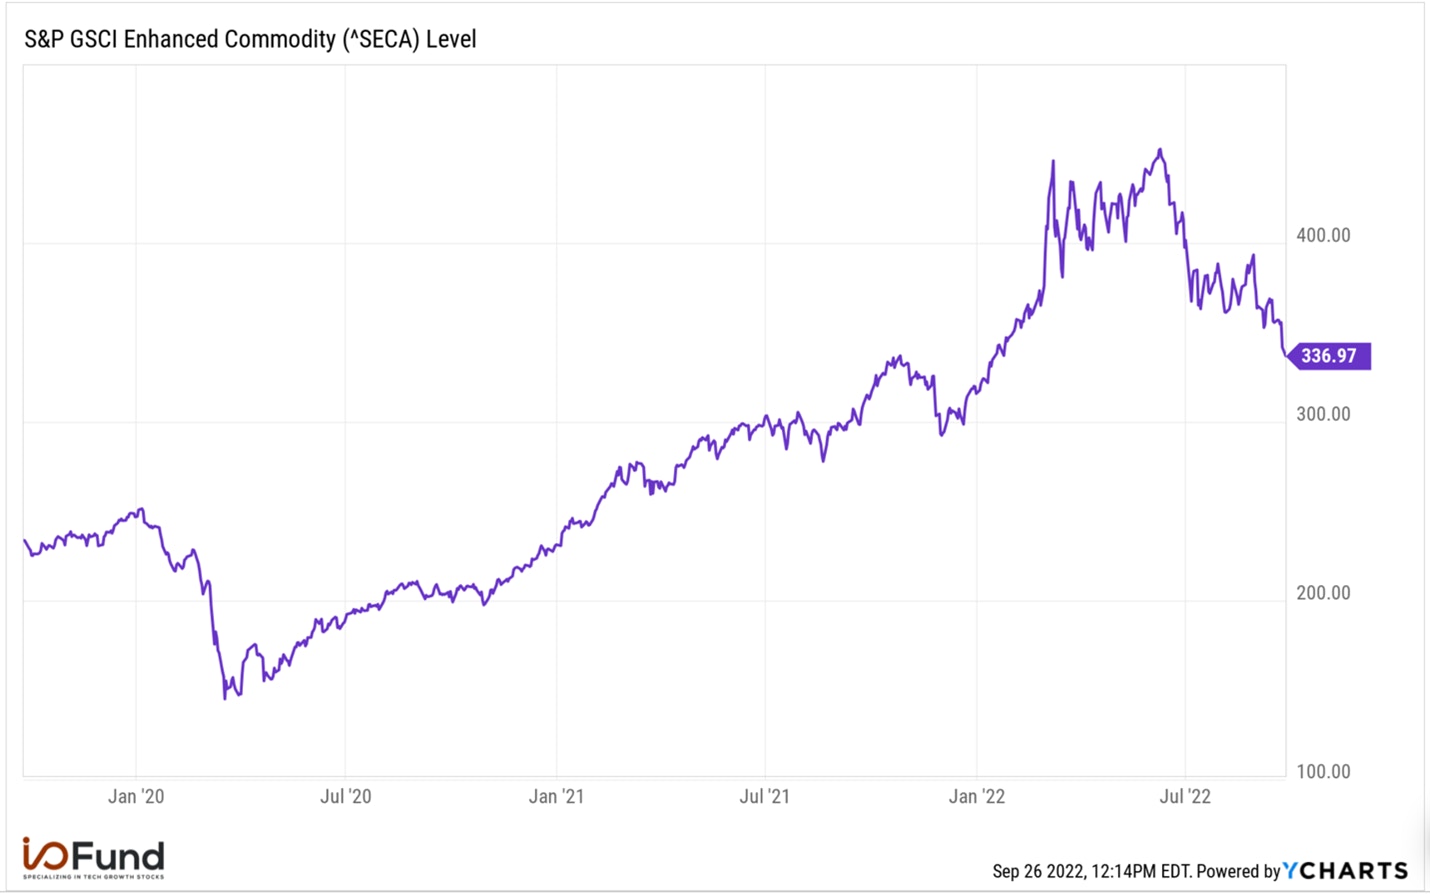
- The Bloomberg Commodity Index was up 64% since the COVID low into that September, 2021 meeting. This was the highest reading since July of 2015, and also marked one of the steepest increases in terms of rate of change in the Index’s history.
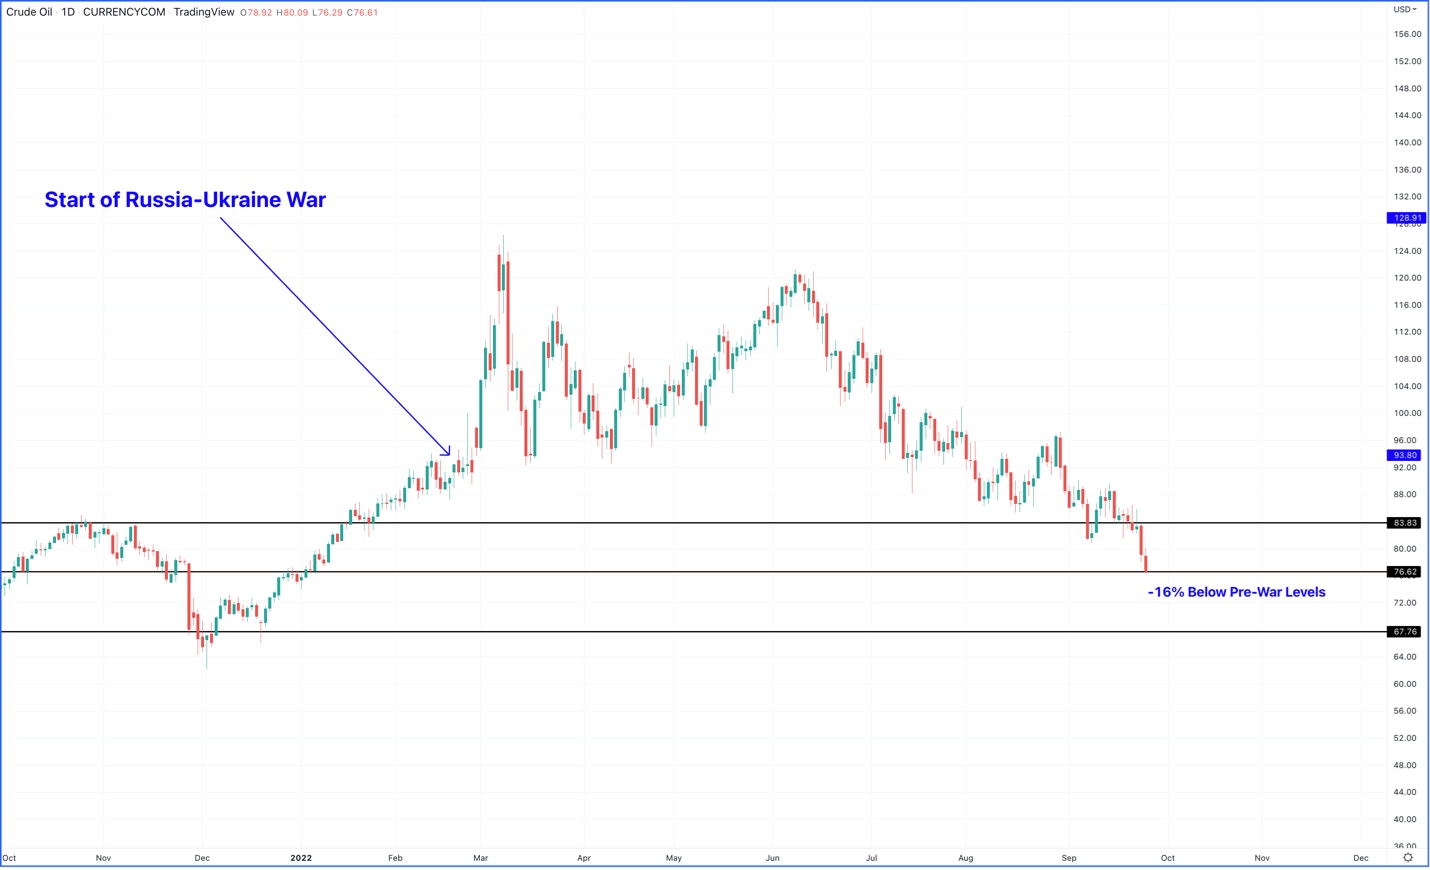
- Crude oil was up 47% in 2021, going into the meeting. It was also well above the pre-COVID levels.
- The M2 Money Supply was up around 35% since the COVID low going into the September meeting. The M2 layer of the money supply measures the amount of liquid cash in the system, and historically accounts for inflation within an economy.
- The S&P 500 was up over 100% from the COVID low going into late September of 2021.
Even the monthly CPI data, which has a built-in lag to some of its metrics, was suggesting inflation was becoming a problem. In February of 2021, the YoY CPI print came in at 1.62%; one month later, it read 2.62%. In September of 2021, it was at 5.3%.
So, what happened, and how could a team of the brightest PHDs, Bankers and Financiers that makes up the Federal Open Market Committee (popularly known as the FED) miss the inflation signals and raise rates so late in the cycle?
The standard policy for central banks is that at the first sign of inflation, they begin a slow and steady pace of rate hikes. For example, in 2004, the FED began their tightening cycle once the YoY CPI print exceeded 3%; in 1999, they began to slowly tighten once it moved above 2%. Even the current Fed Chair, Jerome Powell, started hiking rates in 2017 with inflation around 1%.
In our August webinar, ”This is Still a Warning Sign,” we warned that market risk was high, and that a sharp pullback was ahead. I also mentioned the market was setting up for a reversal going into the CPI print in September, here. Follow me on YouTube here or sign up for the I/O Fund free newsletter to be emailed the weekly webinar.
Despite the numerous market indicators pointing towards growing inflation pressures in September of 2021, the FOMC ignored the signs, and instead continue to press their loose monetary policies. They ultimately waited a year after inflation showed up to begin addressing it, putting them much farther behind the curve than investors are used to.
Just over one month after the September 2021 meeting, the FOMC was forced to reverse course. Marking the second sudden policy shift in Jerome Powell’s tenure. As we now know, inflation was not transitory, forcing the FOMC to embark on the steepest rate hike campaign since Paul Volker raised the Fed Funds rate to 20% from a 3-year average of 11.2%.
Rather than engineer a soft landing, the FED did the opposite by raising rates a year too late. What resulted was an aggressive increase and the worst stock market on record in nearly 50 years.
One year later – Inflation is Down, the FED is Up
Fast Forward one year into the recent September, 2022, FOMC meeting, and the same indicators were clearly showing a notable reduction with inflation…
1) Commodities have collapsed, and continue to push lower. Copper prices are down ~30% from their high, while lumber prices have fallen back to pre-COVID levels. Most importantly, Crude Oil is about 16% below its pre-Russia/Ukraine war level, as gas prices declined every day? for 98 consecutive days.

2) Sales of existing homes in August declined 19.9% from August 2021. Furthermore, the Case-Shiller home Price Index showed the largest MoM decline in home prices since 2011.

3) The National Association of Home Builders (NAHB) Index fell for 9 consecutive months and is now below the 50. Anything below 50 is a contraction. The president of the NAHB, Jerry Howard, went as far to state that “we’ve given birth to a housing recession.”
The last time we saw the NAHB Index below 50 was briefly around the COVID low and then again in 2014. In fact, the last 9 months saw the 3rd steepest % decline in the NAHB Index since 1990.
4) The M2 money supply is one of the most important indicators of inflation, and is the layer of the money supply that tracks liquid money in bank deposits, CDs, Mutual Funds, etc. In other words, the money that is ready to be used in an economy. After seeing a 35% increase post-COVID, since February of 2022, the M2 money supply has been negative to flat.
Ultimately, inflation is a monetary phenomenon. The more money in the system chasing the same goods, inherently means goods will increase in price. Following the M2 money supply is the most effective way to track if inflation is growing or shrinking.

The list can be extended into Producer Price Indexes and Manufacturing Costs consistently surprising to the downside. Inflation data does not have a lag built into its calculations, and looks at real-time market information, is signaling a noticeable change in trend with inflation pressures. Yet, just like in 2021, the FOMC appears to have a disconnect between inflation and its policy, except in the opposite direction.
The market was expecting a 0.75% rate hike this round, which it got. What it was not expecting was for the FOMC to raise its target rate, extend the duration for rate cuts, and claim that inflation is still out of control. They further spooked the market by stating that more pain would be needed to bring inflation back to its 2% target. This was backed by lowering their economic growth forecasts for this year, down to 0.2% from 1.7% in 2022, and 1.2% from 1.7% for 2023.
This meeting caught the market by surprise, triggering a sell-off that has pushed the S&P 500 to new lows in just under 2 weeks. I provide weekly webinars that discuss what I/O Fund is buying and selling. We also have a proprietary hedging signal that we monitor in real-time. Following the free analysis, Why The Next 2 Weeks Could Determine The Rest Of 2022 we hedged going into the CPI number for a nice gain in a tough market. That analysis dated September 8th stated:
“Historically, this grid tends to accompany the C wave down in a bear market. However, in 2022, the market exhibited a sell-now-and-ask-questions-later mentality, as we saw the S&P 500 decline by 24% and the NASDAQ-100 decline 34% over a 5.5 month period. These are rare moves, and one has to wonder if the worst is priced in – including the global slowdown in growth? I do believe it’s cavalier to assume that at this point, and prefer to let the broad market prove it to me over the coming month. We will remain cautious until then, and respect the Big Risk-Off grid that we are now in.
If we have, in fact, found a meaningful low, we would not only need to see the S&P 500 give us that 5th wave up, but we would also need to see rates, the USD and oil move down or sideways. Bull markets do not happen in vacuums and tend to be supported by various markets firing in unison. As of today, this confluence of inter-market dynamics is not supporting a direct uptrend in equities.”
Just like in the September of 2021 meeting, the FED appears to be ignoring market signals about inflation. By ignoring the real-time market data regarding inflation, the markets will once again force their hand, as it always does. The only question remains is what will have to break before they flinch? As stated, we believe it is prudent to wait for the clear reversal before getting too aggressive in equities. This is why our service has hedged the majority of September with real-time trade alerts sent to our Members.
SPX Levels to Watch
The S&P 500 is tracing out what appears to be a 3-wave pattern down from the August high. This is important, because it is not suggesting an immediate breakdown from current levels. Instead, we are seeing extreme oversold conditions that tend to lead to a short-term bounce, at minimum.

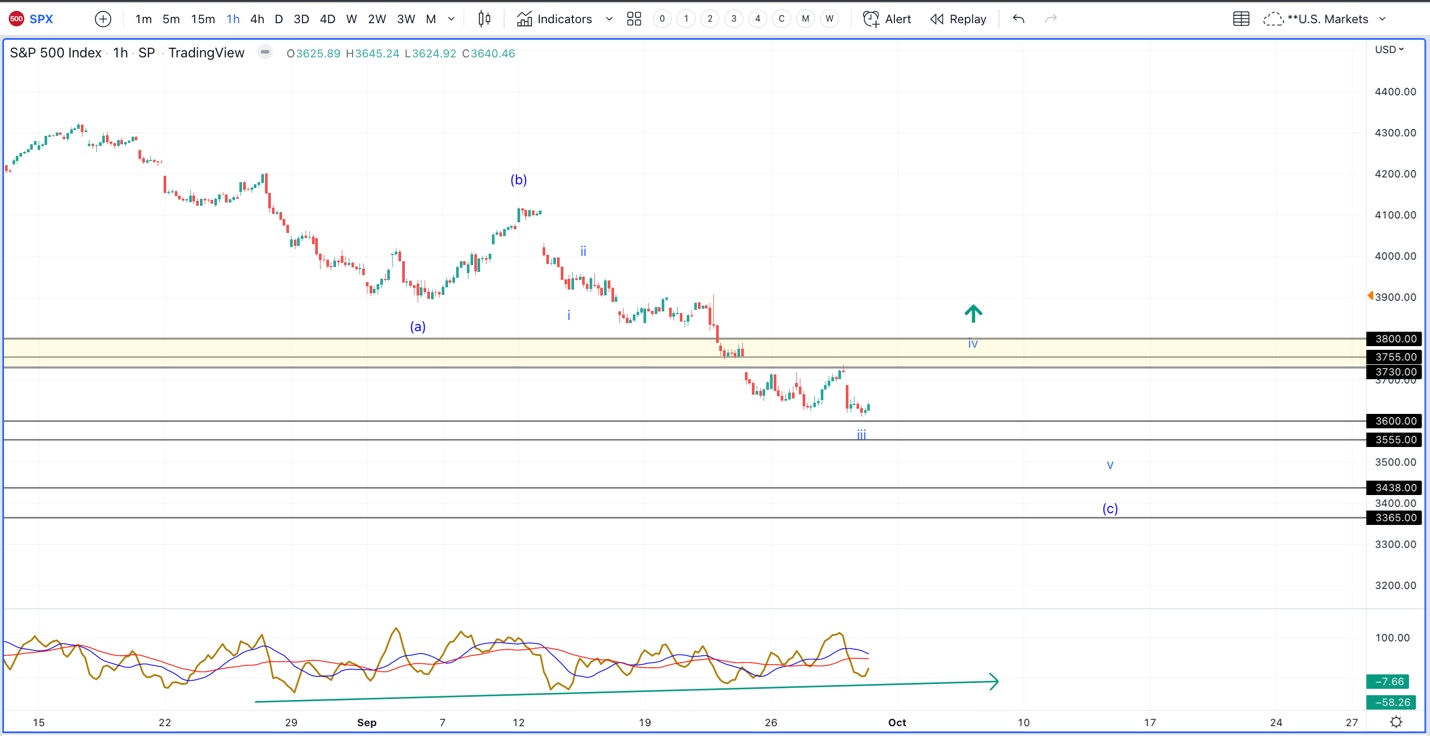
If the coming bounce can break above 3800, then a major low is likely developing. However, once SPX pushes into 3730, the risk will be elevated, as the above structure does not look complete until we get at least into the 3550 range.
To further support a bounce, today we saw the broad market make a new low; however, it did so with notable divergences. For one, the VIX did not make a new high, which tends to precede a turn. The market also went down with less stocks making new lows than last week’s low. This was met with the Advance Decline line also not making a new low with price. These are common signs we see prior to a turn.
On the I/O Fund premium site, I provide weekly webinars that discuss what the I/O Fund is buying and selling. We also have a proprietary hedging signal that we monitor in real-time. Following the analysis I provided for free on YouTube last month “This is Still a Warning Sign” and also in this article “Why the Next Two Weeks Could Determine 2022” we hedged going into the CPI number for a nice gain in a tough market and have had a hedge in place most of September.
The next premium webinar will be on Thursday, October 6th at 4:00 pm Eastern where I will discuss how I plan to trade the broad market signals discussed in this article plus new information on an important time factor in mid-October which I believe is lining up with the Q3 earnings season. Learn more about Premium I/O Fund Services here.
Please note: The I/O Fund conducts research and draws conclusions for the Fund’s positions. We then share that information with our readers. This is not a guarantee of a stock’s performance. Please consult your personal financial advisor before buying any stock in the companies mentioned in this analysis.


More To Explore
Newsletter

Nvidia, CXL, and the Battle to Improve AI Inference Economics
This is Part 2 of our two-part series on AI inference economics. In Part 1 — Why Nvidia's Next AI Battle Is About Tokens per Watt, we laid out why tokens per watt has become the defining metric for in

Why Nvidia’s Next AI Battle Is About Tokens per Watt
As hyperscalers move from building AI infrastructure to monetizing it, tokens per watt helps to reflect if revenue is scaling and if profitability is improving. Offload engines can increase tokens per

Micron Is Up 900%. Here’s Why the AI Memory Trade May Still Have Room to Run
Over the past 10 months, memory chip stocks have gone from being solid beneficiaries of the AI boom to capturing a massively outsized piece of the return pie. The inflection in Micron’s performance de
Why the S&P 500 Shrugged Off the Iran War — and What Could Finally Break the Rally
On February 28th, the U.S. went to war with Iran, and the market was handed the kind of shock it hasn't contended with for years. The conflict set off a chain reaction across the region: an ongoing su
Nvidia, CoreWeave, and Nebius: Inside the Circular Financing of the GPU Boom
Neoclouds are one of the more hotly debated AI business models, with CoreWeave and Nebius being the two most widely recognized names. These companies have seen their sales, backlog, and share prices s
AMD, Nvidia, Arm, Intel: Inside the $120 Billion CPU Gold Rush
CPUs have gone from an afterthought to becoming the AI trade’s next great bottleneck – and with AMD, Nvidia, Arm and Intel circling a market that is doubling nearly overnight, the only question left i

Google TPU v8 vs Nvidia: How Inference Is Rewriting the AI Market
In April, Google announced it would begin selling its TPUs to select third-party data center operators, which is something the market has anticipated for nearly a decade. The TPU-versus-Nvidia-GPU deb

The AI Networking Stock That Beat Nvidia by 7X YTD for Returns of 135% YTD
AI networking stock Lumentum is among the key I/O Fund winners in 2026. We allocated heavily to LITE in January—a month before Nvidia backed the company. While most investors couldn’t stomach taking a

Bloom Energy — Our 2026 Top Pick Was the Best Performing Stock in April
April was the best month in six years for the Nasdaq-100. The single best-performing large-cap stock wasn't Nvidia, Microsoft, or Meta. It was Bloom Energy, up roughly 109% in one month. As you'll rec

Inside Nvidia’s $4B Optical Strategy—and Why CPO Changes Everything
Within the AI investment theme, there is nowhere that the supply chain shifts faster than in networking, leading companies to gain content on new platforms or lose incremental share. The reason is str
