Apple's Stock Price is at Inflection Point
November 09, 2019

Knox Ridley
Portfolio Manager
As Apple’s stock price powers to new highs, returning over 60% YTD and touting the highest market cap in history, now might be a good time for investors to reflect as Apple trades at resistance. With upwards of $260 billion in revenue, a profit margin of 22%, Apple is a cash-generating machine. It produces around $50-$60 billion in free cash flow annually, with reserves of over $100 billion. It is extremely kind to shareholders, with one of the largest buyback programs on the Street. In fact, Apple has spent around $120 billion in stock buybacks since the beginning of 2018, and kicks out a dividend. Apple is, without question, one of the greatest businesses the world has ever seen.
However, there are times where great businesses do not always make great stocks at times. If we look at the current valuations, Apple’s stock price is trading with a P/S of 4.5, a P/E ratio of around 25 and a price to free cash flow of 20, as of the writing of this report. While these valuations are relatively mild compared to some of the valuations being shopped around in the tech industry, for a company with a market cap of $1.3 Trillion, these valuations suggest future growth in order to justify current prices. It is here, with their future growth prospects that I see caution.
Apple’s Stock Price is Up While Revenue is Down
In 2019, the company had revenue of $260 billion, down from $265 billion in the previous year. Analysts originally expected the company’s revenue to grow to $274 billion, or 5.3% this fiscal year, and around $294 billion or 7% in the following fiscal year. This will be slightly below the 7.2% growth that is expected among information technology stocks.
In the latest quarter, its growth rate was just 1.8%, significantly lower than what other FAANG companies reported. Facebook revenue grew by 28% while Amazon rose by 23%. Netflix and Google had revenue growth of 31% and 20%, respectively. Even Cisco grew by almost 5%. And for further comparison, the US economy expanded by 1.9%.
Apple’s poor growth would have tanked any technology stock, yet Apple’s stock price is up 60%. Though I believe Apple has the cash as well as the capability to pull numerous pivots in its future, the loss in revenue will likely accelerate before these pivots can manifest, which will compress margins, and thus affect current valuations.
iPhone Saturation – Will it Affect Stock Price?
If we dig deeper into their latest revenue report, we discover that smartphone sales declined YoY by 15%. Saturation is an inevitable phenomenon for revolutionary inventions. For example, Utilities and wireless phone coverage were once considered hyper growth sectors at one point in time, but the inevitable saturation took hold, leading these companies to now be considered defensive value plays. Saturation appears to be taking hold in the smartphone market, which is why we are seeing a deceleration in smartphone sales YoY; with an expected 2% fewer sales per year going forward.
Furthermore, with saturation, we see manufacturers start to slash prices to capture fewer units sold. This quarter, Apple reported that iPhone sales declined by 9% since the previous year and that they are also reducing the price of their new iPhone 11. Both news items point to the reality of market saturation.
The iPhone is arguably the greatest tech driver in history, as well as Apple’s primary source of revenue. So, Apple will have to cover the losses with their other products to make up the difference. This is where I see the inconsistency between the stock’s valuations and their current offerings.
Services
Apple’s services generate revenue through various subscription fees. These fees come from several well-known Apple services, including iCloud, iTunes, Apple Music and various types of apps.
Although these services grew by 18% this last quarter, the total revenue generated was only 37% the size of iPhone sales. This level of growth is simply not enough to cover decreasing revenues from Apple’s iPhone sales.
Furthermore, there are also concerns in the service sector. The problem is that the services that Apple offers have relatively lower margins than the iPhone. A good example of this is Apple Music. Apple doesn’t disclose Apple Music’s gross margins, but going by Spotify’s own margins, we have every reason to believe that Apple is similar. Spotify’s gross margin is just 26%, which is smaller than Apple’s iPhone net profit margin. It’s important to note that the services segment of Apple is tied to the iPhone and may experience slower growth as the smartphone market continues to saturate.
Apple +
There’s also a lot of hype around Apple TV+’s potential at filling the growth gap. According to the Wall Street Journal, Apple is spending more than $6 billion on new content, and it’s only likely to go up as the streaming war continues.
At current prices for the service, it’s impossible for Apple to make a profit even with a hundred million subscribers. Apple can still be a contender in this crowded space, but it will likely take time, and be more of a cash drain than a generator in the short-term. Meanwhile, smartphone saturation is only going to continue, which means that Apple TV+ will not be able to solve Apple’s current revenue problems.
Apple Pay
Apple Pay is another service that Tim Cook talks about repeatedly. During the latest earnings call, he revealed that the service had surpassed PayPal in terms of volume of transactions. The service is also expanding into various markets. Additionally, Cook also praised Apple Card, a new product developed in collaboration with Goldman Sachs that promises to expand Apple’s revenue.
Apple Pay has the potential to generate a large cash flow, but there are questions about how big it can get. In the trailing twelve months, PayPal had a gross revenue of $17 billion and a net income of $2.53 billion. Visa and Mastercard had a combined revenue of $38 billion and a net income of $17 billion. So even if Apple were to dominate this market, its consolidated net income will not be sufficient to cover the loss in iphone sales. And, more importantly, it will take time to take market share, which will not solve the revenue issues Apple currently faces.
Apple Wearables
Another area that’s worth looking at are Apple wearables. In the last quarter, revenue from wearables, home and accessories rose by 54% to $6.5 billion. This growth was driven by the success of various Apple products, particularly Apple Watch, Airpods, and BIS products.
These wearables are great products that do have higher margins, just like the iPhone. The big question, however, is if they can grow fast enough to offset losses in iPhone sales. Despite its great performance, Apple’s wearables, home and accessories business is still behind the Mac division, which earned $6.9 billion during the fiscal fourth quarter.
Meanwhile, Apple’s iPhones generated $33.36 billion in revenue this final fiscal quarter, despite a 9% decrease year on year. So the important point in all this is that, despite their tremendous growth, Apple wearables and accessories are just not in the same league as iPhones.
Buybacks and Apple’s Stock Price
Any other tech company with decelerating revenue, and the likelihood of continued deceleration in the near term, while facing an end of cycle environment that will eventually affect the consumer, would not see their share price increase to such valuations. So, it’s worth noting the importance of one of Apple’s key components in their current strategy, which is not a permanent solution.
Apple has turned to buybacks to boost its stock and spend its cash hoard. Since January last year, the company has spent more than $120 billion on buybacks. The question, though, is how effective these buybacks are to retail investors.
Large companies with growth problems have used buyback programs as short-term solutions for sluggish performance. In the short-term, share repurchases can help boost a stock price. However, in the long-term, Apple’s share price growth will depend on the performance of certain specific segments. The chart below shows Apple’s diluted EPS growth in the past five years.

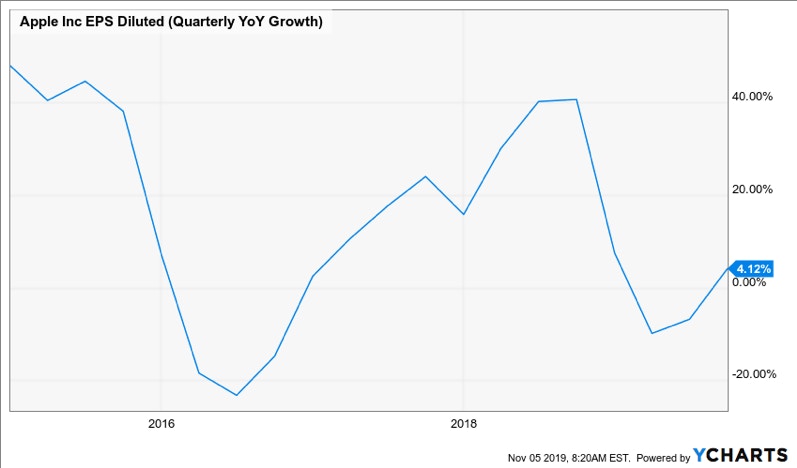
Source: Ycharts
Technical Outlook for Apple’s Stock Price:
Structure
As a technical analyst, I do not go against the trend until I see either a rewarding risk/return set-up at key levels, or a noticeable shift in trend emerges. Apple is currently in an incredibly strong uptrend since bottoming in December of 2018; however, Apple’s stock price is at a significant level.
It’s worth noting that it’s 2019 uptrend appears to be in a corrective fashion – a series of 3 waves up, which is always point of caution. Typically, when I see this, it points to a correction in a larger degree prevailing trend.
Furthermore, if we take the length of the first wave up off the December low to its peak in May of 2019, it went up 51.63%. After bottoming out in July of 2019, Apple’s stock price began the current wave up. You’ll notice that Apple’s share price is at the symmetrical percentage growth of the first wave – 51.63%, which coincides with the 100% extension.
In technical analysis, the market tends to move in symmetry, especially in corrections, and the $258-$262 range will act as major resistance for Apple’s continued charge up. This is exactly what we have seen as well, as Apple’s stock price has been hovering around this level for many trading days. If it can close above the $262 range and hold on to that region, I believe there is a strong possibility that it will trade up to the 250% extension of the 30-year cycle uptrend of around $300.
However, if Apple cannot break above the $260 range, it could retest the $222 price range. If it falls below this range then the yellow target box will be in play, thus confirming that the uptrend from the December low was merely a powerful correction in a much larger decline.
Also Read: Apple is Not a Growth Company Anymore
Internal Strength
If we look at Apple’s internals, a few points jump out. For one, the volume is decreasing as the stock price is increasing, suggesting there’s not broad participation in this uptrend, and that may be the result of weak buying volume on top of even weaker selling pressure. If this is the case, as soon as buyers get exhausted, we could see a sharp decline.
The MACD is currently at its highest point in Apple’s history, the second highest was in September of 2018. An elevated MACD is a bullish sign, but when we hit extremes, it becomes a point of caution. The RSI is in a current uptrend along with price. If this uptrend breaks along with the price, we could be in for a retest of important support zones. I will be watching the RSI for a clue to a change in momentum.
Knox Ridley runs a premium site alongside Beth Kindig. You can check out her fundamental analysis on Apple on this site.


More To Explore
Newsletter

Nvidia, CXL, and the Battle to Improve AI Inference Economics
This is Part 2 of our two-part series on AI inference economics. In Part 1 — Why Nvidia's Next AI Battle Is About Tokens per Watt, we laid out why tokens per watt has become the defining metric for in

Why Nvidia’s Next AI Battle Is About Tokens per Watt
As hyperscalers move from building AI infrastructure to monetizing it, tokens per watt helps to reflect if revenue is scaling and if profitability is improving. Offload engines can increase tokens per

Micron Is Up 900%. Here’s Why the AI Memory Trade May Still Have Room to Run
Over the past 10 months, memory chip stocks have gone from being solid beneficiaries of the AI boom to capturing a massively outsized piece of the return pie. The inflection in Micron’s performance de
Why the S&P 500 Shrugged Off the Iran War — and What Could Finally Break the Rally
On February 28th, the U.S. went to war with Iran, and the market was handed the kind of shock it hasn't contended with for years. The conflict set off a chain reaction across the region: an ongoing su
Nvidia, CoreWeave, and Nebius: Inside the Circular Financing of the GPU Boom
Neoclouds are one of the more hotly debated AI business models, with CoreWeave and Nebius being the two most widely recognized names. These companies have seen their sales, backlog, and share prices s
AMD, Nvidia, Arm, Intel: Inside the $120 Billion CPU Gold Rush
CPUs have gone from an afterthought to becoming the AI trade’s next great bottleneck – and with AMD, Nvidia, Arm and Intel circling a market that is doubling nearly overnight, the only question left i

Google TPU v8 vs Nvidia: How Inference Is Rewriting the AI Market
In April, Google announced it would begin selling its TPUs to select third-party data center operators, which is something the market has anticipated for nearly a decade. The TPU-versus-Nvidia-GPU deb

The AI Networking Stock That Beat Nvidia by 7X YTD for Returns of 135% YTD
AI networking stock Lumentum is among the key I/O Fund winners in 2026. We allocated heavily to LITE in January—a month before Nvidia backed the company. While most investors couldn’t stomach taking a

Bloom Energy — Our 2026 Top Pick Was the Best Performing Stock in April
April was the best month in six years for the Nasdaq-100. The single best-performing large-cap stock wasn't Nvidia, Microsoft, or Meta. It was Bloom Energy, up roughly 109% in one month. As you'll rec

Inside Nvidia’s $4B Optical Strategy—and Why CPO Changes Everything
Within the AI investment theme, there is nowhere that the supply chain shifts faster than in networking, leading companies to gain content on new platforms or lose incremental share. The reason is str
