S&P 500 Outlook 2026: Rising Volatility Risk and Key Support Levels
February 05, 2026

Knox Ridley
Portfolio Manager
The performance of the S&P 500 in 2025 was a rare anomaly in market history. We witnessed a technical bear market that lasted a mere two months, followed by an aggressive, nearly vertical recovery. Within six months of the February 2025 top, the index was trading double digits over the high—a feat seen only twice in 125 years (1980 and 1999).
Interestingly, both prior periods align with key market cycles—the 45-year cycle (1980) and the 26-year cycle (1999), which we covered in detail in our last market update, Market Cycles, Not Headlines: What History Says About the 2025 Rally and What Comes Next. The similarities between today and these cycles were too close to ignore and helped keep us aligned with the prevailing trend through most of 2025’s recovery and into year-end.
“The 45-year and 26-year cycles appear to be the prevailing forces. As long as the SPX holds between 6,552.50 and 6,345 on any near-term weakness, the market is likely to continue tracking these patterns, both of which point toward the potential for continued strength into year-end.”
Now that we have completed the first month of 2026, nearly every major cycle we track, including the predominant one we are following, is suggesting a period of volatility ahead.
This is further supported by clear and concerning weakness across several major markets, including the Mag 7 Index, Bitcoin, High Beta Growth, and even Financials. Like dominos, we are seeing these supporting markets top out earlier, which can serve as a warning for the broader market. This is also occurring alongside extreme bullish sentiment by retail and institutional investors, who appear heavily allocated to equities by any historical measure.
Although my base case is that October marked the start of a multi-month topping process that is still playing out, we always have a backup plan at the I/O Fund given we champion risk management (we don’t blindly rely on predictions). Below, I discuss what you need to know about the broad market and how it’s informing a top-performing tech portfolio as we enter 2026 at all-time highs
Under the Hood of the Rally: Divergences in the Mag 7, High Beta, Bitcoin, and XLF
Markets, sectors, and stocks do not move in unison, which can provide advanced warning of a trend change. This phenomenon is known as divergence, and it is a key element of technical analysis as well as an integral part of our risk assessment process.
For example, we highlighted notable divergences in real time around the October 2022 low. These signals suggested a low was forming and could be durable:
“We are seeing multiple key sectors within the U.S. not follow the S&P 500 down to a new low last week. Transportation stocks, High Beta and Small Caps have been leading the markets since 2021, and last week, when the S&P 500 made a new low, these risk-on markets made a new high. These types of divergences tend to signal a trend change is brewing…. I do believe many stocks and some markets have bottomed.”


S&P 500 (SPX) technical analysis chart highlighting a divergence between the S&P 500 trending lower while high‑beta stocks, small caps, and transports trend higher—signaling improving market breadth beneath headline index weakness.
Magnificent 7 (Mag 7)
The Magnificent 7 have been the current bull market leaders, helping drive the recovery out of the 2022 bear market and often providing early signals of broader market shifts. We discussed this in our broad market article, The Magnificent 7 Are Falling Like Dominos; Only 3 Remain, which was one of the reasons we positioned more defensively into early 2025.
mid
Since November 2021, when the equal-weight Mag 7 Index does not confirm a new high in the S&P 500, it has been a reliable signal of a weakening market environment. A similar divergence is occurring today and, until it resolves to the upside, it remains a meaningful warning for the durability of the broader uptrend.


S&P 500 (SPX) technical analysis chart comparing the S&P 500 with the equal‑weight Mag 7 index, showing repeated periods of market stress highlighted by shaded zones where mega‑caps lag broader market strength.
Looking under the hood, only 1 stock out of the Mag 7 is pushing to new highs alongside the S&P 500—Google.


S&P 500 (SPX) technical analysis chart showing that among the Magnificent 7 stocks, only Google is reaching new highs in line with the S&P 500, while Microsoft, Nvidia, Meta, Amazon, Apple, and Tesla all lag. This highlights market divergence and weakening breadth within top tech leaders.
Microsoft, Nvidia, Meta, and Amazon topped between October and November 3 of 2025. Apple topped in early December, while Tesla topped in late December. On average, the six laggards are more than 15% below their all-time highs, and collectively they account for more than 28% of the S&P 500’s weighting.
However, it’s not just the Mag 7 signaling potential weakness.
High Beta Growth (ARKK)
High beta growth stocks tend to perform well in a specific environment – economic growth is accelerating while inflation is decelerating. In this environment, revenue growth tends to be the driving force behind investor psychology, while ignoring other line items within a company’s fundamentals.
These riskier stocks have been leading the market off the April low, until topping in early October, as it remains comfortably below all-time highs. The bounce off the late November low did not resemble a clean continuation of the uptrend, which is being confirmed with a drop below $73.50. It is likely ARKK (high beta proxy) will provide final confirmation with a bounce that will make a lower high.


ARKK Innovation ETF technical analysis chart showing a completed five‑wave advance followed by an A‑B‑C corrective decline, with weakening volume and momentum signaling risk of a deeper pullback toward Fibonacci support levels.
Bitcoin (BTCUSD)
Bitcoin is a risk asset that tends to be sensitive to global liquidity, which we have extensively discussed in prior articles, including I/O Fund Called the Bitcoin Selloff: What Liquidity & DXY Predict Next.
A simplified way to think about this correlation is that the ease one can access credit with cheap collateral, the more money is left over to buy risk assets, like bitcoin. Since mid-2025, we have seen liquidity trend lower, which historically affects markets around the margins – i.e., crypto and high beta equities. This was one of the reasons we exited roughly 90% of our Bitcoin exposure at an average cost basis of $105,017.
More concerning, Bitcoin appears to have formed a secular top based on the pattern traced off the 2022 low.


Bitcoin (BTCUSD) technical analysis chart showing a completed five‑wave rally followed by a corrective A‑B‑C structure, with weakening volume and persistent RSI downtrend suggesting risk of a deeper pullback toward key Fibonacci support zones.
Not only does a completed five-wave pattern appear to have topped in late October, but Bitcoin’s internals have shifted into a less constructive posture. Note how volume expanded with price from the 2022 low into the late-2024 high. During that period, rallies were generally accompanied by rising volume. Also, RSI tended to find support around the 33.5 region on dips—often referred to as a bull-market support zone.
Since the last advance into 2025, volume decelerated as price increased and then expanded as price declined. Buyers appeared to fade and sellers became more aggressive, shifting supply/demand dynamics. This was reinforced by a break in RSI support and an inability to regain the prior trend line. These are the types of signals we often see early in trend transitions and do not bode well for crypto—and potentially other risk assets—in the coming months.
This also is not the first time Bitcoin weakened materially while the broad market continued higher. The last time we saw this was late 2021.

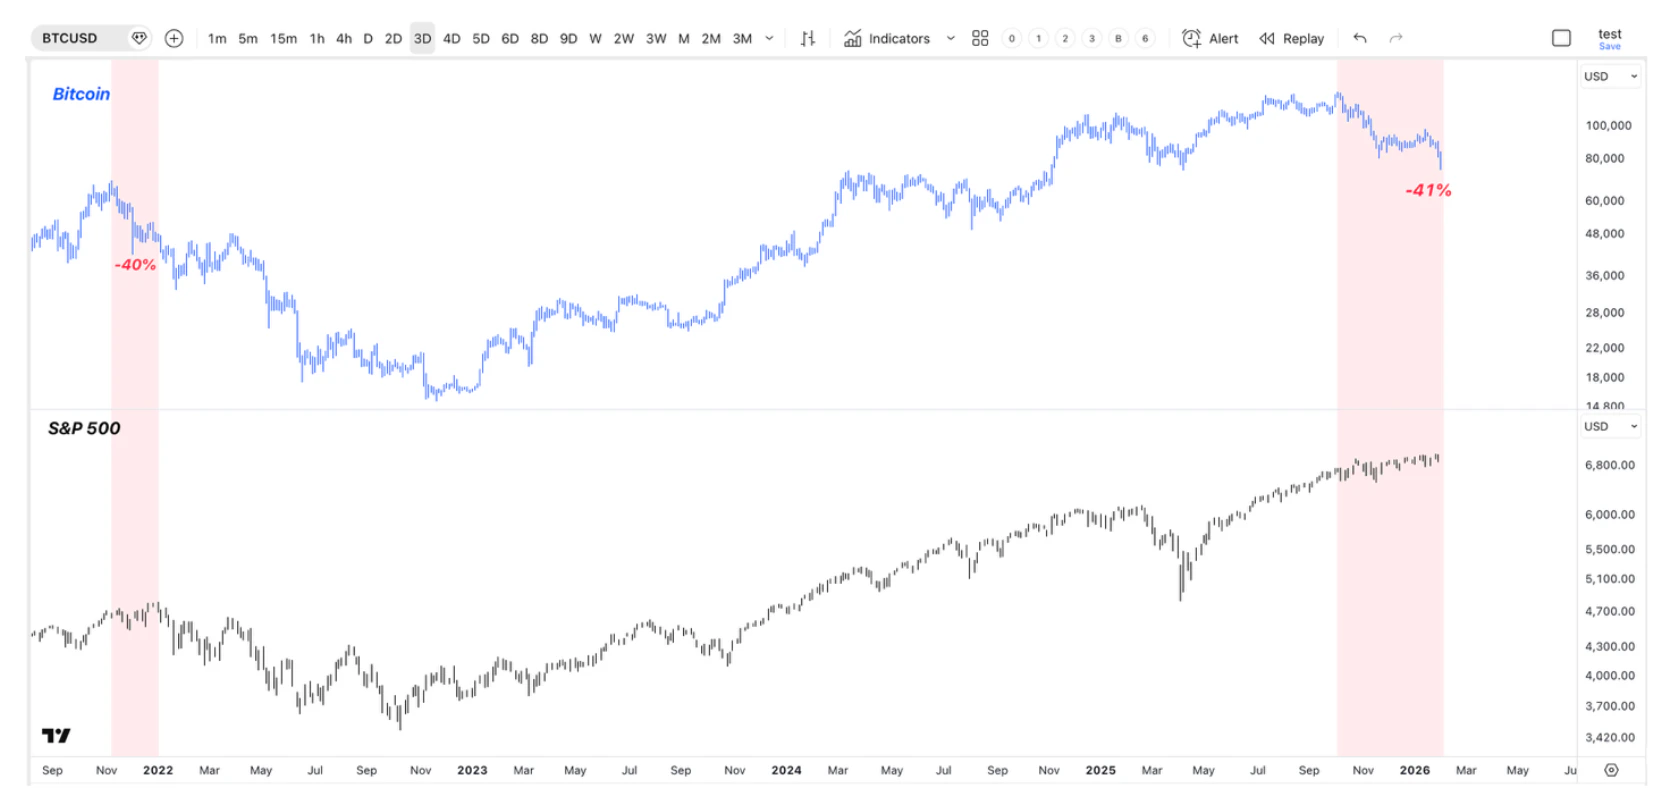
Comparative chart of Bitcoin (BTC) vs. S&P 500 (SPX) performance showing Bitcoin’s sharp drawdowns of roughly 40% during prior risk‑off periods with the S&P 500’s steadier performance, highlighting repeated cycles where Bitcoin enters deep corrections while equities remain more resilient.
Bitcoin topped nearly two months before the S&P 500 and dropped over 40% before the S&P 500 followed. Today, Bitcoin topped roughly three months before the S&P 500 and has also dropped over 40% while the broad market continues its advance.
Financials (XLF)
It’s not just risk-on sectors showing stress, either. Financials, next to Technology, are one of the most important sectors in U.S. (and global) markets. It has also been a leading sector off the April 2025 low until recently. In fact, the chart suggests a top may be forming in XLF.


XLF Financials ETF technical analysis chart showing a completed five‑wave advance into major resistance, followed by weakening volume and bearish momentum divergence—signaling risk of a corrective pullback toward lower trend‑channel support.
Note the clear five-wave structure off the April low. Price went vertical in April–May as volume and momentum expanded (often consistent with a third wave). A period of congestion from September through November 2025 followed (often consistent with a fourth wave). The final push higher into early January appeared to occur with decelerating volume and momentum (key characteristics that define the psychology of the final 5th wave).
Finally, the drop from the January 2026 high is deeper than what is typical in a healthy, ongoing uptrend. Taken together, the odds that financials have entered a period of weakness are elevated.
Contrarian Investing: How AAII and NAAIM Surveys Signal an S&P 500 Reversal
Bull markets end when there are no buyers left—when everyone who wants to buy has already bought, leaving only one direction for markets to go. For that reason, it is worth tracking what both professional money managers and retail investors are doing with their money.
For this, we use the AAII weekly survey (retail sentiment and positioning) and the NAAIM weekly survey (professional manager exposure). The model below ranks each weekly reading as a percentile relative to the history of the surveys. The higher the percentile, the more bullish the reading.


Sentiment table of AAII Bullish-minus-Bearish spread and NAAIM Exposure Index for 2026 highlighting elevated stock exposure and strong bullish sentiment through late 2025 into early 2026, with persistent low cash levels and declining bearish sentiment signaling increasingly crowded optimism.
Since late October—around when several markets began topping out—NAAIM readings have ranged between the 78th and 96th percentile of all bullish readings, suggesting managers have been heavily allocated to equities for more than three months, and maintain this exposure. The AAII readings also suggest retail investors have been positioned heavily in stocks, with relatively little cash.
When compared to levels seen before prior market tops, these readings suggest sentiment and positioning are among the more extreme observations on record.


S&P 500 Sentiment Comparison Table: Identifying NAAIM and AAII sentiment readings at major S&P 500 market tops, showing that current levels—high stock exposure, elevated bullish sentiment, low cash, and a strong bull‑bear spread—closely match historical conditions seen at previous peaks.
In other words, both retail and professional investors appear to expect higher prices and have expressed that view through high equity exposure. What is more concerning is that margin debt in the U.S. is at record highs, surpassing the 2021 peak.


S&P 500 (SPX) margin debt chart highlighting how rising margin debt at broker‑dealers has historically aligned with major S&P 500 peaks, with current margin levels approaching prior extremes that preceded significant market tops.
This section is what defines contrarian investing. Investing in public markets is a zero-sum game, and in order to keep pushing higher, new buyers have to be found at higher prices. Once everyone is all in, it increases the risk of a reversal, which is needed to reset sentiment for the next leg higher.
Market Cycles & Liquidity: Why Gann’s 26-Year Rhythm Forecasts 2026 Volatility
Decades of research suggests that market movements often unfold in rhythmic, repeating patterns influenced by human psychology and broader market structure. These cycles imply that many of the same behavioral forces that shaped prior bull and bear markets can continue to influence markets today, while offering a general roadmap of what is to come.
W.D. Gann, known for his work on market cycles, identified several recurring cycles that often appear to correlate with major market movements. The 45-year cycle, which aligns with the 1980 period, and the 26-year cycle, which aligns with the 1999 period, are two that have historically exerted influence on broader market trends. The fact that the only two comparable periods in 125 years that resemble the anomalous year we had in 2025 also correspond to major cycles Gann discussed makes these comparisons noteworthy.
In 1980, the market dropped just over 20% in less than two months, followed by an aggressive 50% move off the low that lasted roughly nine months. In 1998, the market also dropped just over 20% in less than two months, followed by a 53% rally off the low that lasted roughly ten months. Today, after another 20% drop over roughly two months to start 2025, we are now in the 10th month of an aggressive rally that is ~45% off the April low.
Because the current trend has moved into its 10th month, it appears to be tracking the 26-year cycle more closely. That cycle suggests a continuation of the broad market uptrend into late February, followed by a notable correction.


S&P 500 (SPX) technical analysis chart comparing the 2026 price action to the 1999 26-year market cycle, highlighting a February 2026 volatility window.
Furthermore, if we create a composite of the major cycles, it suggests a choppy push higher into late March, followed by a period of volatility.


Technical forecast chart for S&P 500 (SPX) showing the composite of major market cycles—60, 52, 49, 45, 30, 26, 20, and 15‑year cycles—projected into 2026, highlighting a potential market peak in March followed by a sharp downside trend into late 2026.
Interestingly, across the major cycles that tend to influence market movements, all of them suggest an elevated probability of volatility in Q2/Q3, and only 3 of 8 suggest the year finishes higher. We do not know which cycles will correlate with the current trend. In 2022–2025 it was the 60-year cycle, and from 2025 through today it has been the 26-year cycle. However, the probabilities support expecting a potential period of volatility beginning in Q1.
Why Markets Can Still Grind Higher: Key Support Levels and Sector Rotation
The primary reason the market can continue to grind higher into Q1 is that no major support level has broken yet. Even with the warnings noted above, the upward drift can persist until key levels fail.
The reason for this is that Markets tend to move within established patterns, and the further an advance extends, the fewer bullish structures remain available to sustain it. For the current patterns to continue, specific support levels must hold. If those levels break, the number of viable upside paths narrows materially, increasing the probability of a larger drawdown.
While the S&P 500 pattern still has room for another swing higher, it is unlikely that this very extended pattern can persist deep into 2026 without some type of reset. We appear to be tracing the final swings in an extended fifth wave.


S&P 500 (SPX) Elliott Wave chart for 2026 highlighting a potential Elliott Wave structure with support tests near the 100% retracement zone and bullish upside targets toward 7,300–7,900, highlighting key inflection points for the next trend move.
As long as further weakness holds above 6,780–6,720, the pattern appears incomplete and points toward 7,132–7,375 in the coming weeks.
This is supported by Semiconductors (SMH), one of the most important markets in this bull cycle, which also appears to be tracing an incomplete uptrend. As long as any additional weakness holds above $383–$367, SMH likely needs at least one more swing higher in the coming weeks.


SMH Semiconductor ETF technical analysis chart highlighting a Wave (iv) corrective pullback to the $383–$358 support zone and a projected Wave (v) breakout toward Fibonacci targets of $440–$513.
Another reason we could see the market extend is sector rotation. In early 2025, risk-on sectors such as Tech, High Beta, and Transports underperformed more defensive areas. We are not seeing that today.
In fact, since the October 2025 high, we have seen a rotation from a tech-led risk-on regime to a broader risk-on participation.


Market leadership performance table from Oct 2025 to Feb 2026 showing Google, Gold, Biotech, Energy, and materials leading gains, while high‑beta stocks, Nvidia, Tesla, Meta, and Microsoft lag sharply, highlighting a shift toward defensive and reflation sectors.
Lagging groups such as Consumer Discretionary, Small Caps, Transports, Retail, and Industrials have rotated higher as High Beta and much of the Mag 7 have lagged. For now, this suggests broader risk participation, which is constructive. Until we see support levels break in major indexes and an orderly (or disorderly) rotation into defensives, we could see the market grind higher into February/March.
Conclusion
In conclusion, the major market cycles we track suggest an elevated probability of volatility in Q2/Q3. This is supported by extreme bullish sentiment among both professional and retail investors, who appear heavily allocated to equities and using record levels of margin. We are also seeing several key markets begin a topping process dating back to October 2025, some of which could be signaling more than a standard correction, even as the S&P 500 continues to drift higher.
At the I/O Fund, we don’t focus on predicting the market’s exact path. Instead, we steer the portfolio based on the key levels the market holds or breaks through. Most importantly, we always operate with a plan, and at this stage, that plan is increasingly defensive.
The I/O Fund published a 60+ page report (over 20,000 words) that details our Top 15 AI Stocks for Q1 2026. In the report, we identify lesser-known stocks across AI chips, AI networking and AI energy that are leading the way, with nearly $600 billion in Big Tech capex now in motion.
Sign up to receive the full 50-page Top 15 AI Stocks report plus an invite to Knox Ridley’s upcoming webinar held Thursday at 4:30 p.m. Eastern.
Please note: The I/O Fund conducts research and draws conclusions for the Fund’s positions. We then share that information with our readers. This is not a guarantee of a stock’s performance. Please consult your personal financial advisor before buying any stock in the companies mentioned in this analysis.
Recommended Reading:


More To Explore
Newsletter

Big Tech Earnings Preview: Is AI Monetization Finally Catching Up to Capex?
The most pronounced difference between 2026’s tech rally compared to rallies in the past is which companies have been left out of it. The names most associated with the AI trade have hardly participat

Nvidia, CXL, and the Battle to Improve AI Inference Economics
This is Part 2 of our two-part series on AI inference economics. In Part 1 — Why Nvidia's Next AI Battle Is About Tokens per Watt, we laid out why tokens per watt has become the defining metric for in

Why Nvidia’s Next AI Battle Is About Tokens per Watt
As hyperscalers move from building AI infrastructure to monetizing it, tokens per watt helps to reflect if revenue is scaling and if profitability is improving. Offload engines can increase tokens per
Micron Is Up 900%. Here’s Why the AI Memory Trade May Still Have Room to Run
Over the past 10 months, memory chip stocks have gone from being solid beneficiaries of the AI boom to capturing a massively outsized piece of the return pie. The inflection in Micron’s performance de
Why the S&P 500 Shrugged Off the Iran War — and What Could Finally Break the Rally
On February 28th, the U.S. went to war with Iran, and the market was handed the kind of shock it hasn't contended with for years. The conflict set off a chain reaction across the region: an ongoing su
Nvidia, CoreWeave, and Nebius: Inside the Circular Financing of the GPU Boom
Neoclouds are one of the more hotly debated AI business models, with CoreWeave and Nebius being the two most widely recognized names. These companies have seen their sales, backlog, and share prices s

AMD, Nvidia, Arm, Intel: Inside the $120 Billion CPU Gold Rush
CPUs have gone from an afterthought to becoming the AI trade’s next great bottleneck – and with AMD, Nvidia, Arm and Intel circling a market that is doubling nearly overnight, the only question left i

Google TPU v8 vs Nvidia: How Inference Is Rewriting the AI Market
In April, Google announced it would begin selling its TPUs to select third-party data center operators, which is something the market has anticipated for nearly a decade. The TPU-versus-Nvidia-GPU deb

The AI Networking Stock That Beat Nvidia by 7X YTD for Returns of 135% YTD
AI networking stock Lumentum is among the key I/O Fund winners in 2026. We allocated heavily to LITE in January—a month before Nvidia backed the company. While most investors couldn’t stomach taking a

Bloom Energy — Our 2026 Top Pick Was the Best Performing Stock in April
April was the best month in six years for the Nasdaq-100. The single best-performing large-cap stock wasn't Nvidia, Microsoft, or Meta. It was Bloom Energy, up roughly 109% in one month. As you'll rec
