FAAMG Stocks Trading At Precarious Valuations
May 15, 2023

Beth Kindig
Lead Tech Analyst
This article was originally published on Forbes on May 10, 2023,07:45am EDT
The mega-cap stocks that are known as FAAMG reported earnings recently. These names are driving the market higher, especially Microsoft and Apple. In fact, the percentage of Microsoft and Apple’s combined weighting in the S&P 500 has never been higher.
The S&P 500 weighting is according to market cap, which is price times float. The longer buying happens in these two names, accompanied with selling in other areas of the index, the percentage weighting becomes stretched to unhealthy extremes. This is not characteristic of a burgeoning bull market; instead, it is the type of behavior we usually see at market tops.
Also worth noting, since the February top, we are seeing a strong rotation into Big Tech while aggressive selling is taking place in other areas of the market. Take a look at the market cap weighted NASDAQ-100, which has over40% weighting into the FAAMG stocks, compared to the equal weighted NASDAQ-100.

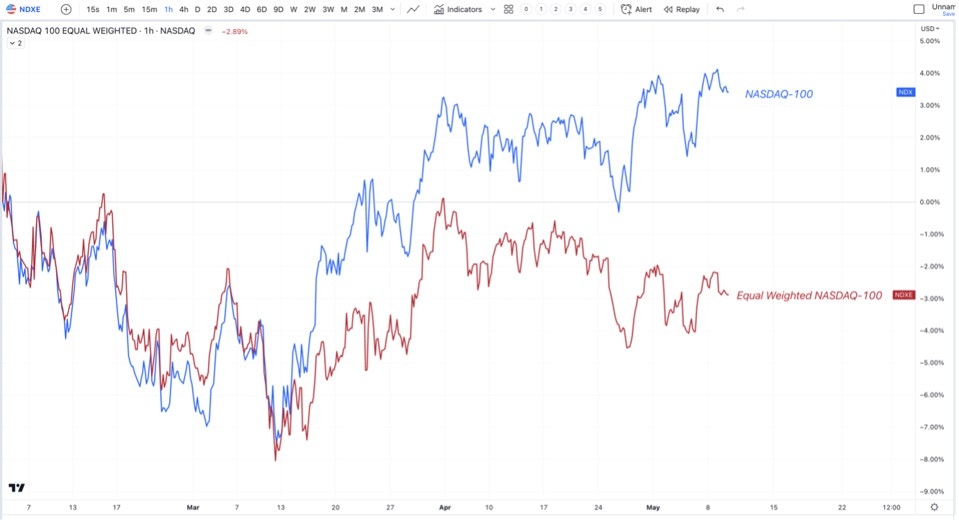
Source: I/O FUND
While the NASDAQ-100 has made a series of higher highs, led mostly by the FAAMG names, the equal weighted index has made a series of lower highs. We are seeing similar price action in small caps as well as most economically sensitive sectors. This is typically not the sign of a healthy market.
FAAMG Stocks Trading at Precarious Valuations
As you’ll see below, there’s little room in FAAMG valuations compared to their 5-year historic averages. Apple and Microsoft both trade above their 5-year median on the top line and bottom line whereas the others are getting quite close given the low growth rates and macro uncertainty. The only exception is Amazon.
Microsoft is leading on valuation at 10 compared to the FAAMGs that are at 7 or below. Most are within range of their five-year average valuation except Amazon at 2.0 today compared to an average valuation of 3.6.

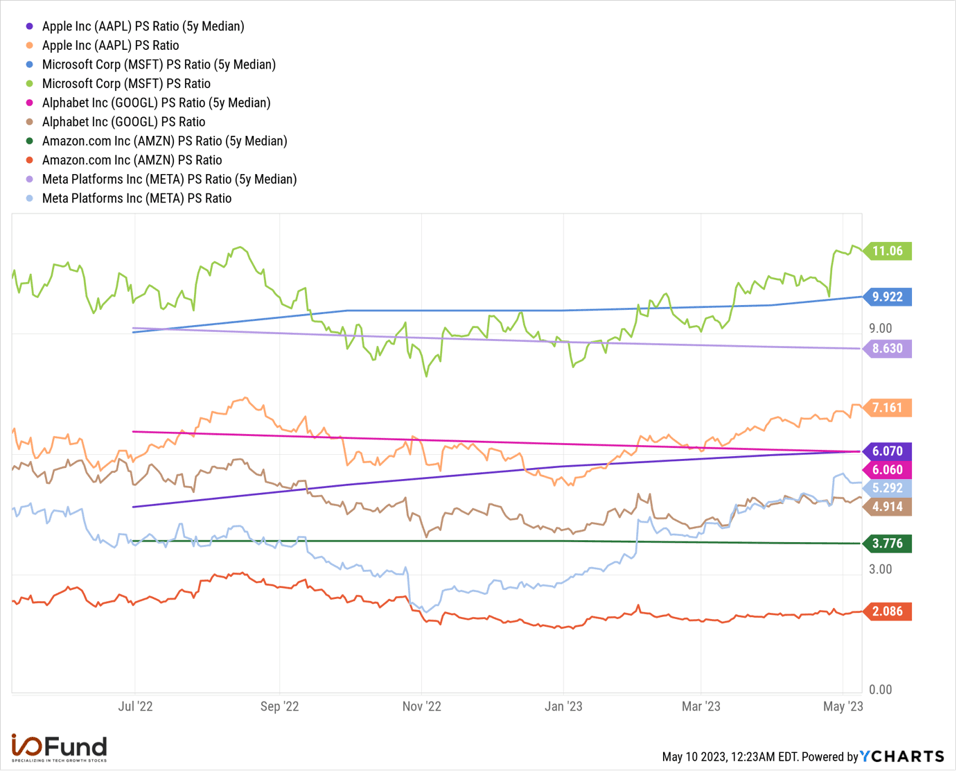
Source: YCHARTS
Amazon has a P/E ratio of 247.79, compared to 32.96 for Microsoft, 29.22 for Meta, 28.13 for Apple, and 23.32 for Alphabet. The FAAMGs are trading within range of their historical valuation except for Amazon with a five-year average P/E ratio of 93.48.

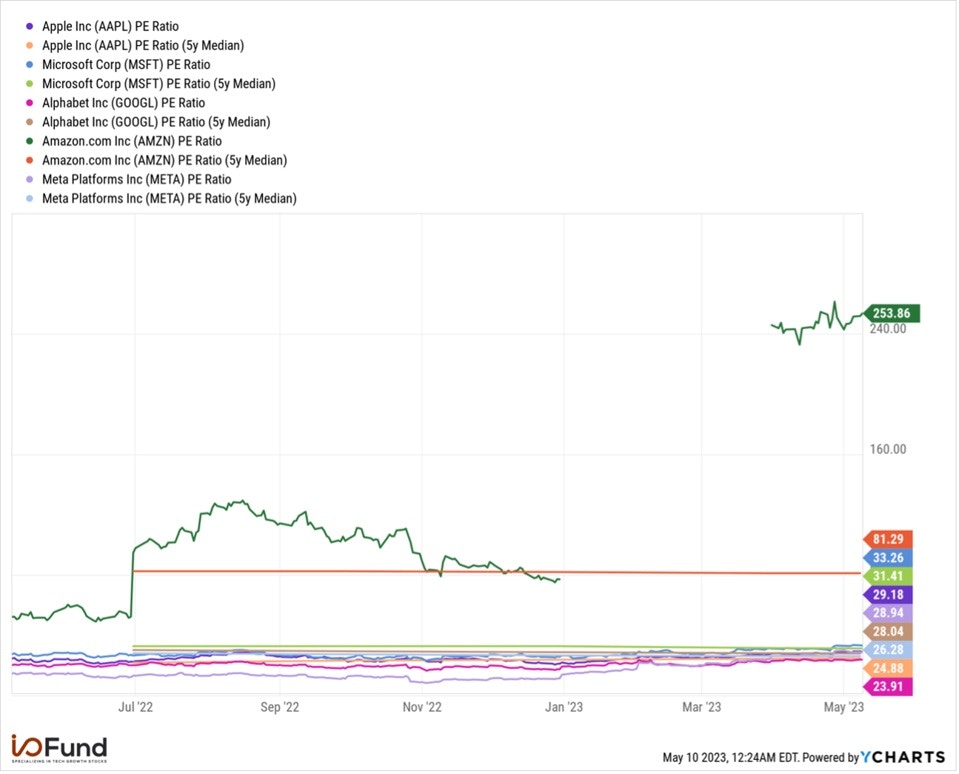
Source: YCHARTS
Sign up for I/O Fund's free newsletter with gains of up to 221% - Click here
FAAMG Earnings Overview:
There were some puts and takes in the most recent earnings reports. Despite price telling us we could be nearing a top, there are some fundamental signs that FAAMG stocks may be overstretched in the near term.
Below, you’ll find that consensus points toward a bottom for FAAMG stocks yet it will require consensus materializing in the coming quarters in order for the stock price action to hold. In other words, the market has front run the rebound in growth and now we must wait and see if this rebound unfolds.
Alphabet: Search is Resilient
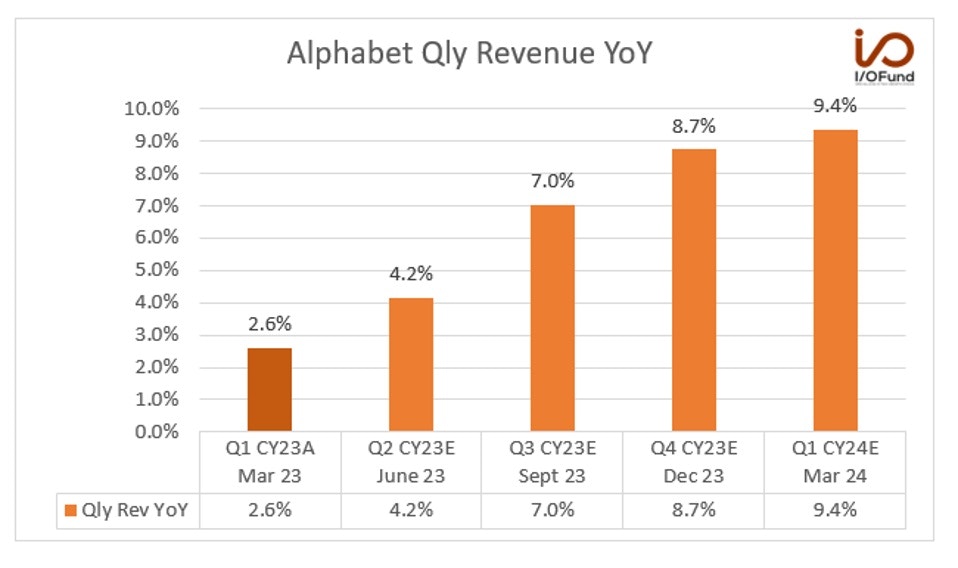
Alphabet’s revenue grew by 2.6% YoY or 6% in constant currency, for a total of $69.8 billion, primarily helped by the resilience in Search and the momentum in Cloud business. Although this is marginal growth, below you can see that Alphabet is expected to accelerate in revenue growth over the next few quarters from 2.6% to an expected 9.4% in Q1 of next year.

Source: SEEKING ALPHA
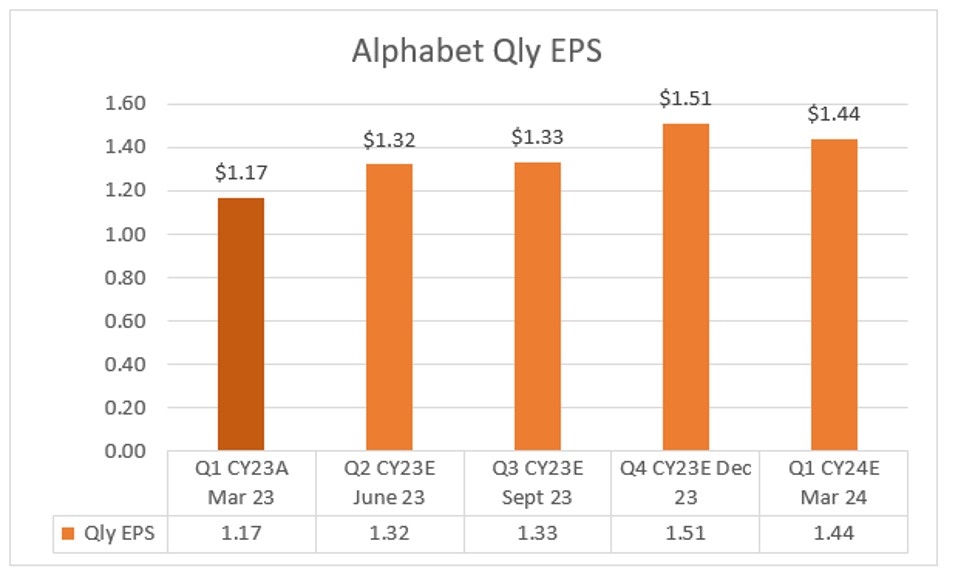
Operating margins were soft at 25% of revenue compared to 30% last year. Net income declined (8.4%) YoY to $15.1 billion. This resulted in EPS of $1.17 compared to $1.23 for the same period last year.

Source: YCHARTS
The drop in profits was mainly due to $2.6 billion in charges related to the reduction in the company’s workforce and office space, and was offset by $988 million in depreciation from servers and network equipment.
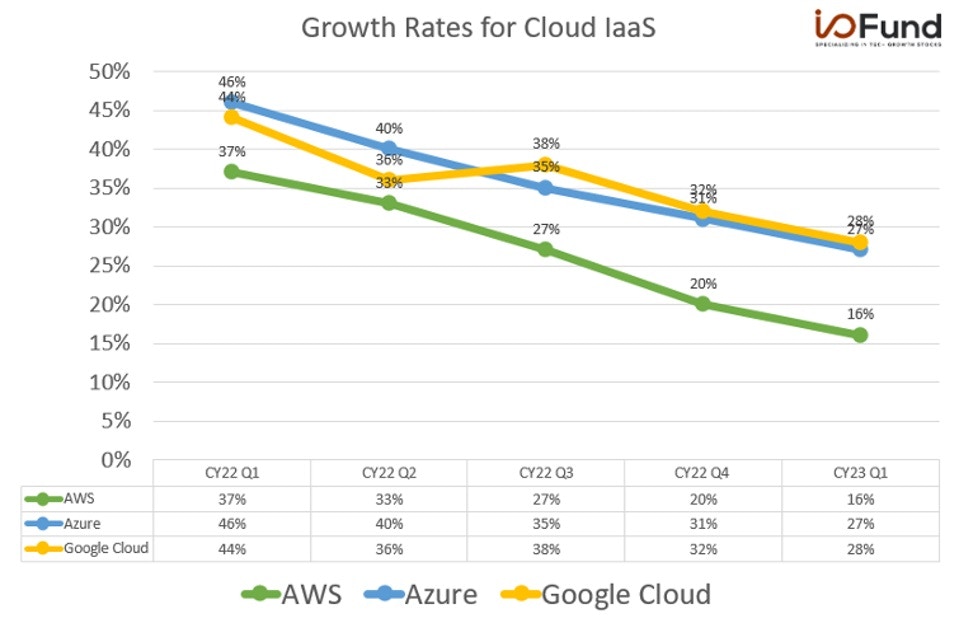
Google Cloud revenue grew by 28% YoY to $7.45 billion and reported its first profitable quarter bringing in $191 million operating income.
Microsoft: Top Line and Bottom Line Beat
Microsoft’s revenue grew 7.1% YoY and 10% in constant currency to $52.9 billion. Management’s revenue guidance for next quarter is $54.85 billion to $55.85 billion, representing YoY growth of 6.7% at the mid-point. Similar to Google, a noticeable acceleration is expected in the second half of the year.


Source: SEEKING ALPHA
Azure grew by 27% and 31% YoY in constant currency and came in at the higher end of management guidance of 30% to 31%.This is down from 38% growth in constant currency last quarter. Next quarter will also mark a deceleration with management guiding to 26.5% in constant currency. This includes 1% from AI services.

Source: I/O FUND
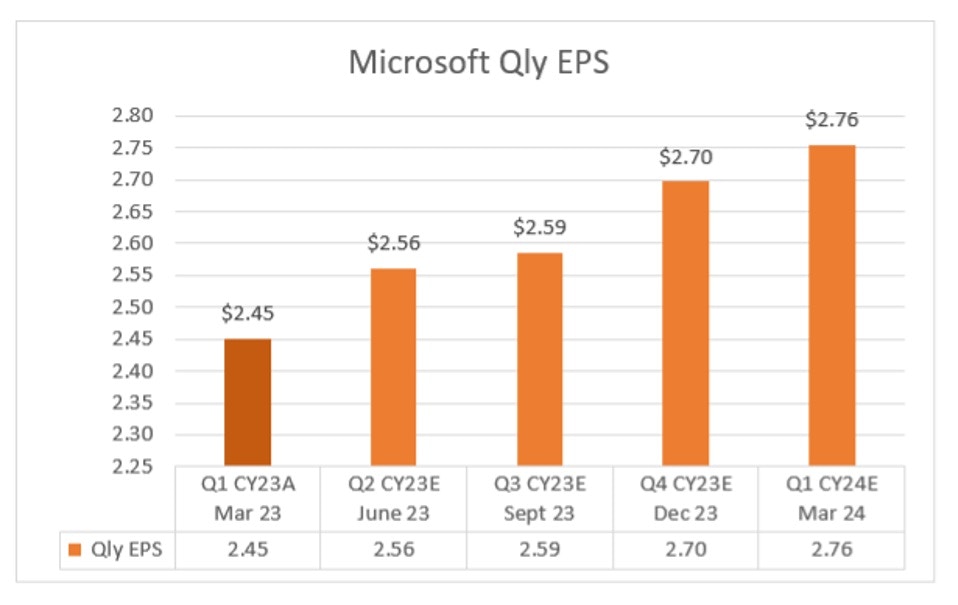
Operating income grew by 9.8% YoY to $22.35 billion. The net profit margin was 34.6% compared to 33.9% in the same period last year which resulted in EPS of $2.45 compared to $2.22 in the same period last year.

Source: YCHARTS
Every Thursday at 4:30 pm Eastern, the I/O Fund team holds a webinar for premium members to discuss how to navigate the broad market, as well as various stock entries and exits. We offer trade alerts plus an automated hedging signal. The I/O Fund team is one of the only audited portfolios available to individual investors. Learn more here.
Meta: Back to Positive Growth
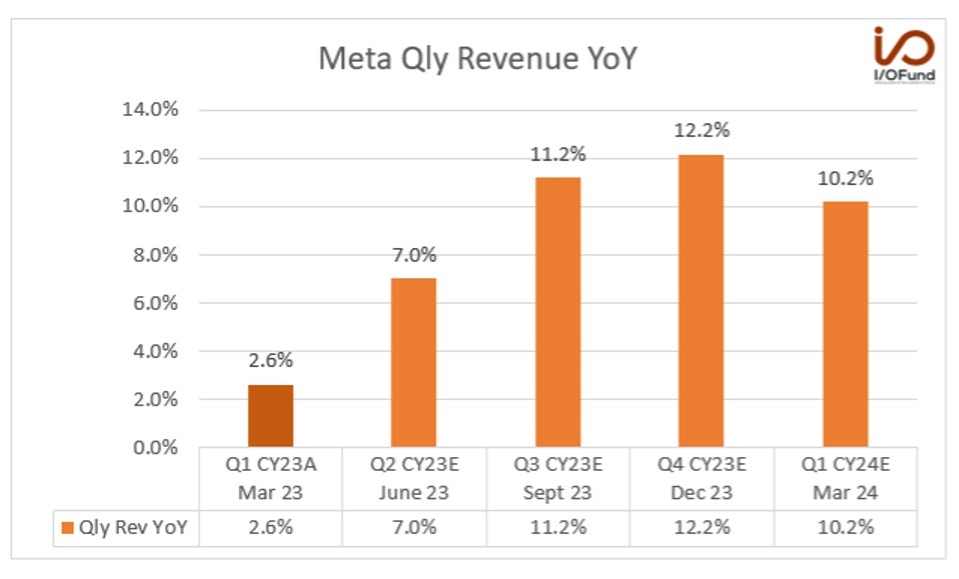
The company’s revenue grew by 2.6% YoY and 6% on constant currency to $28.6 billion. This is a positive as Meta’s revenue has declined YoY in the last three quarters.
Management’s revenue guidance for the next quarter is between $29.5 billion to $32 billion, representing a YoY growth of 6.7% at the mid-point. Analysts expect revenue to grow 7% YoY to $30.84 billion.

Source: SEEKING ALPHA
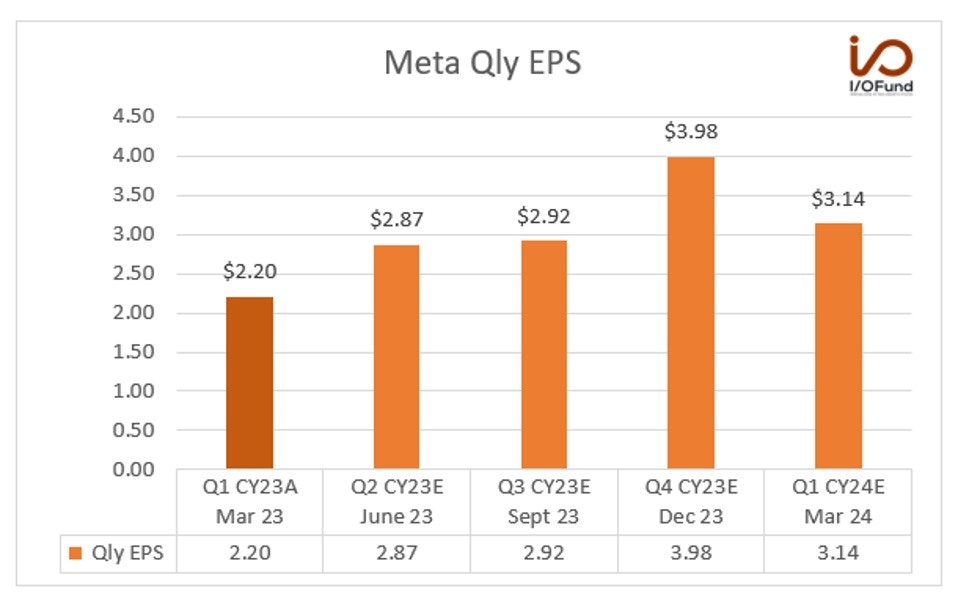
The operating income declined by (15%) YoY to $7.2 billion as total expenses rose 10% YoY. The operating margin was 25% compared to 31% in the same period last year. The net income declined by (24%) YoY to $5.7 billion, resulting in EPS of $2.20 compared to $2.72 in the same period last year.

Source: YCHARTS
The company recorded $1.14 billion in restructuring charges related to layoffs, facilities consolidation, and data center. Excluding these charges, the operating margin would be 4% higher and EPS would be $0.44 higher.
Amazon: AWS is Slowing
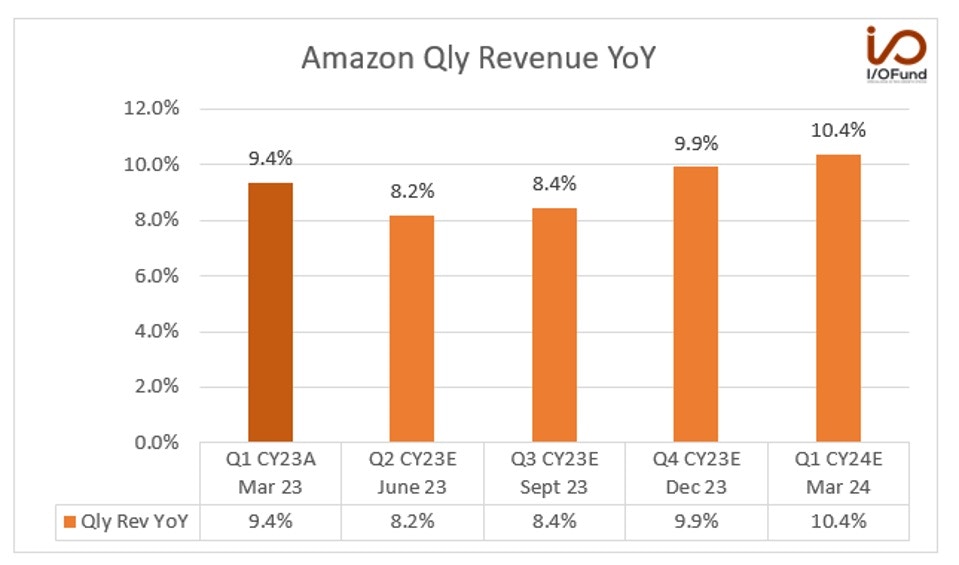
The company’s revenue grew by 9.4% and 11% YoY in constant currency to $127.4 billion. Analyst consensus is for growth of 8.2% next quarter.

Source: SEEKING ALPHA
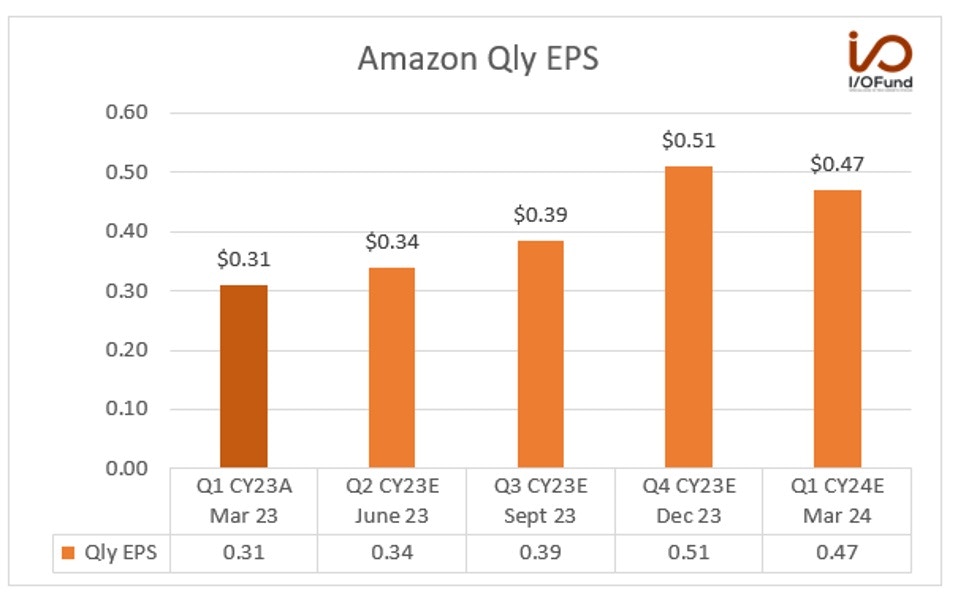
The operating margin was 3.8% compared to 3.2% in the same period last year. Net Income was $3.2 billion or $0.31 per share compared to a net loss of ($3.8) billion or ($0.38) per share in the same period last year.
The net income included a pre-tax valuation loss of ($0.5) billion from the investment in Rivian Automobile compared to a pre-tax valuation loss of ($7.6) billion in the same period last year.

Source: YCHARTS
AWS revenue grew by 16% YoY to $21.4 billion. This is lower than the 20% growth in the December quarter and a remarkable slowdown from the 37% in the same period last year.
Management discussed in the earnings call that April AWS revenue growth further decelerated to 11%. This is due to the ongoing tough macro environment, causing customers to optimize their cloud spending in the recent quarter.
The company’s CEO, Andy Jassy, also highlighted cautiousness in the enterprise customers. “In AWS, what we’re seeing is enterprises continue to be cautious in their spending in this uncertain time. Customers are looking for ways to save money however they can right now. They tell us that most of it is cost optimizing versus cost cutting, which is an interesting distinction because they say they’re cost optimizing to reallocate those resources on new customer experiences.”
Notably, despite the market rewarding Microsoft’s report, cost optimization is not isolated to one hyperscaler and investors can expect to see more evidence of optimizations in future reports.
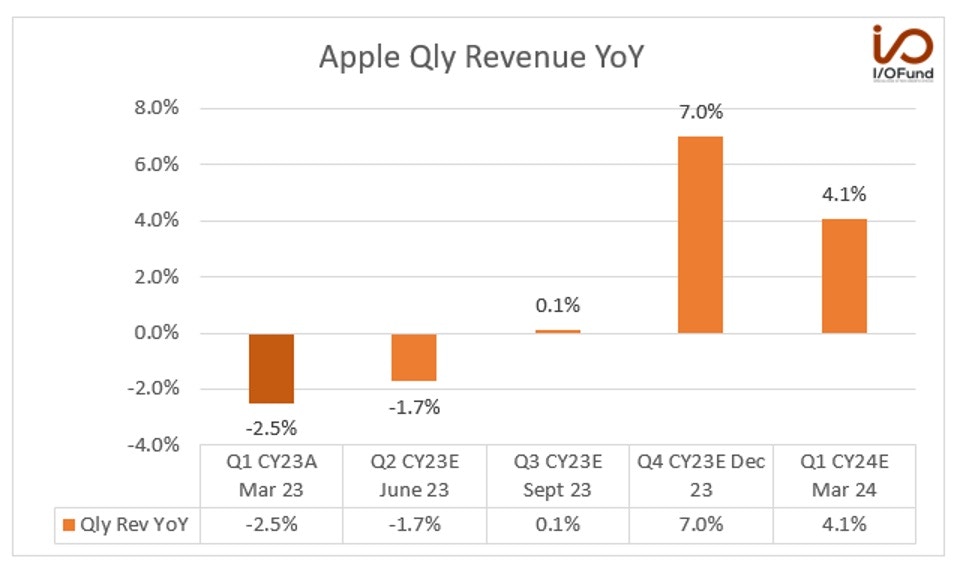
Apple: More Buybacks to Appease the Street
Apple’s revenue declined by (2.5%) YoY to $94.84 billion. Management commented that they expect YoY performance to be similar to the March quarter. Analysts expect revenue to decline (1.7%) YoY to $81.53 billion in the next quarter following these comments.

Source: SEEKING ALPHA
iPhone sales grew by 1.5% YoY to $51.3 billion. Mac revenue declined by (31%) YoY to $7.2 billion. iPad revenue declined by (13%) YoY to $6.7 billion. Wearables, home and accessories revenue was flat, and the services segment revenue grew by 5.5% YoY to $20.9 billion.
The operating margin was 29.9% compared to 30.8% in the same period last year. The operating expenses of $13.66 billion were lower than management guidance of $13.7 billion to $13.9 billion, which the market saw as a positive.
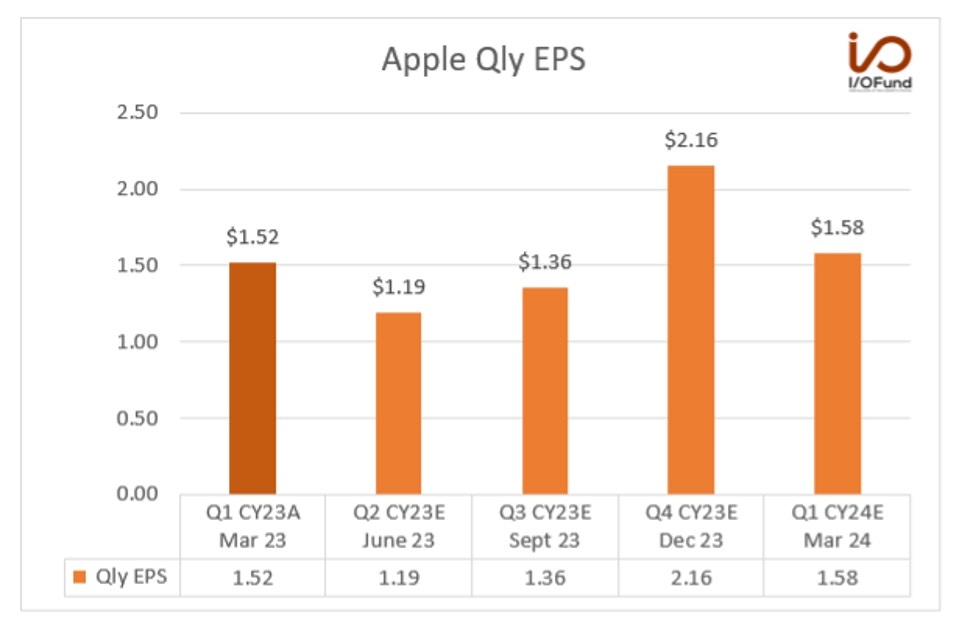
Net income declined by (3.4%) YoY to $24.2 billion with a net profit margin of 25.5% compared to 25.7% in the same period last year. EPS came in at $1.52 and remained unchanged from the same period last year.

Source: YCHARTS
Apple returned $23 billion to the shareholders through dividends and equivalents of $3.7 billion and $19.1 billion in share repurchases. The board also authorized an additional $90 billion share repurchase and increased the quarterly dividend by 4% to $0.24 per share.
Analyst Comments:
Deutsche Bank analyst Benjamin Black raised the firm's price target on Alphabet to $125 from $120 and kept a Buy rating on the shares. He noted, “The company reported solid Q1 results with the biggest takeaway being the stabilizing growth trends at Search and YouTube, which beat Street expectations.”
Wedbush Securities analyst Dan Ives said in a research note. "It's clear that in Redmond's enterprise backyard the company is gaining more market share on the cloud front with many enterprises making this transformational shift on the shoulders of Microsoft," He further said, "Cloud growth and the overall outlook for the June quarter was solid and much better than feared given recent noise in the market and will be music to the ears of investors this morning digesting results."
BMO analyst Keith Bachman upgraded Microsoft (MSFT) shares to outperform. He stated that he now has "higher conviction" that any headwinds to Azure are likely to moderate by the end of the year, while opportunities in artificial intelligence can help the longer-term. "While the stock is not inexpensive, we think the durable growth opportunities warrant a premium valuation."
RBC Capital analyst Brad Erickson raised the firm's price target on Meta Platforms to $285 from $225 and kept an Outperform rating on the shares. Brad said, “The company's Q1 results were better-than-feared and the simple three-fold bull case - dominating engagement vs. competition, restoring lost signal post-IDFA, and cutting costs - is increasingly coming into view.” RBC believes that further upside is still achievable for Meta on engagement share gains and the ongoing conversion improvement eventually leading to incremental spend.
Citi analyst Ronald Josey raised the firm's price target on Meta Platforms to $315 from $260 and kept a Buy rating on the shares. “With engagement rising, newer advertising products attracting incremental spend, and a more streamlined organization, Meta's momentum in Q1 can continue.” the analyst tells investors in a research note.
Conclusion:
We have Buy levels we are targeting for FAAMG stocks, which we share with our premium research members each week as the stocks progress. We believe our target buy levels will set us up for gains in FAAMG stocks when the next bull cycle begins. We provide in depth macro and individual stock analysis so that readers can better understand why we buy/sell. In this market, we frequently take gains.
Right now, we do not believe FAAMG stocks are in a buy zone. Instead, some are trading higher than their 5-year median on valuations despite a weaker macro backdrop and fundamental weakness. The market is front-running the anticipated revenue rebound. Most of this rebound is based off low comps, and there could be soft growth in the future for some of these names.
You can learn more here including information on our next webinar, this Thursday at 4:30 pm Eastern, where we review our positions live.
Equity Analyst Royston Roche contributed to this article.
Recommended Reading:
Meta Stock: The rising expenses and Capex are worrying
Apple’s Stock In Focus: More Profitable Than Banks
Google Stock: Search Is On The Precipice Of Multi-Decade Disruption


More To Explore
Newsletter

Token Growth is Surging - Here Are the Beneficiaries
The reality of AI demand growth has shattered early estimates for token processing, yet expectations continue moving up and to the right. In the second installment of our token processing series, we e

AI Token Demand is Shattering Forecasts
Total annual token processing is no longer measured in billions or trillions of tokens, but in the quadrillions and beyond. As annual token processing is now tracked in units with 15 trailing zeros, i

Nvidia and Google Are Crowding TSMC’s N3 Node - Can Intel Fill the Gap?
Nvidia is moving its next-generation Rubin GPUs from 4nm to 3nm, yet Google’s latest TPUs are already on N3 and are expected to remain there. Meanwhile, a growing number of AI CPUs from Nvidia, Amazon
Intel vs TSMC: How CoWoS Packaging Constraints Could Create an Opportunity for Intel Foundry
Taiwan Semiconductor (TSMC) is the single, most important company to the AI industry. However, to compete with the incumbent, Intel does not need to beat TSMC at leading-edge manufacturing. It only ne
Big Tech’s Free Cash Flow is Turning Negative – Who's Next?
Big Tech’s AI revenue is accelerating, but free cash flow is moving sharply in the opposite direction. Across Google, Microsoft, Meta and Amazon, capex is rising much faster than operating cash flow a
Big Tech Earnings Preview: Is AI Monetization Finally Catching Up to Capex?
The most pronounced difference between 2026’s tech rally compared to rallies in the past is which companies have been left out of it. The names most associated with the AI trade have hardly participat

Nvidia, CXL, and the Battle to Improve AI Inference Economics
This is Part 2 of our two-part series on AI inference economics. In Part 1 — Why Nvidia's Next AI Battle Is About Tokens per Watt, we laid out why tokens per watt has become the defining metric for in

Why Nvidia’s Next AI Battle Is About Tokens per Watt
As hyperscalers move from building AI infrastructure to monetizing it, tokens per watt helps to reflect if revenue is scaling and if profitability is improving. Offload engines can increase tokens per

Micron Is Up 900%. Here’s Why the AI Memory Trade May Still Have Room to Run
Over the past 10 months, memory chip stocks have gone from being solid beneficiaries of the AI boom to capturing a massively outsized piece of the return pie. The inflection in Micron’s performance de

Why the S&P 500 Shrugged Off the Iran War — and What Could Finally Break the Rally
On February 28th, the U.S. went to war with Iran, and the market was handed the kind of shock it hasn't contended with for years. The conflict set off a chain reaction across the region: an ongoing su
